
Abstract
Preclinical evaluation of a new compound, RO2910, identified a hypertrophic response in liver, thyroid gland, and pituitary gland (pars distalis). We aimed to develop and validate automated image analysis methods to quantify and refine the interpretation of semi-quantitative histology. Wistar-Han rats were administered RO2910 for 14 days. Liver, thyroid, and pituitary gland tissues were processed for routine histology and immunolabeled with anti–thyroid stimulating hormone (TSH) antibody (pituitary) and anti–topoisomerase II antibody (thyroid). Glass slides were scanned, image analysis methods were developed and applied to whole-slide images, and numerical results were compared with histopathology, circulating hormone levels, and liver enzyme mRNA expression for validation. Quantitative analysis of slides had strong individual correlation with semi-quantitative histological evaluation of all tissues studied. Hepatocellular hypertrophy quantification also correlated strongly with liver enzyme mRNA expression. In the pars distalis, measurement of TSH weak-staining areas correlated with both hypertrophy scores and circulating TSH levels. Whole-slide image analysis enabled automated quantification of semi-quantitative histopathology findings and a more refined interpretation of these data. The analysis also enabled a direct correlation with non-histological parameters using straightforward statistical analysis to provide a more refined dose- and sex-response relationship and integration among affected parameters. These findings demonstrate the utility of our image analysis to support preclinical safety evaluations.
Preclinical safety evaluation of RO2910, a non-nucleoside reverse transcriptase inhibitor, in rats in some in vitro and in vivo experiments has revealed that RO2910, similar to other structurally related molecules also intended for the treatment of human immunodeficiency virus (Von Moltke et al. 2001; Schöller-Gyüre et al. 2009), caused hepatocellular microsomal enzyme induction, which was associated with histological manifestation of hepatocellular hypertrophy (Zabka et al. 2011). Routine histology also demonstrated hypertrophy of thyroid follicular cells, as well as of pituitary thyrotrophs. Subsequent serum hormone analysis indicated altered levels of thyroid-stimulating hormone (TSH) and thyroxine (T4) but not of triiodothyronine (T3), growth hormone (GH), follicle-stimulating hormone (FSH), luteinizing hormone (LH), prolactin, or adrenocorticotropic hormone. This adaptive physiological response is a well-characterized process that can occur especially in rats during preclinical safety evaluation of xenobiotics (Botts et al. 2010; Maronpot et al. 2010; Zabka et al. 2011). Briefly, in an effort to compensate for the rapid clearance of T3 and T4 in the liver due to xenobiotic-related hepatocellular enzyme induction, thyrotrophs in the pituitary pars distalis are stimulated to secrete TSH, which in turn stimulates thyroid follicular cells to increase secretion of T4 and T3. Consequently, the numerical end points can support the semi-quantitative histological interpretation at a group level (Zabka et al. 2011) and, as demonstrated herein, also refine interpretation at an individual animal level and enable comparison directly with other quantifiable end points.
The use of digital slides is an increasingly common practice in pathology, as it greatly facilitates sharing and retention of histology images (Mulrane et al. 2008; Pantanowitz et al. 2011). In addition to enhancing valuable information sharing, the entire specimen can be scanned and thus considered for the application of image analysis solutions for quantitative assessment of visual/morphological end points, just as the pathologist has the entire histological section available for evaluation and semi-quantitative scoring. Digital slide scanning combined with automated image analysis is of great interest in research, diagnostic, and pharmaceutical preclinical work (Tahir and Bouridane 2006; Kong et al. 2009; Ryan et al. 2011). Although the primary focus has been on diagnostic applications (Bloom and Harrington 2004; Turbin et al. 2008; Minot et al. 2009; Rizzardi et al. 2012), these technologies also can be useful in pharmaceutical preclinical research and development, for evaluation of efficacy and toxicity of new drugs and in support of biomarker discovery (Persohn et al. 2007; Krajewska et al. 2009; Wang et al. 2011). Automated image quantification can perform routine analysis tasks consistently and with high throughput, enabling for complex visual evaluations and greatly reducing interobserver variability (Mengel et al. 2002; Oyama et al. 2007). We aimed to test the feasibility of using whole-slide image analysis as a supportive tool for the pathology evaluation, by comparing semi-quantitative pathologists’ scores with numerical results obtained using custom-made image analysis algorithms that were applied to the entire digital slide specimen. The image analysis algorithms also were validated using relevant quantifiable clinical pathology and molecular end points affected during the study.
Materials and Methods
Wistar (Han) rats, 8 to 9 weeks old, were used for the in vivo dosing. For the in-life study design, 20 male and 20 female rats were randomized into 4 groups of 10 rats each (5 males and 5 females) and administered vehicle or 100, 300, or 1000 mg/kg/d per os (PO) of a study compound for 14 days (designated as groups 1, 2, 3, and 4, respectively). At the end of the study, serum samples were collected and analyzed using radioimmunoassay techniques (reagents provided by Diagnostic Products; Los Angeles, CA) to determine the levels of T3, T4, TSH, GH, and FSH.
Tissue samples were collected and processed routinely to paraffin-embedded blocks to generate 5-µm-thick hematoxylin and eosin (HE)–stained slides for light microscopic evaluation. Additional samples of liver also were collected and snap-frozen for gene expression analysis. Cellular hypertrophy identified in the liver, pituitary gland, and thyroid gland was defined as increased cellular size due to increased cytoplasmic area and was evaluated in histological sections by a board-certified veterinary pathologist. The severity of routine histological and immunohistochemical findings was scored semi-quantitatively as 1 (minimal), 2 (mild), 3 (moderate), 4 (marked), or 5 (severe) as compared with the control group and of the same sex if relevant to the finding.
Rats were housed individually, provided free access to food and water, and handled in accordance with regulatory compliance for animal care use.
Immunohistochemistry and Image Analysis
Using immunohistochemical methods, a polyclonal rabbit anti–human TSH antibody (Biodesign; Saco, ME) was used for detection of TSH in pituitary gland tissue. For detection of hyperplastic changes (i.e., cell proliferation), a mouse anti–human antibody against topoisomerase IIa (Abcam; Cambridge, MA) was used to detect nuclei in the S through M phases of the cell cycle. Immunohistochemistry was performed using a Ventana Discovery XT stainer (Ventana Medical Systems; Tucson, AZ), using a three-step biotinylated detection system as described previously (Zabka et al. 2011).
Sections of HE-stained liver and thyroid gland, TSH antibody-labeled pituitary gland, and topoisomerase-labeled thyroid gland were scanned using a Zeiss Mirax digital scanner (Carl Zeiss Microimaging; Thornwood NY) to obtain whole-slide images. For each organ, images from all the study rats were analyzed using the same automated algorithm written for the Definiens Enterprise image analysis system (Definiens; Parsippany, NJ). All algorithms were based on a multiresolution approach, similar to the evaluation of slides under the microscope, using different image magnifications to initially identify/segment regions of interest at low resolution (or low magnification) and then performing specific measurements at higher resolutions. Numerical results reported were average measurements made using two tissue sections per rat.
For HE-stained sections of liver, an algorithm for the quantification of cytoplasmic areas was developed as follows: images were automatically segmented using a brightness threshold to select hepatic parenchyma present in the tissue section, and hepatocellular area measurements corresponding to total parenchyma, nuclear, and cytoplasmic areas were collected. The hepatocellular cytoplasmic area was expressed as a percentage of the total hepatocellular area. Dunnett’s test was used to evaluate intergroup differences, and all treated groups were compared with the vehicle control group.
Digital slides of pituitary gland labeled with anti–TSH antibody were automatically segmented at low resolution to specifically select the pars distalis areas for TSH evaluation. Within the TSH-positive, DAB-stained areas, two separate regions of interest were identified due to the presence, within the same section, of two cell populations with distinct differences in intensity of their immunoreactivity for TSH. Based on measurements of pixel intensity from images within the control group, a threshold was set to enable separation of these two TSH-immmunoreactive cell populations: one population displayed strong chromogen intensity similar to TSH-immunoreactive cells in the control rats, which we designated “dark-staining cells,” and a second population displayed lighter chromogen intensity compared with TSH-immunoreactive cells in the control rats, which we designated “weak-staining cells.” TSH-immunoreactive areas were counted for each of the “total-staining” (e.g., “dark-staining” plus “weak-staining” areas), “dark-staining,” and “weak-staining” areas and expressed as a percentage of the total area in the pars distalis. One-way analysis of variance was used to evaluate intergroup differences, wherein all treated groups were compared with the vehicle group, and those with statistical significance (p<0.05) were analyzed by post hoc Tukey’s test.
HE-stained thyroid gland digital slides were automatically segmented to select glandular follicular regions present in the tissue section, and area measurements corresponding to colloid and follicular cytoplasm were collected. Measured areas of colloid and of cytoplasm of the follicular epithelial cells were expressed as a percentage of the total follicular region. Areas reported were average measurements made using two tissue sections per rat. For colloid and follicular cell area, Dunnett’s test was used to evaluate intergroup differences, wherein all treated groups were compared with the vehicle control group.
Topoisomerase II–stained sections of thyroid gland were analyzed using an algorithm that detected antibody-labeled nuclei within the thyroid follicular areas only. Area measurements for immunoreactive and follicular thyroid regions were obtained and expressed as topoisomerase-positive area fractions. Treated groups were compared with vehicle using the Wilcoxon rank-sum test.
For quantitative image analysis data obtained for all the tissues, trend analysis for dose-dependent effect was done using the Jonckheere-Terpstra test. For correlation of image analysis results with other non-histological parameters, correlation coefficients were calculated using linear regression of all available data points, except for correlations with microsomal enzyme mRNA levels, where correlation coefficients were best fitted to logistic regression.
Quantitative RT-PCR of Drug Metabolism Genes
Total cellular RNA was isolated from the cultured hepatocytes and frozen rat liver samples using the PerfectPure RNA 96 Cell Kit according to the manufacturer’s instructions (5 Prime; Gaithersburg, MD). The reverse transcription reaction product was used for quantitative RT-PCR, using gene-specific dual-labeled probes and forward and reverse primers for drug metabolism genes as described (Zabka et al. 2011). Data were normalized to the 18S rRNA content of each sample and graphed as fold induction relative to vehicle control rats. Changes in treatment groups relative to vehicle control groups were assessed using a two-sample (equal variance) two-sided Student’s t-test. Changes were considered significant at p<0.05.
Results
Quantification of Liver Hypertrophy and Correlation with Histology and Enzyme Induction
Routine microscopic evaluation of liver sections indicated mild hypertrophy of all treated rats regardless of dose group, with the exception of two low-dose male rats with minimal hypertrophy. Using automated segmentation of the liver cytoplasmic areas across the entire sections (Fig. 1A), hepatic cytoplasmic area fraction measurements correlated with histological interpretation at the group and, for the most part, at the individual level. Livers from the treated groups (groups 2–4) had increased cytoplasmic area fractions compared with the vehicle control group (group 1) rats, and there was no apparent sex bias. At the individual level, however, quantitative analysis also suggested that two rats in group 2 assigned mild histological scores were more similar to those assigned minimal histological scores (Fig. 1B). Refining the semi-quantitative histological interpretation, quantification demonstrated a statistically significant increase in all but the group 2 females and distinguished a dose-dependent response (Zabka et al. 2011).
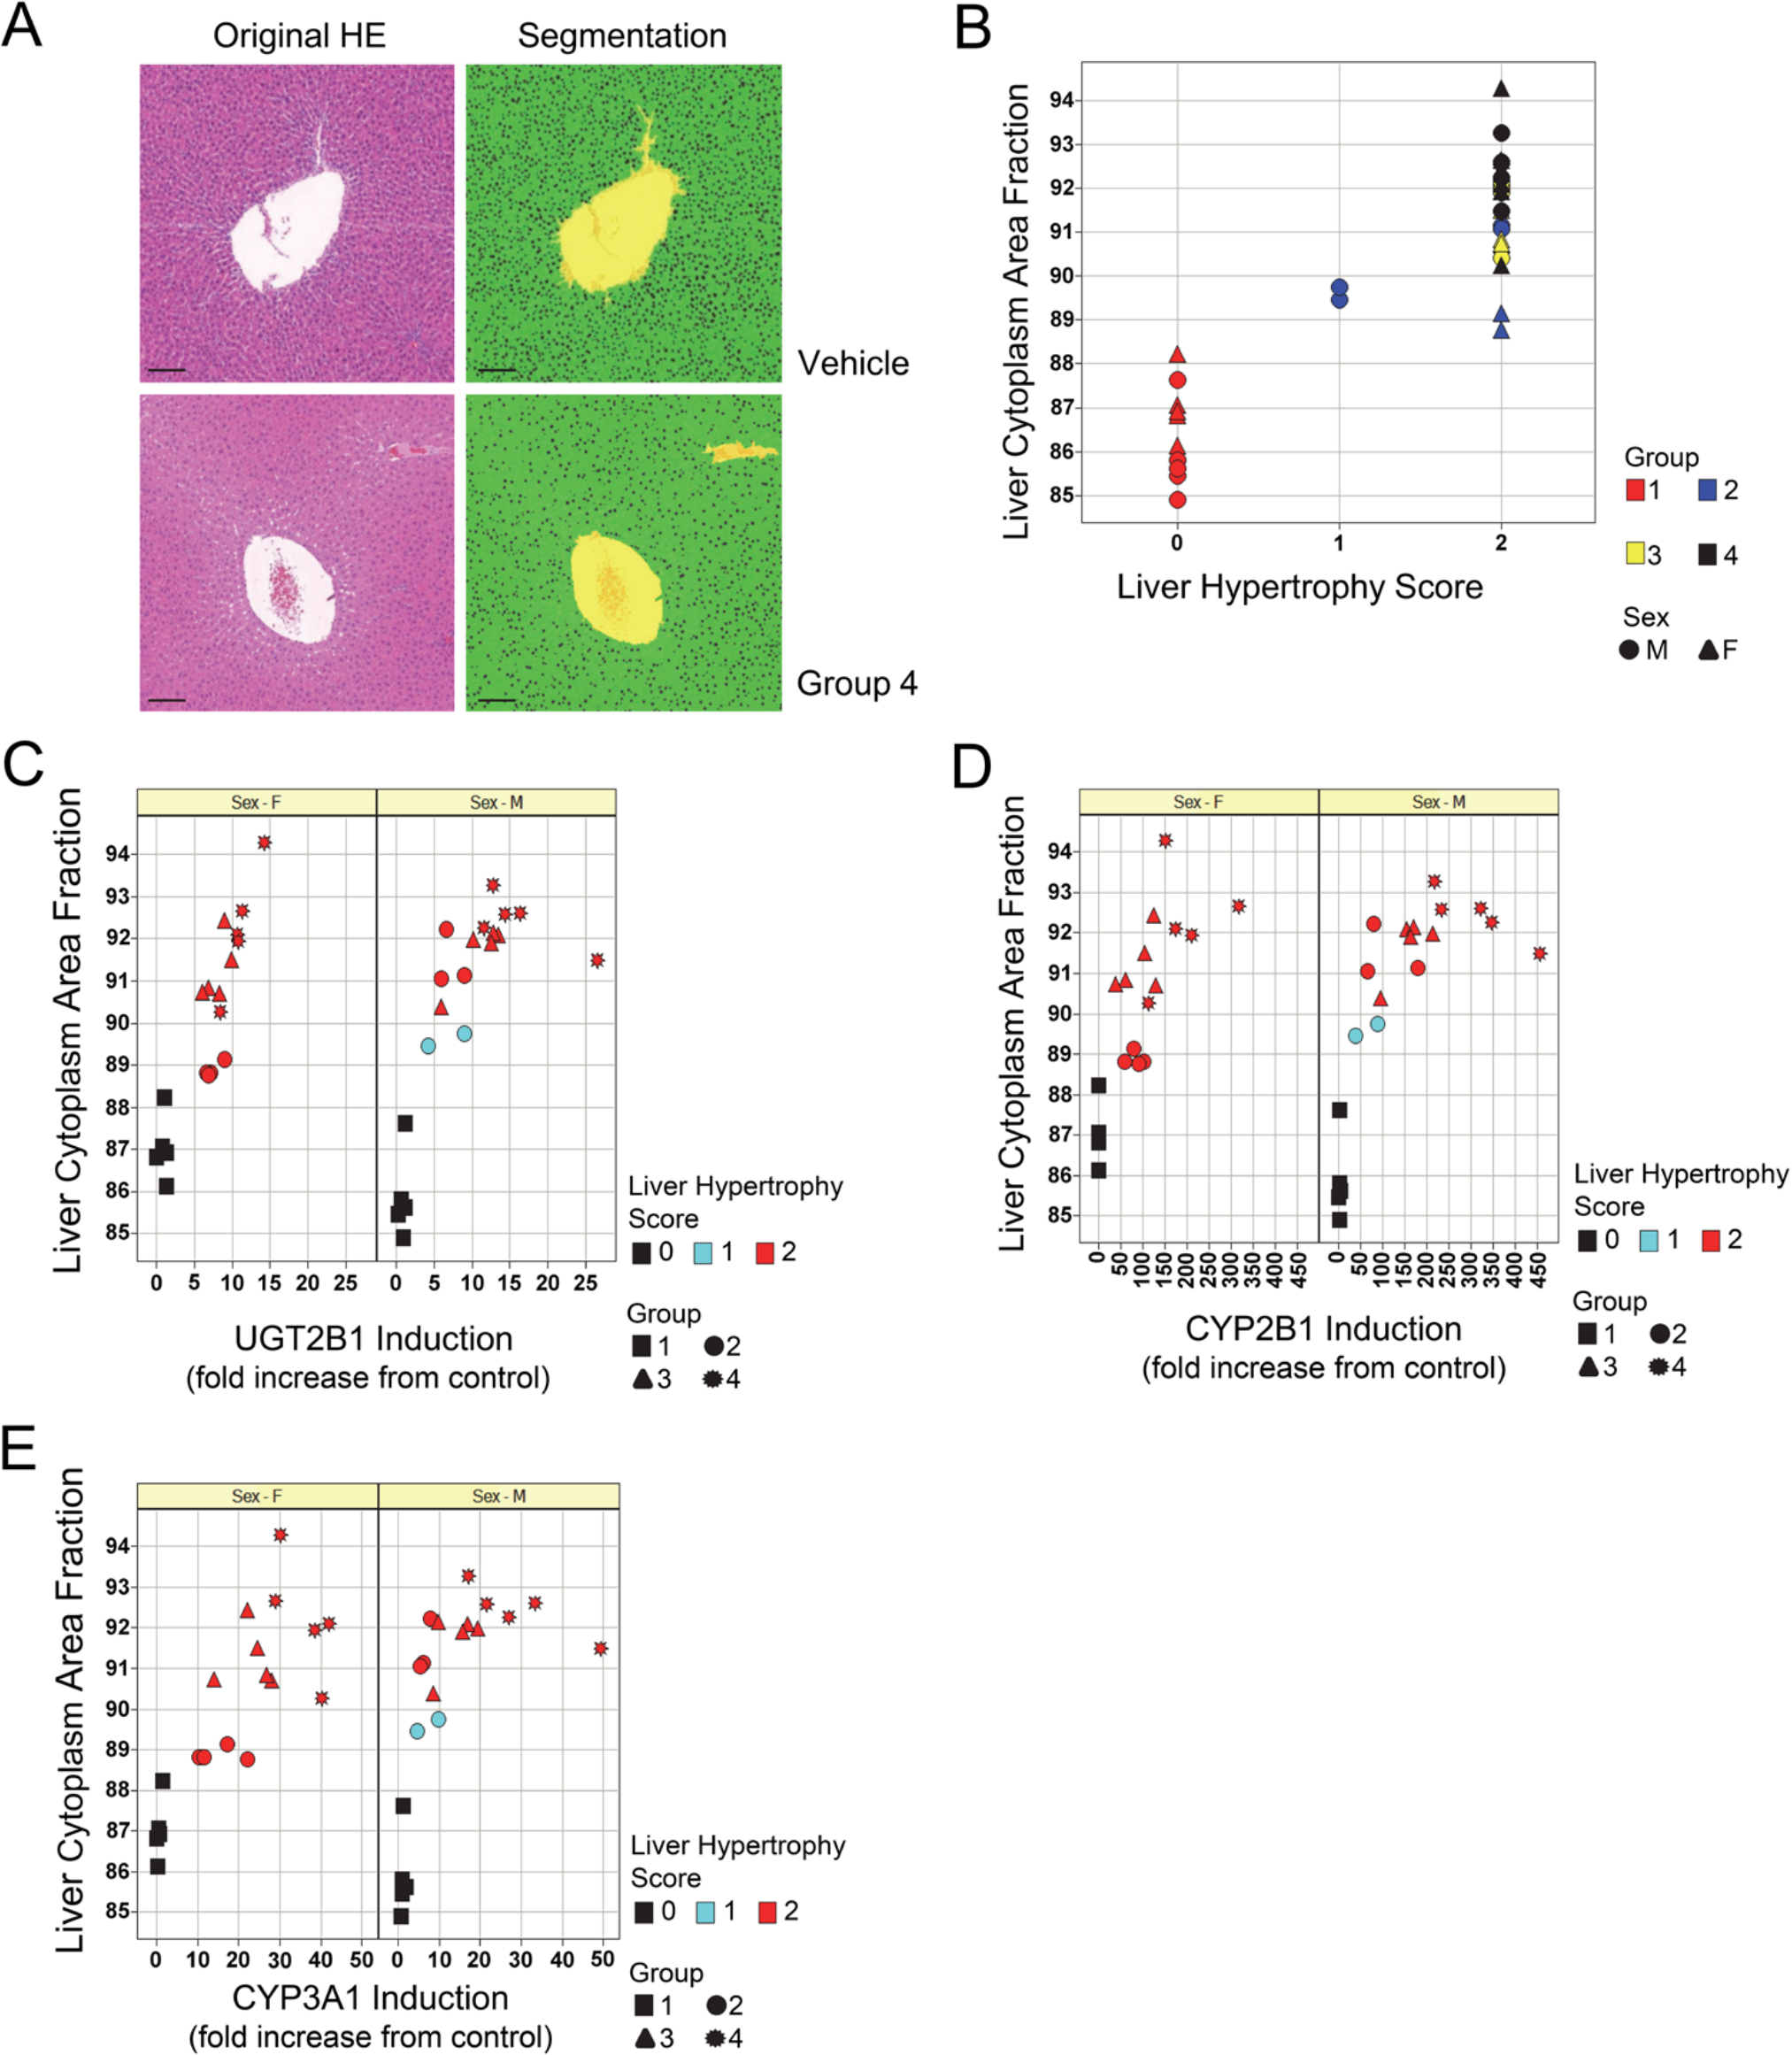
Digital slide quantification of liver hypertrophic changes correlates with histopathology and hepatic enzyme induction. (A) Representative micrographs of hepatic histology, showing treatment-related hypertrophy observed in the high-dose group and corresponding segmentation of liver cytoplasmic areas (right column, green areas) in hematoxylin and eosin (HE)–stained slides. Scale bar, 200 µm. Quantification of hepatic cytoplasmic area fraction had strong correlation with histopathology scoring of liver hematoxylin and eosin (HE)–stained sections at the individual rat level (B) and also with UGT2B1 (C), CYP2B1 (D), and CYP3A1 mRNA induction (E). Group 1, vehicle; group 2, 100 mg/kg/d; group 3, 300 mg/kg/d; group 4, 1000 mg/kg/d.
Image analysis results also correlated strongly at the group and individual levels with observed changes in gene expression of specific isoforms of cytochrome P450 (CYP) and UDP-glucuronyltransferase (UGT) enzymes, which had a dose-dependent response. More specifically, it correlated with changes in mRNA levels of UGT2B1 (Fig. 1C; correlation coefficient = 0.916 and 0.852 for males and females, respectively), CYP2B1 (Fig. 1D; correlation coefficient = 0.915 and 0.733 for males and females, respectively), and, to a slightly lesser extent, CYP3A1 (Fig. 1E; correlation coefficient = 0.899 and 0.744 for males and females, respectively). No significant correlation was established with CYP3A2, CYP1A1, or CYP1A2.
Quantification of Individual Cell Hypertrophy in Pituitary Gland and Correlation with Histology and TSH Serum Levels
By histological evaluation, individual cell hypertrophy in the pituitary gland pars distalis occurred in all male rats from all dose groups, with a slight dose response in severity from minimal to mild at the high dose. In addition, individual cell hypertrophy occurred at a similar minimal severity in some female rats from all dose groups. In HE-stained sections, hypertrophied cells were characterized by their enlarged cellular contour and lighter cytoplasmic eosin staining. Using immunohistochemistry (IHC), hypertrophied cells were identified as thyrotrophs by their distinct but less intense immunoreactivity for TSH, as compared with other, non-hypertrophied, “dark-staining” TSH-positive cells (Fig. 2A). Image analysis of the two separate thyrotroph populations was performed, and the quantification results for the hypertrophied, “weak-staining” cell population (as identified by IHC) was compared with the semi-quantitative scoring performed on the same tissues (Fig. 2B). Although a strong correlation (correlation coefficient = 0.784) was observed, in group 2, three females and two males had a minimal hypertrophy pathology score (score = 1), although quantification demonstrated an overlap with the highest sex-matched control, and one group 3 female was not identified with hypertrophy by pathology (score = 0), although quantification demonstrated a slight elevation above the highest control female. Pituitary glands with mild TSH changes (score = 2) were easily distinguished from all others based on their TSH-immunoreactive area percentages, and quantification suggested that one group 2 male was more similar to those with mild pathology scores in group 4. Accordingly, statistically significant increases were found in the weak TSH-positive population across all dose groups for males and only for the high-dose group (group 4) in females. Total (combined “weak” and “dark”) TSH-positive areas presented no correlation to the hypertrophy scoring (data not shown), which indicated the lack of increase in the total TSH-immunoreactive cell population in the pituitary par distalis. An absence of hyperplasia (i.e., cell proliferation) in the pituitary gland was further supported by the lack of an RO2910-related increase in topoisomerase II immunoreactivity and thus of mitotic activity, as reported previously (Zabka et al. 2011).
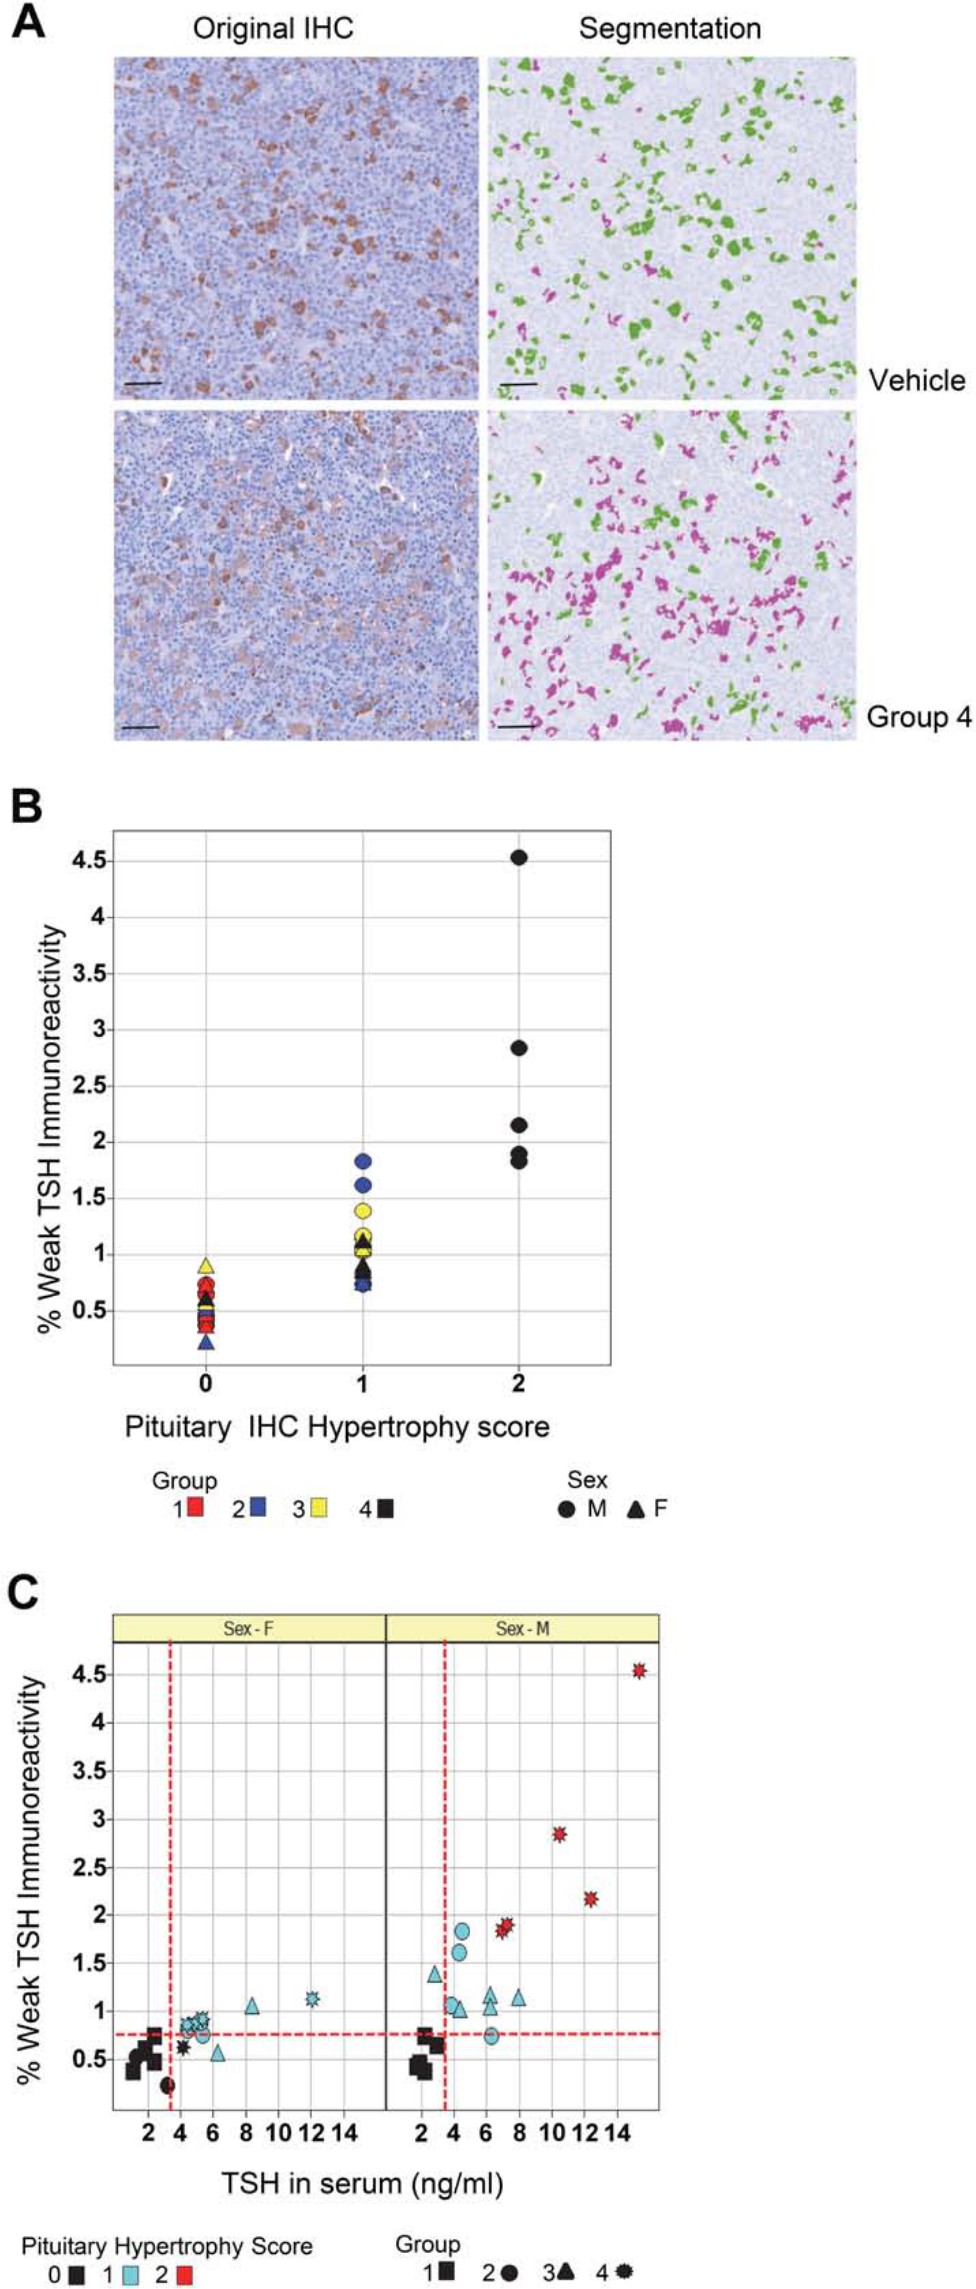
Quantification of a specific hypertrophied cell subpopulation in the pituitary correlates with histopathology scoring and serum thyroid-stimulating hormone (TSH) levels. Segmentation of distinct TSH-positive cell subpopulations in the pituitary was performed based on their different immunoreactivity levels (A), with one population showing average TSH labeling intensity similar to cells present in control rats (right, green pseudo-color), and a separate one displaying weaker immunoreactivity (right, magenta pseudo-coloring), present mainly in treated tissues. Scale bar, 30 µm. Weak TSH-immunoreactive area percentages correlated well with histopathology scoring (B). Although strong overall, individual rat correlation of hypertrophied areas was stronger among the male groups when compared with TSH serum levels, as some females showed elevated hormone levels with normal histology parameters and a lesser response overall (C). Red dotted lines representing cutoff values for normal serum TSH (vertical lines) and light TSH immunoreactivity areas (horizontal line) can segregate animals with different responses to treatment. Group 1, vehicle; group 2, 100 mg/kg/d; group 3, 300 mg/kg/d; group 4, 1000 mg/kg/d. IHC, immunohistochemistry.
The percentages of hypertrophied TSH-labeled areas also were compared with serum levels of TSH (Fig. 2C). This comparison demonstrated strong correlation between morphological quantification and serum hormone measurements (correlation coefficient = 0.751 and 0.679 for males and females, respectively). Only one male rat had a morphological quantification increased above controls but showed a serum TSH level within the normal reported range (0.57–3.41 ng/ml). Only two female rats had increased serum TSH levels but showed a morphological quantification similar to controls; however, one of these rats had a minimal pathology score.
Quantification of Thyroid Hypertrophy and Correlation with Histology
Diffuse thyroid follicular hypertrophy of mild severity occurred in rats from both sexes in all treated groups (groups 2–4) with a slight increased incidence for males compared with females and slight dose response in incidence for females. Reduced colloid content also occurred in some affected rats. Image analysis was performed to identify and measure areas of follicular cytoplasm and colloid in HE-stained histological sections of the thyroid gland (Fig. 3A).
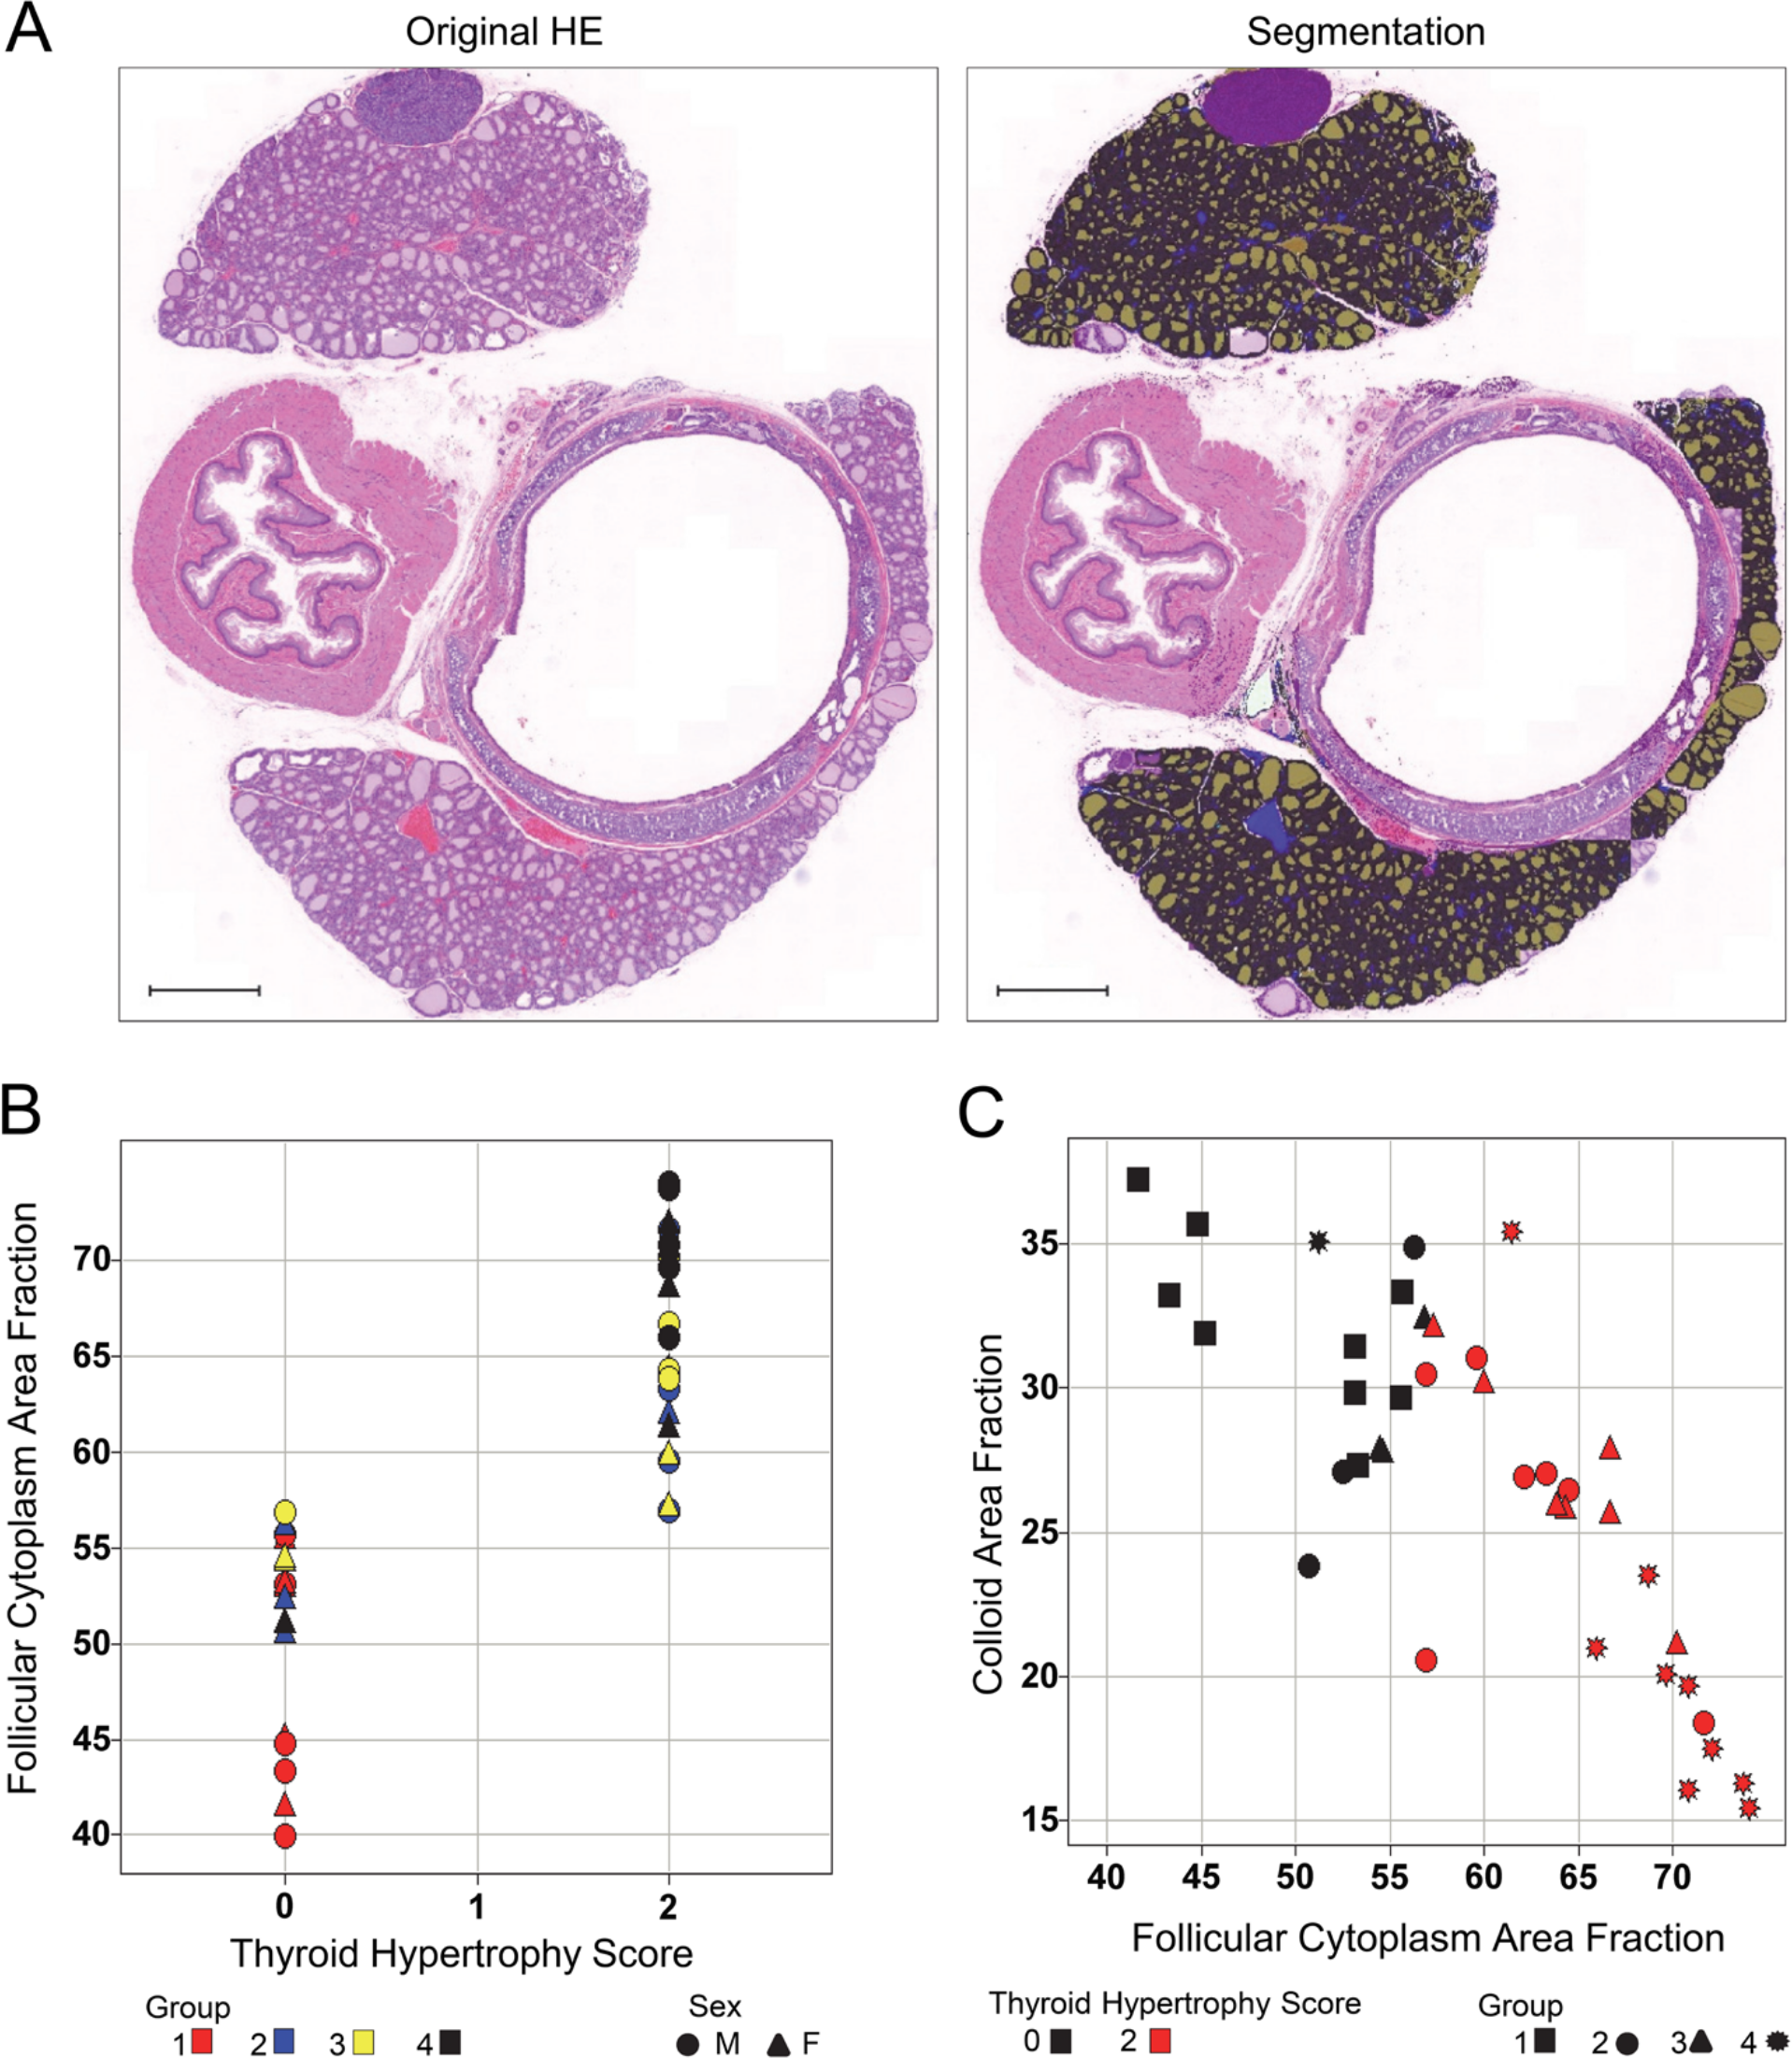
Digital slide quantification of thyroid hypertrophy and thyroid proliferation correlates with histopathology scoring. Custom-made algorithms (A) automatically segment colloid (right, brown pseudo-color) and follicular (right, black pseudo-color) areas within the thyroid gland in hematoxylin and eosin (HE)–stained slides. Histology scores were compared with normalized area measurements for follicular cytoplasm (B), showing strong correlation of data and clear differentiation of high-dose samples (group 4). Decreases in colloid content correlated with increased follicular area fractions (C). Group 1, vehicle; group 2, 100 mg/kg/d; group 3, 300 mg/kg/d; group 4, 1000 mg/kg/d.
Follicular cytoplasmic area fractions correlated with histological interpretation at a group and individual level, substantiating the greater effect in males than in females and the slight dose response in females (Fig. 3B). Based on follicular cytoplasmic area measurements, a clear segregation could be made between affected thyroid glands and those with normal histology. Refining the histological interpretation, quantification demonstrated a statistically significant increase in all male-treated groups and only in the high-dose female group compared with the sex-matched vehicle control groups; this also distinguished a dose-dependent response in males (p=0.0001) that was not evident by semi-quantitative histology (Zabka et al. 2011). Quantification also suggested that one group 3 male rat assigned a normal pathology score (score = 0) was more similar to those rats assigned a mild pathology score (score = 2).
Quantification of total colloid area in thyroid gland sections also was performed, and results were compared with the follicular area measurements (Fig. 3C). At the individual rat level, mainly high-dose rats (group 4) and a few individual rats from groups 2 and 3 had significantly lower total colloid area. The correlation coefficient of 0.645 demonstrated that, although there was some correlation, for most low- and mid-dose rats, follicular cell cytoplasmic areas increased above that of control rats without a decrease in colloid area below that of control rats. Even though T4 serum measurements decreased with treatment, there was no clear correlation between T3/T4 serum levels and any of the morphometric measurements in the thyroid gland at the individual rat level (data not shown).
To further characterize the hypertrophic response in the thyroid, we quantified mitotic activity by analyzing immunolabeling of the thyroid gland with an anti–topoisomerase II antibody. For this analysis, we created an algorithm to automatically identify and measure topoisomerase II–positive areas within the thyroid follicular region (Fig. 4A). Again refining the histological interpretation, the numerical quantification of topoisomerase II distinguished a statistically significant group effect in high-dose males and a greater individual effect on males than on females and on those from group 3 compared with group 2 (Fig. 4B). Quantification also suggested that one group 3 male rat assigned a minimal pathology score (score = 1) was more similar to those assigned a mild pathology score (score = 2).
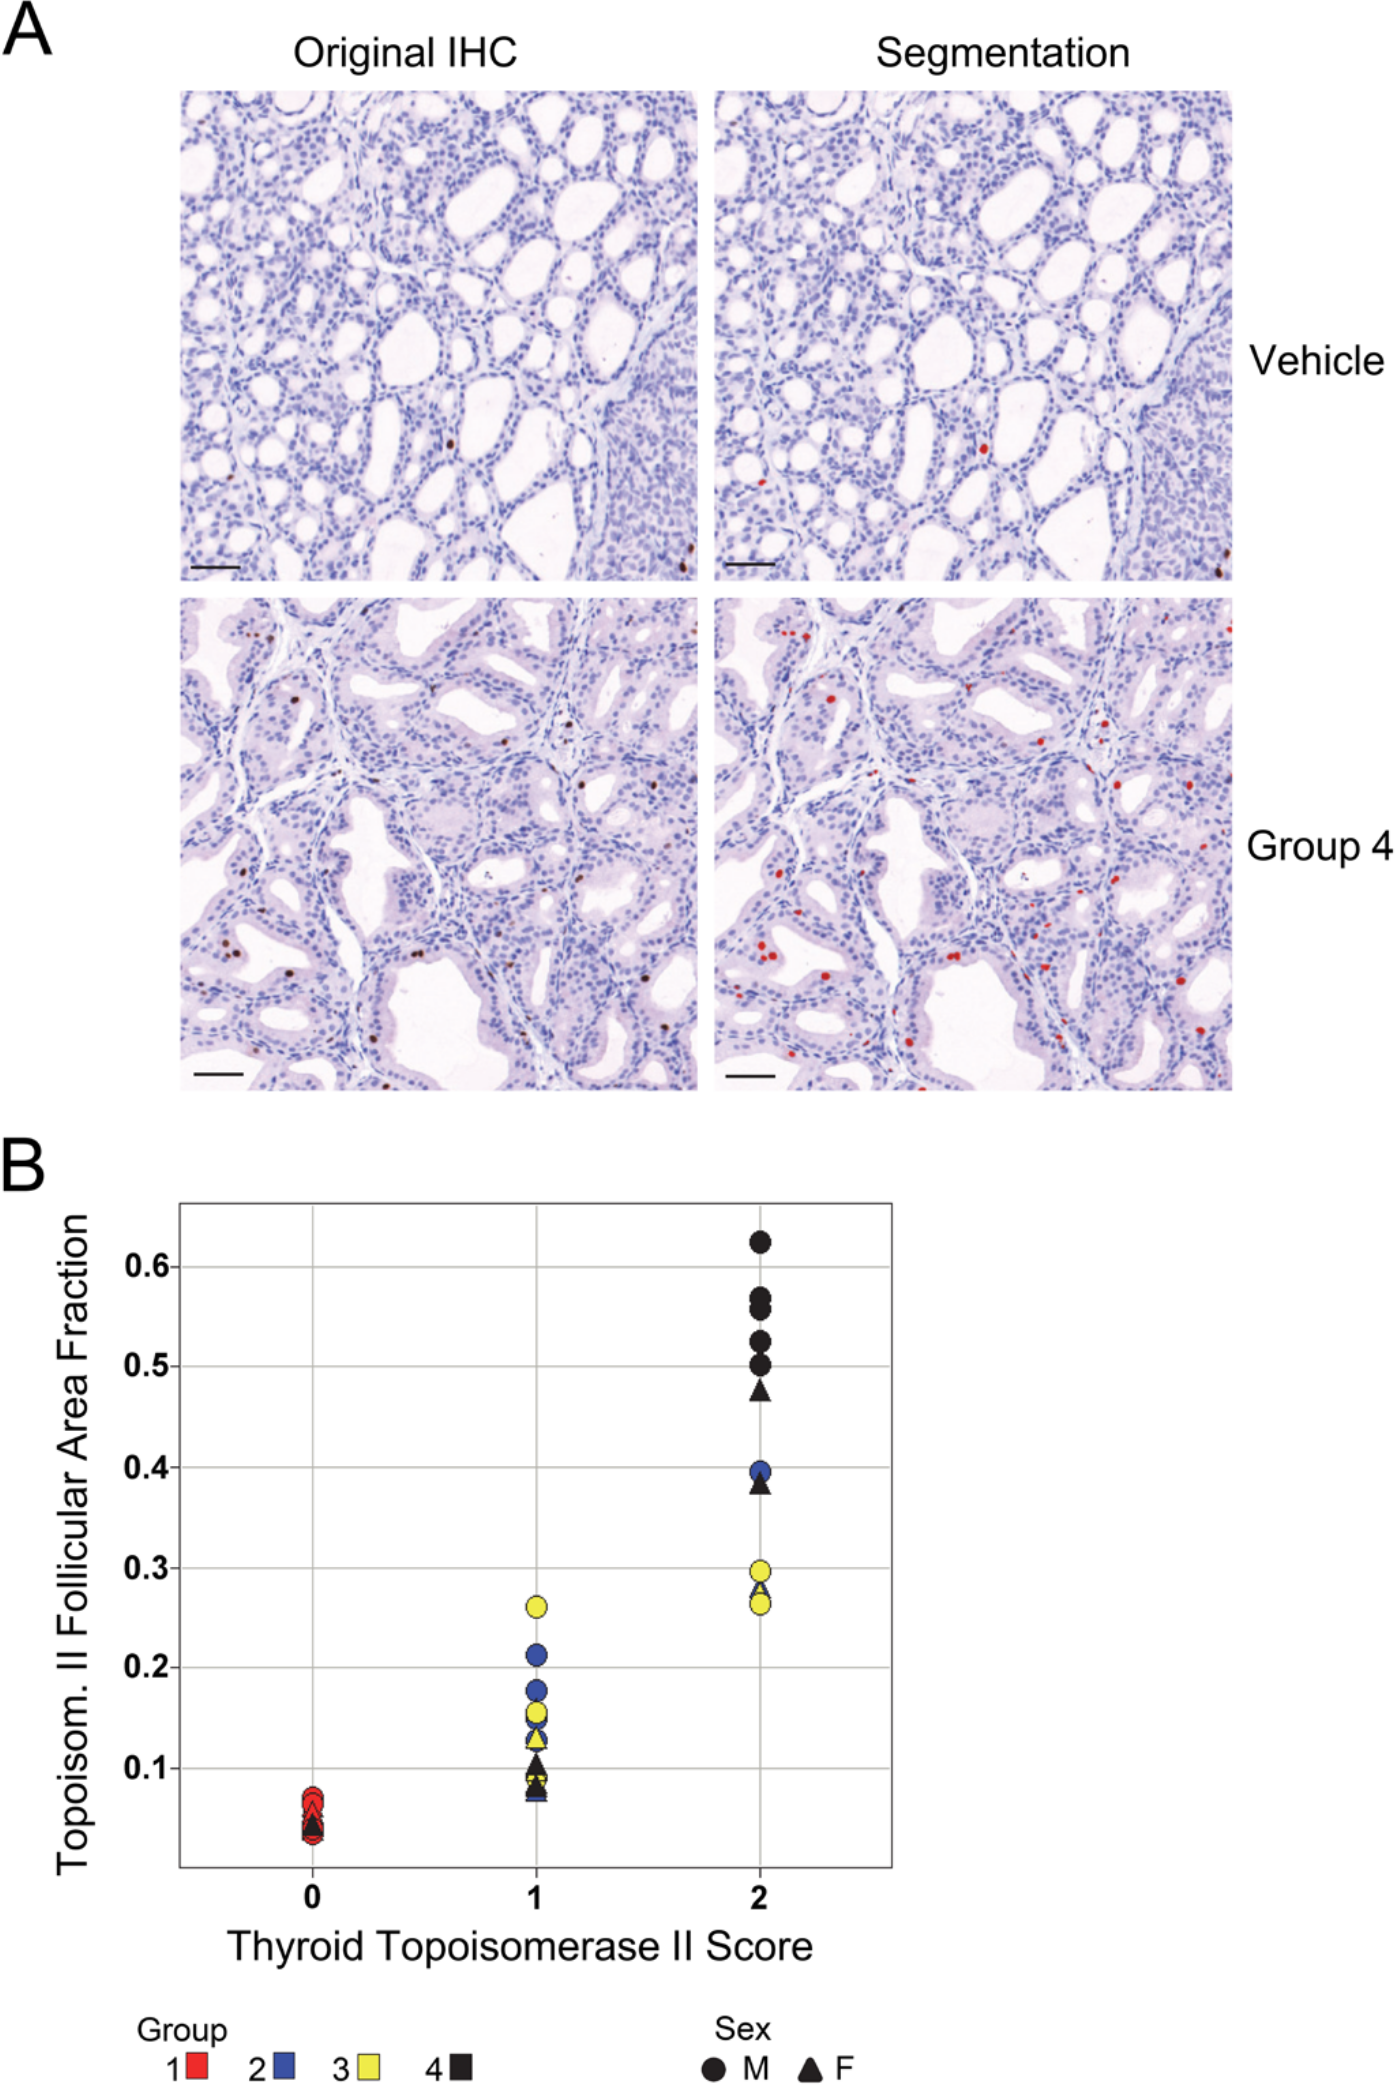
Quantification of topoisomerase II–positive nuclei in cells of the thyroid gland (A, representative segmentation results; B, individual animal correlation) revealed dose-dependent proliferation and was in agreement with the histopathology scores. For (A) DAB (brown) was used for detection of topoisomerase II, and hematoxylin was used as the counterstain. Scale bar, 50 µm. Group 1, vehicle; group 2, 100 mg/kg/d; group 3, 300 mg/kg/d; group 4, 1000 mg/kg/d. IHC, immunohistochemistry.
Discussion
In the present study, the administration of RO2910 in rats was associated with hepatic microsomal induction and subsequent histopathology findings in multiple tissues. The pathogenesis of these findings is a well-understood adaptive mechanism initiated by hepatic microsomal enzyme induction and subsequent increased clearance of thyroid hormones (Zabka et al. 2011). Disruption of thyroid hormone levels in serum activates the hypothalamus-pituitary-thyroid axis, resulting in thyroid-releasing hormone (TRH) secretion from the hypothalamus. TRH acts on the anterior pituitary gland and stimulates TSH secretion, which is followed by increased synthesis and release of T3 and T4 from the thyroid glands.
The use of tissue-based techniques for toxicity and disease evaluation, especially IHC, remains of critical importance because of its capability to provide cellular and morphological context to other assay results, such as the circulating hormone and genomics results in this study. In addition, the introduction of digital slide scanning technologies has enabled the application of whole-slide image analysis and automated image quantification, which can perform analysis of slides in a high-throughput, consistent fashion. These methodologies also can reduce interobserver variability and facilitate quantification of challenging visual evaluations and thus help refine routine histological evaluation. Using digital slide scanning and automated whole-slide image analysis, we were able to validate, against the semi-quantitative histology scoring and relevant quantitative clinical pathology and molecular end points, the use of custom-made analysis algorithms that can be applied routinely to quantify a hypertrophic to hyperplastic process in multiple tissues—namely, liver, pituitary gland, and thyroid gland. In this study, the occurrence of a well-characterized adaptive physiological process was valuable to the application of automated digital analysis methods, as robust knowledge of the occurring pathology is necessary for accurate automation of routine histological and immunohistochemical end points. By using these developed solutions, we were able to rapidly and automatically assess the observed changes, thereby reducing human workload and eliminating potential inter- and intraobserver bias. Across all measurements performed within this study, a high degree of correlation with the anatomic pathology, clinical pathology, and molecular evaluation was consistently present and provided validation for application of the developed analysis paradigms. In addition, once established, these image analysis solutions can be readily available, to be applied in subsequent studies in which similar histological alterations are suspected.
In addition to providing statistical power, the use of image analysis to achieve numerical results in histology and immunohistochemistry enables easy comparison and extraction of data differences between dose groups and/or sexes, as there are known differences in drug metabolism between sexes (Mugford and Kedderis 1998). In this study, once numerical values were obtained, a dose-response or sex bias often was observed that was not demonstrated by semi-quantitative scoring and could be evaluated by straightforward statistical approaches. Thus, we were able to establish statistically significant group and sex differences and refine dose-dependent and/or sex bias responses, as well as improve understanding at an individual rat level. The availability of results in a continuous numerical scale (as opposed to separated severity categories, or grades) also enabled direct comparisons between morphometric data and other relevant quantitative clinical pathology and molecular parameters analyzed during the course of the study as published previously (Zabka et al. 2011). When appropriately applied and validated, such as in this study, image analysis provides a clear advantage versus the semi-quantitative slide evaluation, as it not only confirms and potentially refines the histopathology interpretation but also enables correlation with other non-histological quantitative parameters, which is critical for diagnosis and characterization of relevant disease biomarkers.
Similar to previously published results (Amacher et al. 1998), the increase in liver enzyme induction levels observed at higher doses did not correlate with a sustained rise in hypertrophy scores or hepatic cytoplasmic area fractions. Despite the plateau in morphological tissue changes, a strong correlation was established with mRNA enzyme induction. By applying image analysis methods, we were able to establish strong correlation coefficients (R2 > 0.7) between hepatic CYP2B1, CYP3A1, and UGT2B1 enzyme mRNA induction and cytoplasmic area fractions. These correlations improved when separated by sex, evidencing a male bias response that manifested throughout the study end points and is anticipated for this mechanism. In addition, a dose-dependent response was established for the morphological findings, which was not apparent by the semi-quantitative pathology scoring system.
A clear benefit of image analysis is its ability to perform straightforward consistent digital assessment of differences in cell staining intensity. This feature is of particular importance when trying to segregate cell populations of moderate to weak intensity or diffusely scattered regions of interest, tasks that are challenging to the human eye. In the pituitary gland, we were able to apply a numerical threshold across the entire study easily and objectively for segregation and quantification of a hypertrophied population of thyrotrophs that had distinctive immunolabeling intensity. This process, although challenging to perform manually in a consistent manner, was readily accomplished through intensity thresholding during digital analysis. In addition, we could establish a strong correlation between the area percentages of the hypertrophied thyrotrophs (with weaker TSH immunoreactivity) and circulating TSH levels, and this correlation was stronger in males compared with females.
Development of an appropriate image analysis solution for HE-stained digital slides of the thyroid gland was a considerable technical challenge due to lack of high-contrast components within the image layers. Once the algorithm was established, quantification of histological changes demonstrated a statistically significant dose-response effect. We refined our understanding of the correlation between hypertrophied follicular cells and decreased colloid content, for which the latter precedes the former, as is consistent with upregulation of follicular cell hormone production and subsequent use of the colloid reserve. Similarly, quantification of mitotic activity demonstrated a dose-response effect, indicating that follicular cell hypertrophy is eventually followed by hyperplasia that is statistically relevant in the most-affected rats (high-dose male group). Last, follicular cell and colloid changes did not have a strong correlation with circulating T4 and T3 hormone levels, which may be consistent with the dynamic levels of these hormones in circulation.
The development of image analysis solutions to characterize unique findings in histopathology can be a challenging task. Time investment in designing these algorithms needs to be considered against the utility of very specific image analysis solutions that could have a large impact on or little use in the completion of the original research. In other instances, establishment of relatively straightforward image analysis solutions for fairly common findings, such as increased nuclear proliferation, could be a potential valuable tool, requiring modest development times, while amenable to use for rapid, consistent assessment in multiple studies. Even though the solutions presented here were developed specifically for the preclinical assessment of RO2910, once established, we were able to successfully apply the same algorithms to other studies where hepatocellular hypertrophy was identified or suspected.
It is worth mentioning that the use of automated equipment and well-established procedures for histology and immunohistochemistry methods are a requirement when trying to automate digital slide quantification. The importance of using high-quality material and robust methodology for attempting image analysis of slides is critical to obtaining accurate results.
We conclude that automated image analysis of digital slides is a useful tool in histological and immunohistochemical evaluation, where it can provide numerical end points that allow for a consistent and more refined evaluation of otherwise semi-quantitative end points and comparison to other quantitative end points, such as clinical pathology and molecular analysis. This refinement includes improving the characterization of specific cell populations of interest and providing statistical distinctions for treatment-related effects.
Footnotes
Declaration of Conflicting Interests
The author(s) declared no potential conflicts of interest with respect to the research, authorship, and/or publication of this article.
Funding
The author(s) disclosed receipt of the following financial support for the research, authorship, and/or publication of this article: The authors received employment-related financial support from Roche Pharmaceuticals at the time the findings occurred. Such financial support was not specifically intended for this research or publication.