
Abstract
Although the kidney generally has been regarded as an excellent source of carboxypeptidase M (CPM), little is known about its renal-specific expression level and distribution. This study provides a detailed localization of CPM in healthy and diseased human kidneys. The results indicate a broad distribution of CPM along the renal tubular structures in the healthy kidney. CPM was identified at the parietal epithelium beneath the Bowman’s basement membrane and in glomerular mesangial cells. Capillaries, podocytes, and most interstitial cells were CPM negative. Tumor cells of renal cell carcinoma subtypes lose CPM expression upon dedifferentiation. Tissue microarray analysis demonstrated a correlation between low CPM expression and tumor cell type. CPM staining was intense on phagocytotic tumor-associated macrophages. Immunoreactive CPM was also detected in the tumor-associated vasculature. The absence of CPM in normal renal blood vessels points toward a role for CPM in angiogenesis. Coexistence of CPM and the epidermal growth factor receptor (EGFR) was detected in papillary renal cell carcinoma. However, the different subcellular localization of CPM and EGFR argues against an interaction between these h proteins. The description of the distribution of CPM in human kidney forms the foundation for further study of the (patho)physiological activities of CPM in the kidney.
Keywords
In 1984, a carboxypeptidase N (CPN)–like enzyme was identified in membrane fractions of the human kidney (Skidgel, Johnson, and Erdos 1984). This new member of the B-type carboxypeptidases was named carboxypeptidase M (CPM) because of its unique membrane-bound feature (Skidgel et al. 1989). A human urinary basic carboxypeptidase (different from CPA, pancreatic CPB, or CPN) purified earlier that year was identified later as the soluble form of CPM (Skidgel, Davis, and Erdos 1984; McGwire and Skidgel 1995). Soluble CPM most likely is responsible for the basic carboxypeptidase activity reported for human urine from healthy individuals and renal disease patients (Hamai et al. 1990). Besides the placenta and the lung, the kidney is considered an important source of CPM. Although strong evidence exists for the expression of the peptidase in the human kidney, mapping of CPM along renal structures and renal-specific cell types has never been performed. Although some basic carboxypeptidases (particularly CPU) have been associated with renopathological conditions, this has not been investigated for CPM so far. Nevertheless, one case report described CPM-positive granuloma cells in a patient with renal cell carcinoma (RCC) and an atypical sarcoid-like reaction (Kovacs et al. 2004).
RCC represents the most important type of adult renal epithelial neoplasm, accounting for 90% of all renal malignancies. This clinicopathologically heterogeneous disease shows significant lethality (Jemal et al. 2009; Ferlay et al. 2010). Clear cell carcinoma is the most frequently occurring form of RCC, accounting for 70% of the cases. A less favorable prognosis has been observed for clear cell RCC compared with papillary RCC and chromophobe RCC, which have prevalences of 10% to 15% and 4% to 6%, respectively (Cheville et al. 2003; Eble et al. 2004). Various molecular markers have been investigated for the prognosis of RCC, among which are epidermal growth factor receptor (EGFR), carbonic anhydrase IX, vascular endothelial growth factor (VEGF), hypoxia inducible factor, Ki67, p53, phosphatase and tensin homologue (PTEN), E-cadherin, and CD44. However, no specific molecular prognostic marker has been recommended for routine clinical use as yet (Ljungberg et al. 2010).
EGFR is expressed in 50% to 90% of RCCs. A trend toward a shortened survival was seen in EGFR+ clear cell RCC (Moch et al. 1997). Upregulation of EGFR was linked to high tumor grade and advanced pathological tumor classification (Yoshida et al. 1994; Ciardiello and Tortora 2008; Minner et al. 2012). However, the association of EGFR overexpression with poor prognosis in clear cell RCC is not always clear (Cohen et al. 2007). EGFR overexpression was related to an aggressive clinical course in many cancers possibly by inducing rapid tumor cell proliferation (Toi et al. 1990; Sauter et al. 1994; Moch et al. 1997; Goel et al. 2007; Sibilia et al. 2007). Constitutive/chronic EGFR activation is thought to contribute to dedifferentiation, uncontrolled cell division, inhibition of apoptosis, metastasis, and, as a consequence, the evolution of RCC (Weber et al. 2007; Zeng et al. 2009). Interestingly, 80% of CPM+ lung adenocarcinomas were found to coexpress EGFR. Moreover, CPM-EGFR double positivity correlated with a worse clinical outcome, whereas the opposite was true for CPM-EGFR double- negative tumors. CPM, which is capable of processing epidermal growth factor (EGF) at its C-terminus, could thus influence tumor biology in EGFR+ tumors (Tsakiris et al. 2008). CPM is considered to be a major metabolizer of EGF in urine. Formation of EGF des-Arginine (Arg)53 by CPM was observed in Madin-Darby canine kidney (MDCK) cell monolayers. Removal of the C-terminal Arg did not affect the mitogenic property of EGF, EGFR activation, or signal transduction (McGwire and Skidgel 1995).
The biological role of CPM may be deduced from its natural substrates, cell- and tissue-specific expression in the human body, and disease-related expression. This study sought to identify the type of renal cells that express CPM as well as its distribution within the various kidney structures. In addition, a pilot study was set up to investigate the expression of the CPM protein in RCC specimens. CPM and EGFR expression, as well as CPM/EGFR coexpression in normal kidney, RCC, and other renopathological conditions, was analyzed by multiplex histological analysis of eight separate samples and by single immunohistochemistry staining of a tissue microarray (TMA).
Materials and Methods
Immunohistochemical Staining of Normal and RCC-Diseased Human Kidney Tissue
Approval from the University of Antwerp institutional ethics committee was obtained for the use of human material in all staining experiments. Human kidney tissue was obtained from nephrectomies performed upon oncological indication (n=12). Anonymized tissue samples were obtained from the Laboratory of Pathology (Middelheimziekenhuis, Antwerp, Belgium). Tissue specimens of RCC patients (n=8) were placed in 4% neutral buffered formalin within 5 min after removal from the patient. The total fixation time was 6 hr minimum and did not exceed 48 hr. Subsequently, samples were processed into paraffin. Tissue slices of 5 µm thickness were cut. Initial immunohistochemical stainings (n=4) were performed manually (cf. Supplemental Materials). All other stainings were performed using the following automated staining protocol. Immunohistochemical staining was performed using the Ventana BenchMark XT platform (Roche; Basel, Switzerland): Slides were dewaxed using EZ Prep; for CPM detection, epitope retrieval using cell conditioning buffer (CC1) was performed, whereas EGFR detection required proteolytic pretreatment with Protease 1. Sections were incubated for 32 min with rabbit anti-human CPM polyclonal antibodies (1:40; Sigma-Aldrich, St. Louis, MO) or mouse anti-human EGFR monoclonal antibodies (CONFIRM EGFR, clone 3C6, 1:40; Ventana Medical Systems, Roche). Signals were amplified and detected using the ultraview Universal DAB detection kit (Ventana Medical Systems, Roche). Sections were counterstained for 4 min using hematoxylin II. Bluing reagent was applied post counterstain, after which slides were coverslipped. Antibodies were diluted in antibody diluent. Washes were performed using reaction buffer. All reagents were from Ventana Medical Systems (Roche) except for the primary anti-CPM antibodies. As a negative control for CPM and EGFR antibodies, rabbit (DAKO; Glostrup, Denmark) or mouse (Ventana Medical Systems, Roche) immunoglobulins were used instead of the primary antibodies. Sections were analyzed using the Axiplan 2 Imaging microscope (motorized stage, Axiocam camera) from Zeiss (Wetzlar, Germany).
Double Labeling Immunofluorescence Experiments
Double labeling immunofluorescence stainings of RCC tissue samples (and the normal-appearing tumor-adjacent tissue that was present) (n=8) were performed on the DISCOVERY XT automated stainer from Ventana (Roche). After dewaxing, the tissue sections were incubated with a mix of primary antibodies to be subsequently visualized by Cy3-conjugated goat anti-rabbit and Alexa Fluor 488- conjugated goat anti-mouse or donkey anti-sheep antibodies (Jackson Immunoresearch Laboratories, West Grove, PA, and Invitrogen, Carlsbad, CA, respectively) and counterstained using Hoechst 33342 (Molecular Probes, Invitrogen). To enhance penetration of immunoreagents, tissue was permeabilized using 0.1% Triton X-100 (Perbio Science, Aalst, Belgium). The following primary antibodies were used: rabbit anti-human CPM polyclonal antibodies (1:150; Sigma-Aldrich), mouse anti-human CD31 monoclonal antibodies (clone 1A10, 1:40; Ventana Medical Systems, Roche), sheep anti-human nephrin polyclonal antibodies (1:25; R&D Systems, Minneapolis, MN), mouse anti-human vimentin monoclonal antibodies (CONFIRM, clone V9, 1:40; Ventana Medical Systems, Roche), mouse anti-human CD68 monoclonal antibodies (CONFIRM, clone KP-1, 1:40; Ventana Medical Systems, Roche), and mouse anti-human podoplanin monoclonal antibodies (clone D2-40, 1:200; DAKO). Primary antibodies were diluted in HGX diluent (HistoGeneX; Berchem, Belgium) or DAKO REAL diluent (DAKO), whereas secondary antibodies were diluted in DISCOVERY Antibody Diluent (Ventana Medical Systems, Roche). As a negative control for the primary antibodies, rabbit (DAKO), mouse (Ventana Medical Systems, Roche), or sheep (DAKO) immunoglobulins were used instead of the primary antibodies. Vimentin was used as a molecular biomarker for RCC. The RCC type was determined by histopathological evaluation of hematoxylin phloxine saffron-stained paraffin tissue sections. The vimentin load, macrophage load, and vascular load (low, moderate, or high) were assessed by histopathological evaluation of tissue sections stained immunofluorescently for vimentin, CD68, and CD31, respectively. Co-localization of CPM with CD31, vimentin, or CD68 was scored as follows: − to (+), no to very weak; +, weak; ++, strong; and +++, very strong co-localization. Sections were analyzed using the Axiplan 2 Imaging microscope.
Tissue Microarray Analysis
The expression of CPM and EGFR in various renal tumors, diseases, and (tumor-adjacent) healthy kidney tissue was determined using immunohistochemistry and the TMA technique. The formalin-fixed paraffin-embedded TMA LS-SKICA31 was purchased from Lifespan Biosciences (Seattle, WA). The TMA included cores (diameter 1 mm, thickness 5 µm) of 104 cases, the characteristics of which are presented in Table 1. Tumors were morphologically characterized based on the World Health Organization classification of tumors (Eble et al. 2004). All tumor specimens were graded by MD pathologists based on cellular differentiation and assigned grading scores as follows: GX, grade could not be assessed (undetermined grade); G1, well differentiated (low grade); G2, moderately differentiated (intermediate grade); G3, poorly differentiated (high grade); G4, undifferentiated (high grade) (Lifespan Biosciences). Immunohistochemical detection of CPM and EGFR was carried out using the same protocol as described above, except for the incubation time with primary antibodies, which was 2 hr. Whole slide images of the TMA slides stained for CPM and EGFR were made with a MIRAX automatic slide scanner (Zeiss; Oberkochen, Germany). The MIRAX images were viewed and annotated with the Panoramic MIRAX viewer (Zeiss). The analysis of the CPM and EGFR stainings was done with the high-end object-based image analysis program Tissue Studio 2.0 (Definiens; München, Germany). After automatic detection and matching of the tissue cores, segmentation of the cores was performed in basic units based on shape, morphology, and color information of the images. The correctness of the automatic selection of the regions of interest was verified on each set of images and manually adapted if necessary. Epithelial tissue, tumor, and interstitial tissue were identified in the segments (cytoplasm/membrane composer solution). Cellular analysis included nuclei detection, detection of staining in epithelial or tumor cells and at their cell membranes, and cell classification. Color-coded classes were created to classify negative, weak, moderate, or strongly stained cells. Exclusion criteria were chosen to remove small nuclei or interstitial cells from the analysis. Results are reported as the mean immunohistochemical marker intensity of the cells (mean immunohistochemistry [IHC] intensity), the % of marker-stained cells (tumor or epithelium), the histological score (H-score), and the global score. For CPM, a mean % of stained tumor or epithelial cells was determined that was equivalent to the H-score. EGFR staining was almost exclusively present on tumor cell membranes and varied in intensity. The % of cells with negative, low, medium, or high EGFR staining was determined for each core. Based on these results, the H-score of the cells within a core was calculated. Based on the H-scores, four classes were distinguished: negativity (H-score <50), weak positivity (50 < H-score < 100), moderate positivity (100 < H-score < 200), and strong positivity (200 < H-score < 300) for the investigated marker. A global score for the CPM or EGFR staining was attributed to each core as follows: H-score < 50 = global score of 0, 50 < H-score < 100 = global score of 1, 100 < H-score < 200 = global score of 2, and 200 < H-score < 300 = global score of 3. The data obtained from the TMA analyses were merged with the histopathological information provided by Lifespan Biosciences. MedCalc for Windows, version 11.2.1.0 (MedCalc Software; Mariakerke, Belgium), was used to make frequency distribution histograms of the H-score of the EGFR stainings in the various tumor entities. To compare the CPM or EGFR expression between specific diagnosis groups, statistical analysis (Mann-Whitney U test) was performed using the mean H-score of duplo cores. We made use of the new diagnoses groups described in Table 2, except for the normal and adjacent normal groups, which were kept separate. Collecting duct carcinoma, undifferentiated carcinoma, hyperplasia, pyelonephritis, and interstitial nephritis samples were not included in the statistical analysis because there were insufficient cores present on the TMA.
Characteristics of the Patient Population of Tissue Microarray LS-SKICA31 (Lifespan Biosciences; Seattle, WA)
Recoding of Diagnoses of the Tissue Microarray Cores for Cluster Analysis
Statistical Analysis
Statistical analyses were carried out using the statistical software package SPSS 16.0 (SPSS, Inc., an IBM Company, Chicago, IL). Differences were considered significant at p<0.05. The applied statistical tests are reported in the Results section. Clustering was performed using the partitioning around medoids method, implemented in the package “cluster” from the statistical package R, version 2.13 (Gentleman and Ihaka 2002). Cluster analysis was performed using the H-scores obtained for the CPM and EGFR staining in each core. Only individuals with full data were included. Measurements were standardized before calculating the dissimilarities. The number of clusters was set to four. To study the distribution of the different diagnoses across the four clusters, we recoded the diagnoses as indicated in Table 2.
Results
Carboxypeptidase M is abundantly expressed in human healthy kidney
The localization of CPM in human healthy kidney is presented in Figs. 1 to 3. In renal corpuscles (Fig. 1A, cortex), CPM positivity was observed at the parietal epithelium underneath the Bowman’s basement membrane. Intraglomerular CPM positivity was detected. CPM staining was observed in the cytoplasm of tubular epithelial cells (TECs). The apical pole of proximal TECs (brush borders) showed a pronounced CPM expression. There was no difference in CPM staining intensity between S1, S2, and S3 proximal tubuli (determined with CPM/PAS staining). A marked expression of CPM, at the apical surface in particular, was detected in distal convoluted tubuli and collecting ducts (identified using epithelial membrane antigen [EMA]; cf. Supplemental Materials, manual staining protocol). In some proximal and distal tubuli, luminal staining was observed, which likely corresponds to shedded CPM. CPM expression was even more abundant in the renal medulla (Fig. 1B, medulla). Strong CPM positivity was seen in the thick ascending limbs of the loop of Henle and the collecting ducts (identified by their morphology and strong apical EMA positivity). CPM positivity was particularly intense at the apical surface of the thick ascending limbs of the loop of Henle. Cytoplasmic (diffuse), basolateral, and luminal staining (shedded CPM) was also observed. The thin ascending and descending limbs of the loop of Henle showed a moderate to weak CPM expression. In both the renal cortex and medulla, peritubular capillaries and interstitial cells did not express the CPM protein. No staining signals were detected when primary antibodies were omitted (data not shown). Figure 2 provides an overview of CPM immunohistochemical positivity detected in normal-appearing tumor-adjacent renal tissue and tumor regions of the RCC patient samples (n=8). In the cortex of the “normal” tissue regions, the CPM staining pattern (obtained with polyclonal anti-CPM antibodies) was in good agreement with that observed in previous experiments using the monoclonal anti-CPM antibodies (cf. Supplemental Materials, manual staining protocol). Tissue sections of patient 2 (Fig. 2) did not contain normal-appearing tissue. Normal-appearing medulla was only found in tissue sections of patient 1 and also possessed a comparable CPM immunoreactivity.
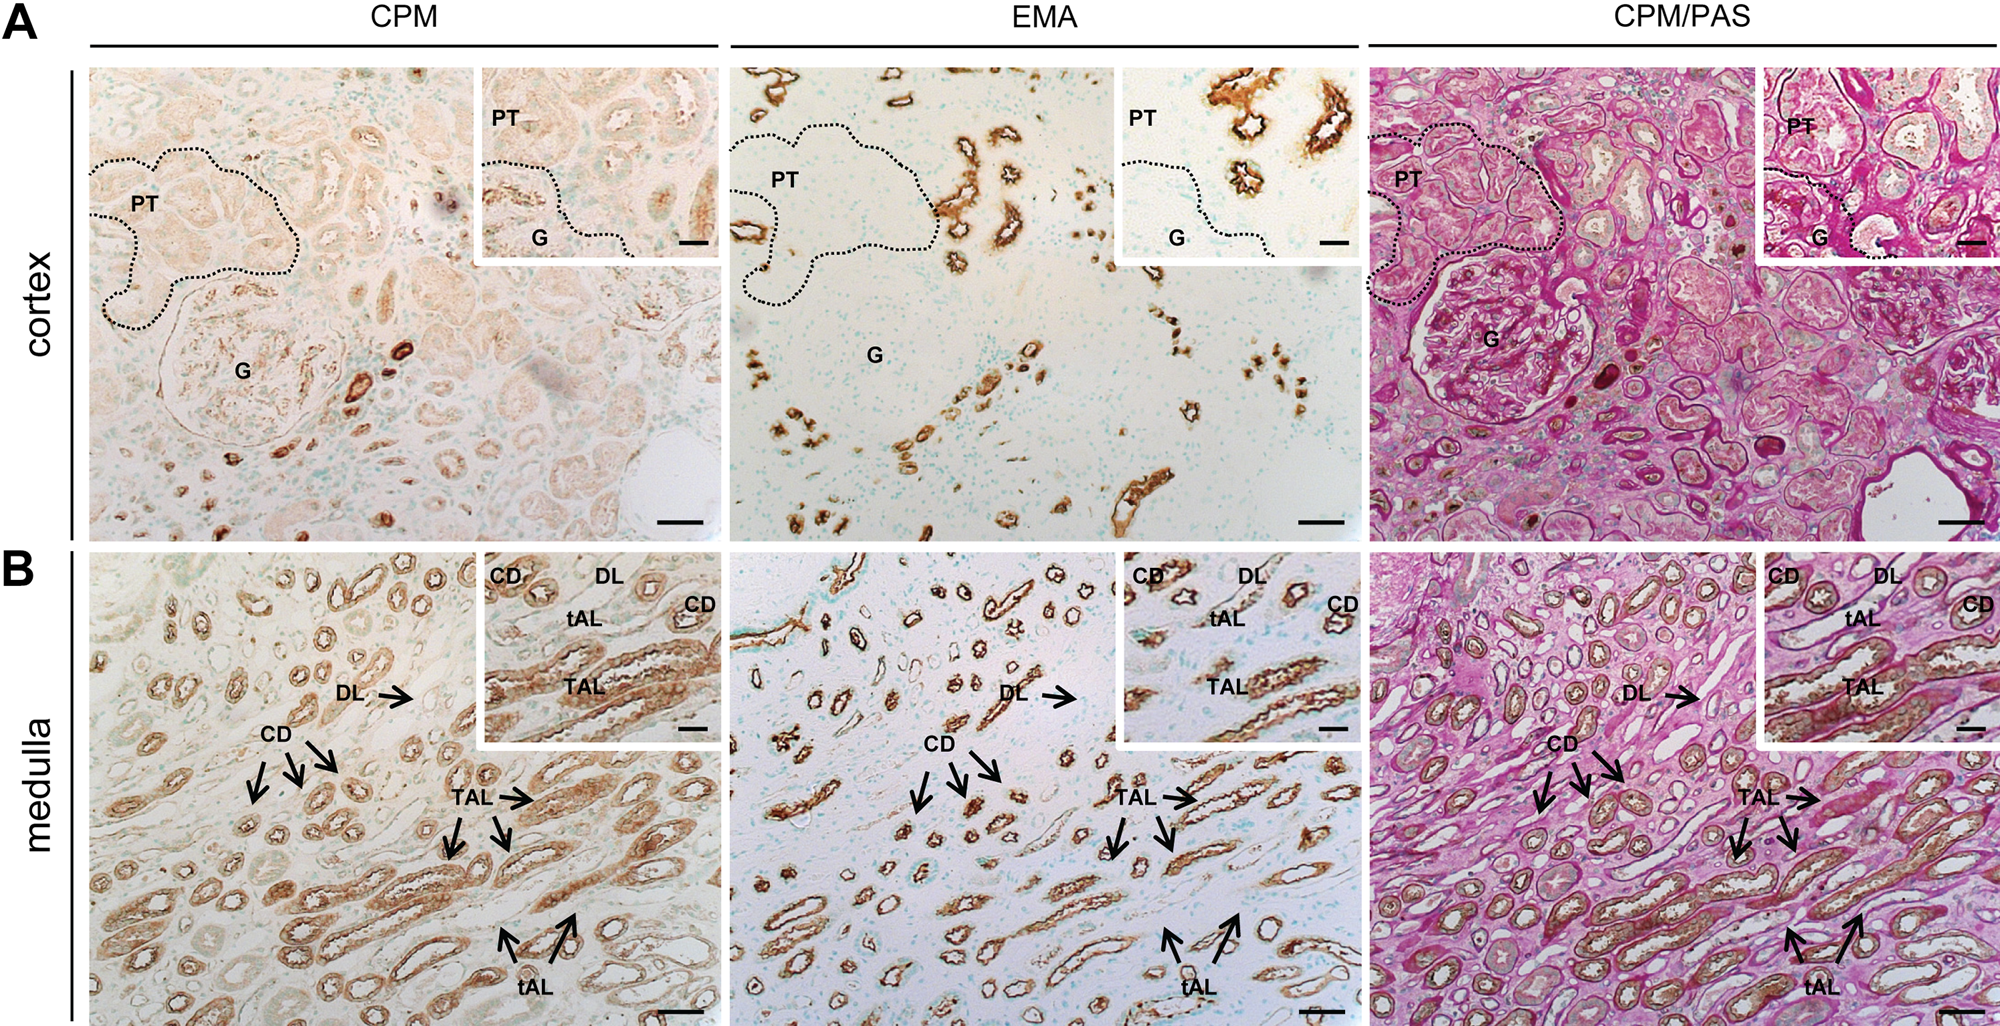
Immunohistochemical localization of carboxypeptidase M (CPM) in human healthy kidney tissue (n=4). Serial paraffin sections of healthy kidney were stained for CPM, epithelial membrane antigen (EMA), or CPM/periodic acid-Schiff stain (PAS) (manual stainings; cf. Supplemental Materials). CPM was detected using mouse anti-human CPM antibodies (clone 1C2, 1:30). Insets show selected regions at higher magnification. EMA is a specific apical surface marker of DT and CD in the cortex and of CD and TAL in the medulla. (A) Renal cortex. In the overview photographs, a dotted line shows an example of CPM immunoreactivity in PT, whereas in the insets, it delineates a glomerulus. (B) Medulla. Scale bar size = 50 µm, with insets 20 µm. CD, collecting duct; DL, descending limb of the loop of Henle; EMA, epithelial membrane antigen; G, glomerulus; PT, proximal tubule; tAL, thin ascending limb of the loop of Henle; TAL, thick ascending limb of the loop of Henle.
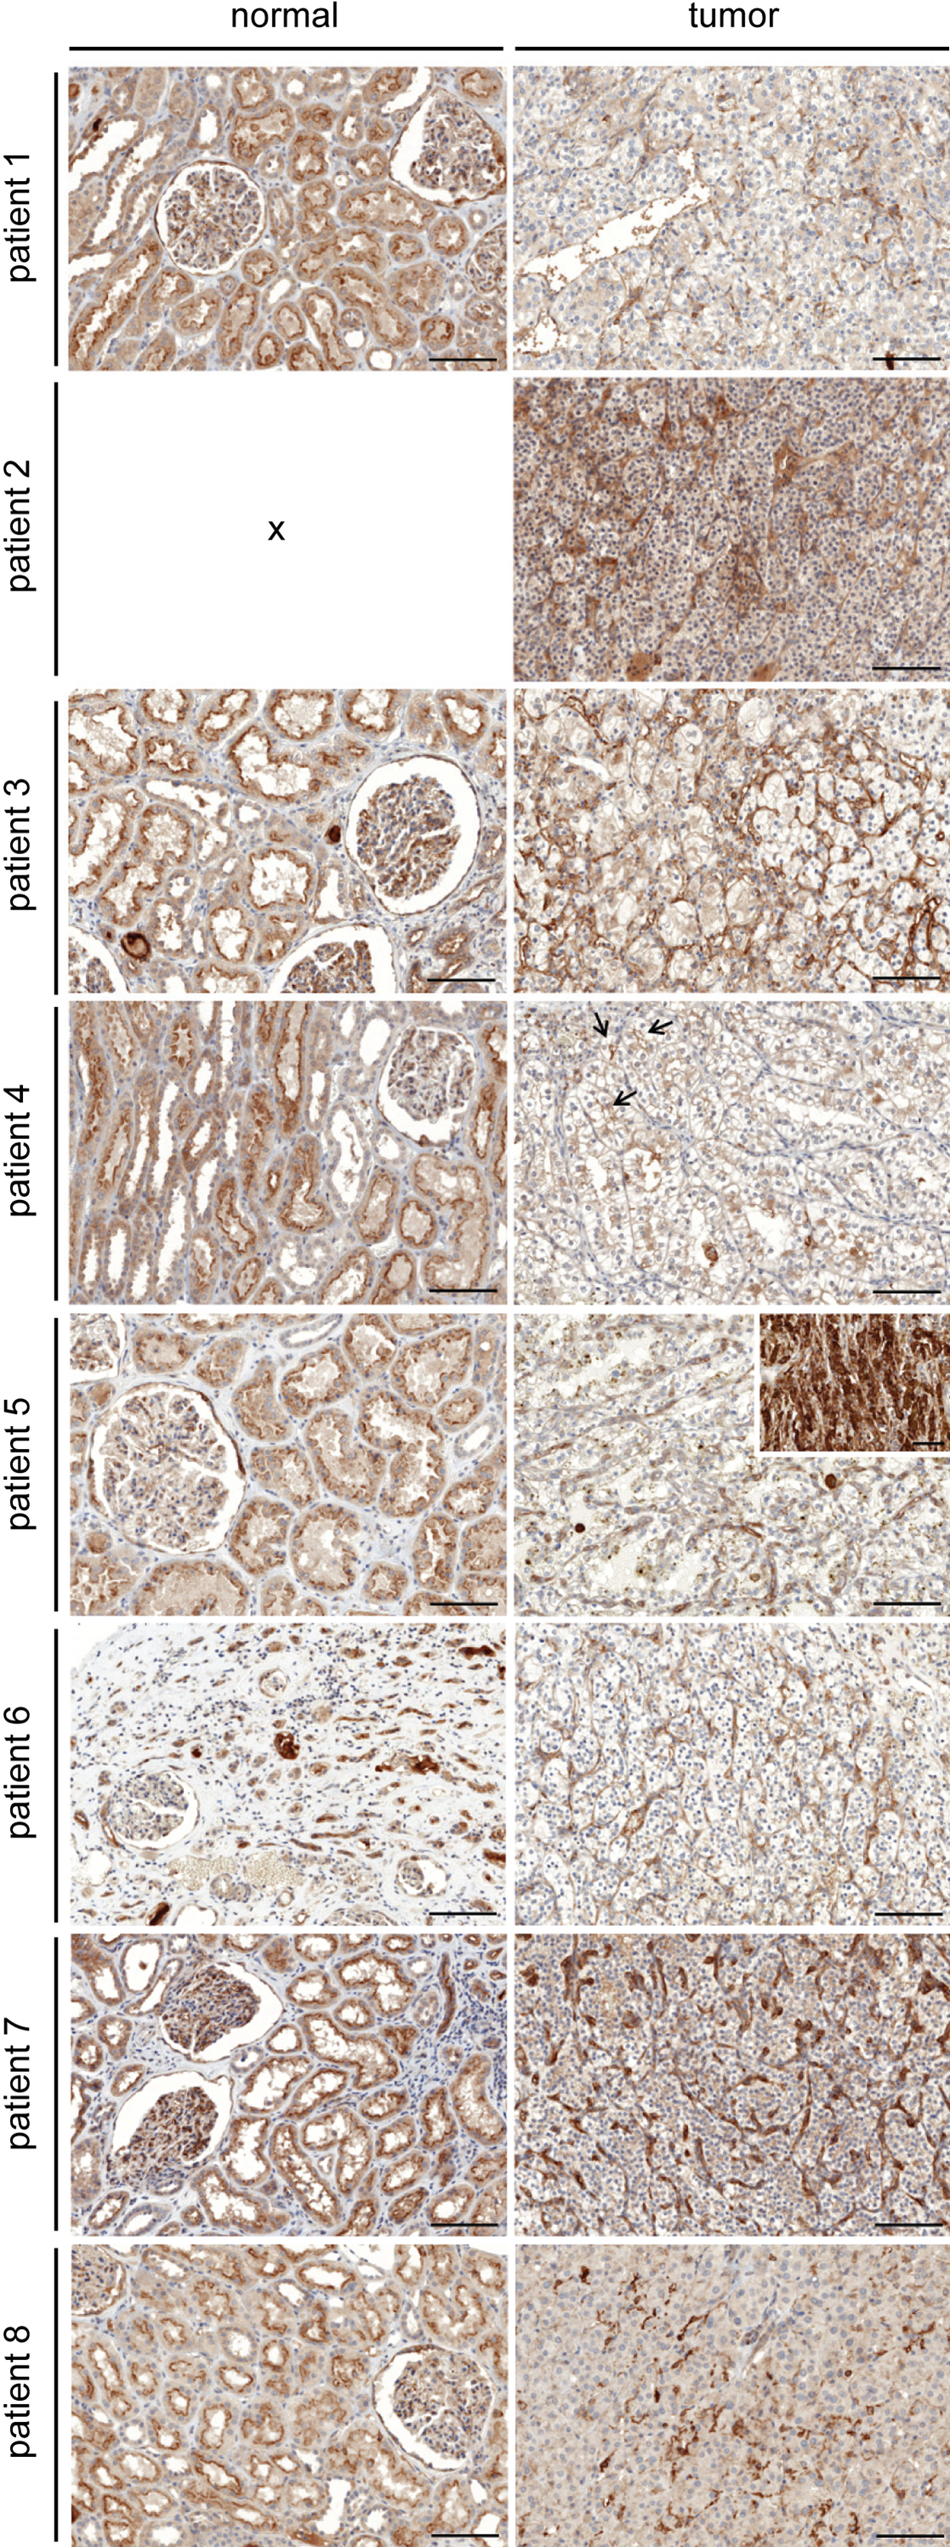
Immunohistochemical staining of carboxypeptidase M (CPM) in renal cell carcinoma tissue sections (n=8) and normal-appearing tumor-adjacent renal tissue. Panels on the left show representative images from normal-appearing renal tissue for patients 1 to 8 (cf. Table 3; tissue sections of patient 2 did not contain normal-appearing tissue). Panels on the right show renal cell carcinoma sections. Rabbit anti-human CPM polyclonal antibodies were used (1:40). For patient 4, arrows indicate examples of apical CPM positivity in primitive tubuli. For patient 5, the inset shows an example of the very intense CPM immunoreactivity on TAMs. Scale bar size = 100 µm. Scale bar size in the inset = 50 µm. RCC, renal cell carcinoma; TAM, tumor-associated macrophage.
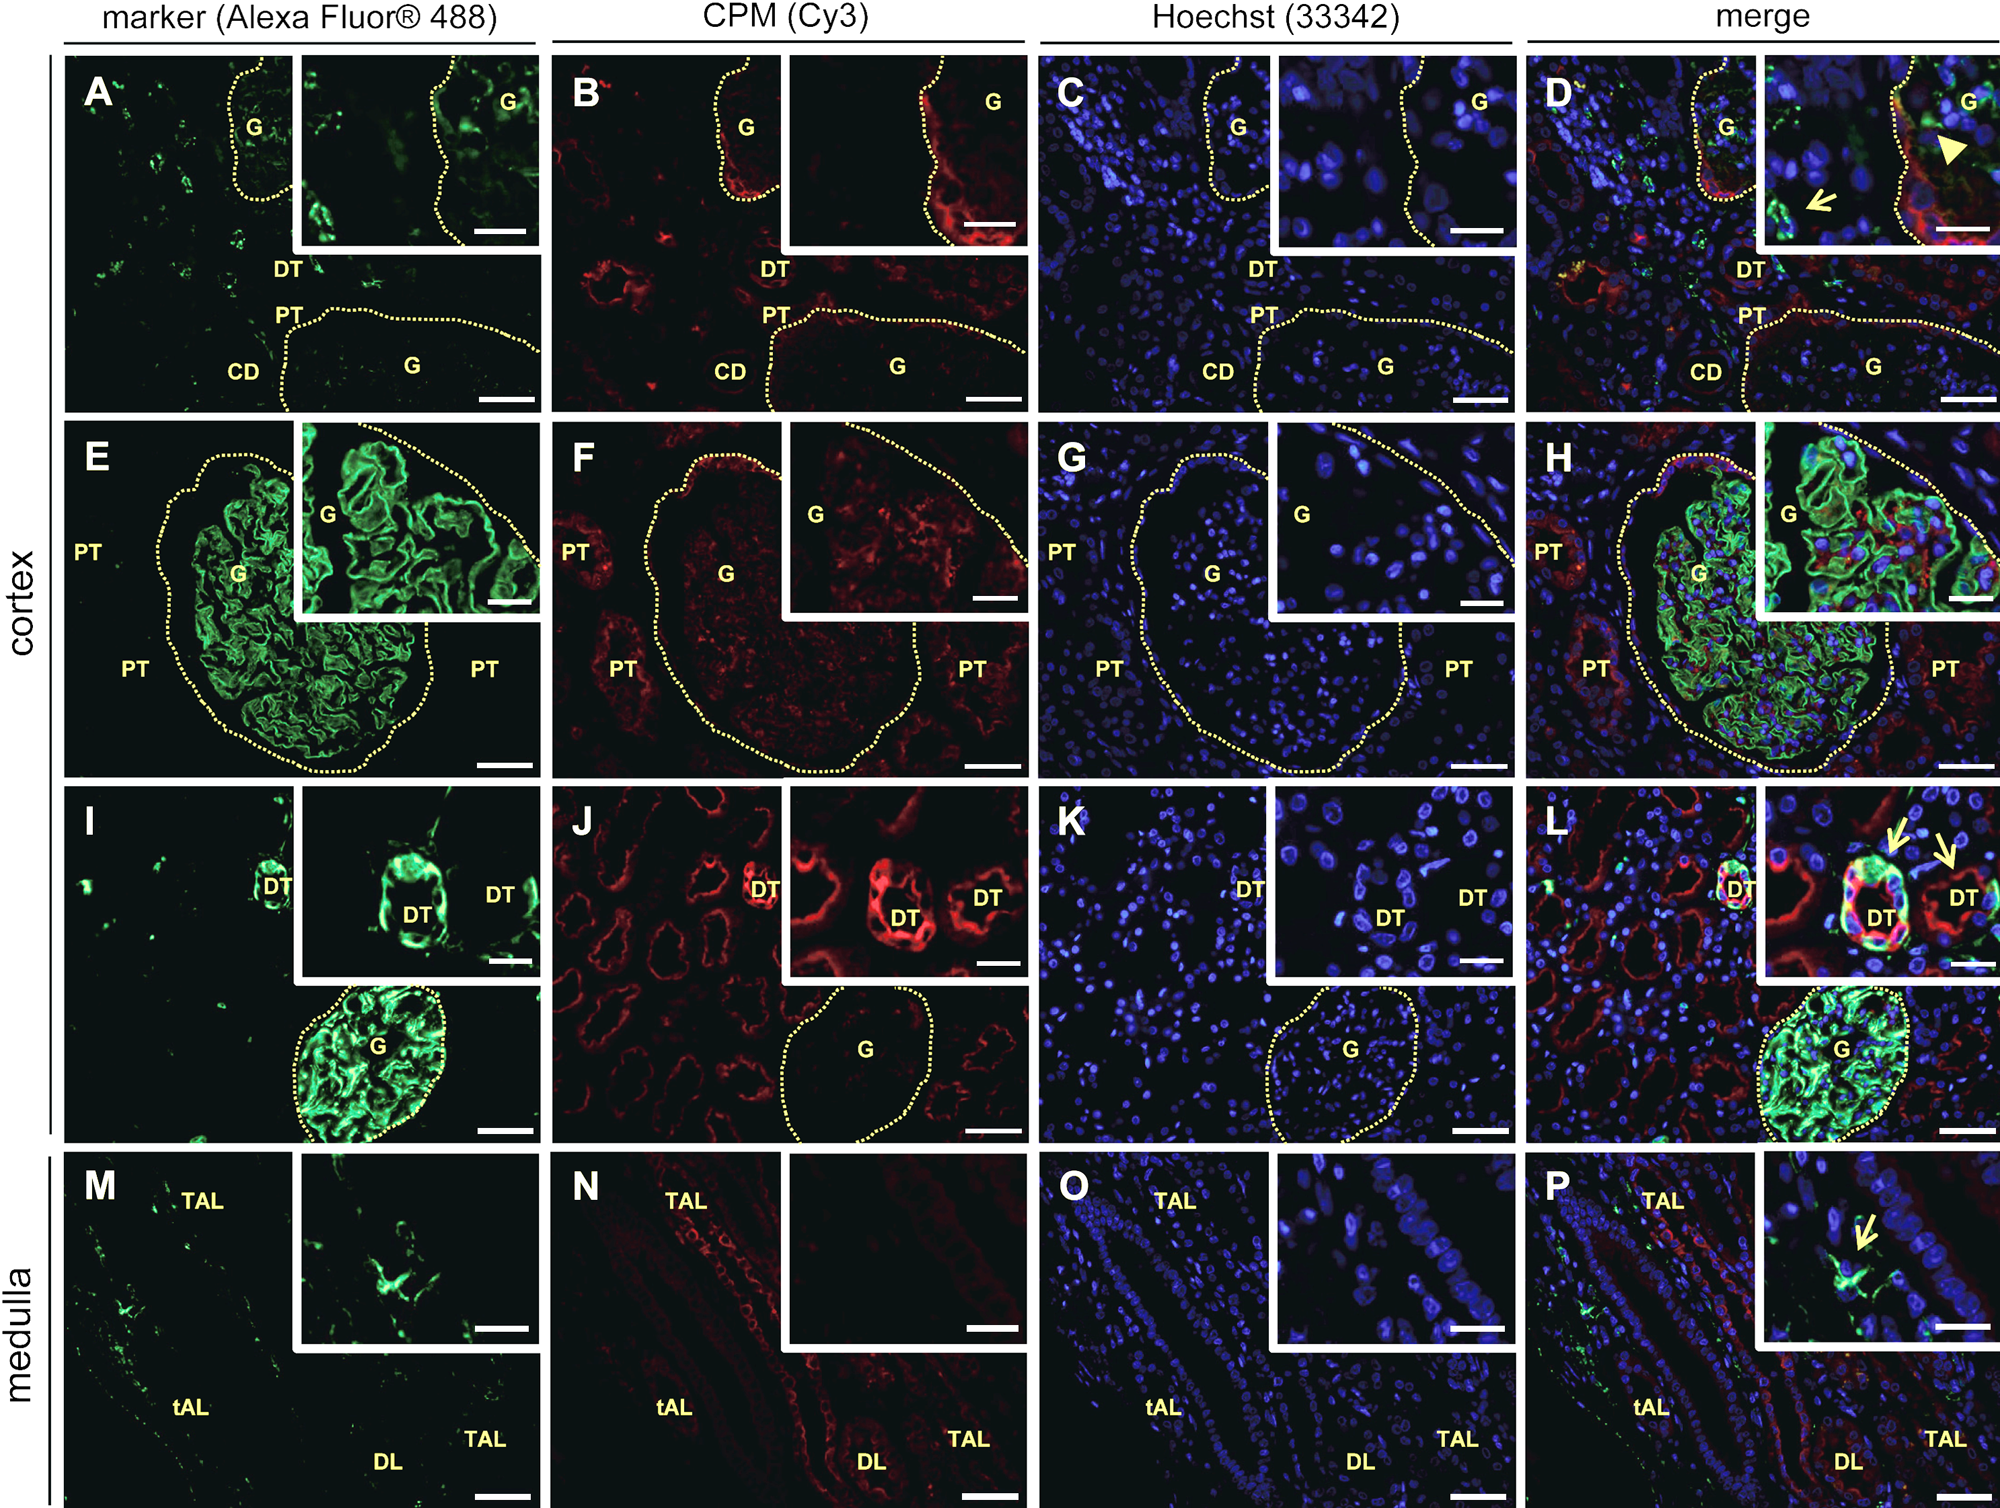
Immunofluorescent double stainings of carboxypeptidase M (CPM) and specific markers in human healthy kidney tissue (n=7). Paraffin tissue sections were double stained for a specific marker (green fluorescence) and CPM (red fluorescence). Nuclei were stained using Hoechst 33342 (blue fluorescence). Merged pictures are also shown. The specific markers that were used are: CD31 (A and M, vascular endothelial cells), nephrin (E, podocytes), and vimentin (I, RCC diagnostic marker). CPM was detected using rabbit anti-human CPM polyclonal antibodies (1:150). Insets show selected regions at higher magnification. Scale bar size = 50 µm, with insets 20 µm. Photographs of the cortex and medulla (indicated on the left) are shown. For panels A to D, E to H, and I to L, glomeruli are indicated with a dotted line. Panel D, inset: interstitial and glomerular capillaries, both negative for CPM, are indicated with an arrow and arrowhead, respectively. Panel L, inset: CPM/vimentin-positive distal tubuli are indicated with arrows. Panel P, inset: the arrow shows an example of a CPM-negative interstitial capillary. CD, collecting duct; DL, descending limb of the loop of Henle; DT, distal tubule; G, glomerulus; PT, proximal tubule; RCC, renal cell carcinoma; tAL, thin ascending limb of the loop of Henle; TAL, thick ascending limb of the loop of Henle.
Immunofluorescent double stainings of normal kidney (adjacent to RCC, n=7) confirmed the localization of CPM in the different renal structures and cells of the healthy kidney obtained in the immunohistochemical stainings (Fig. 3, CPM, panels B, F, J, and N). Again, intense apical staining was observed for proximal TECs and distal TECs (Fig. 3, CPM, e.g., F and J). The following renal cell-specific CPM expression was revealed. In the renal cortex, CPM did not co-localize with CD31 (Fig. 3A–D). The CPM protein was not expressed on vascular endothelial cells of the glomerular capillaries and the interstitial vasculature (Fig. 3D, overview and inset). Interstitial vascular endothelial cells in the renal medulla also did not express CPM (Fig. 3M–P, and panel P, inset). CPM was not found in podocytes of the glomeruli (Fig. 3E–H) or in lymphatic capillaries that were sporadically present in the normal-appearing kidney tissue sections (data not shown). Vimentin is a widely expressed intermediate filament protein of the cytoskeleton. In the normal kidney, vimentin is present in glomeruli, arterioles, and some interstitial fibroblasts but not found in tubuli (Bravo et al. 2003). Vimentin represents one of the many proposed molecular biomarkers in RCC (Rink et al. 2011). The presence of vimentin in the “healthy” glomeruli was apparent (Fig. 3I). Although most of the tubuli in the normal-appearing tumor-adjacent renal tissue samples were vimentin negative, strong vimentin positivity was occasionally detected at the basolateral pole of some TECs (Fig. 3I, L, overviews and insets). The sporadic but intense tubular neoexpression of vimentin likely indicates (pre)neoplastic lesions (Ward et al. 1992). Figure 4 highlights some specific observations regarding the expression of CPM in normal-appearing renal tissue. Strong CPM positivity was observed at the parietal epithelium of the Bowman’s capsule (Fig. 4A). Very weak CPM signals were detected in the macula densa, whereas juxtaglomerular cells and endothelial cells at the vascular pole of the glomeruli were CPM negative (Fig. 4B). Finally, CPM presence was detected in intraglomerular mesangial cells and the mesangial matrix (Fig. 4C).
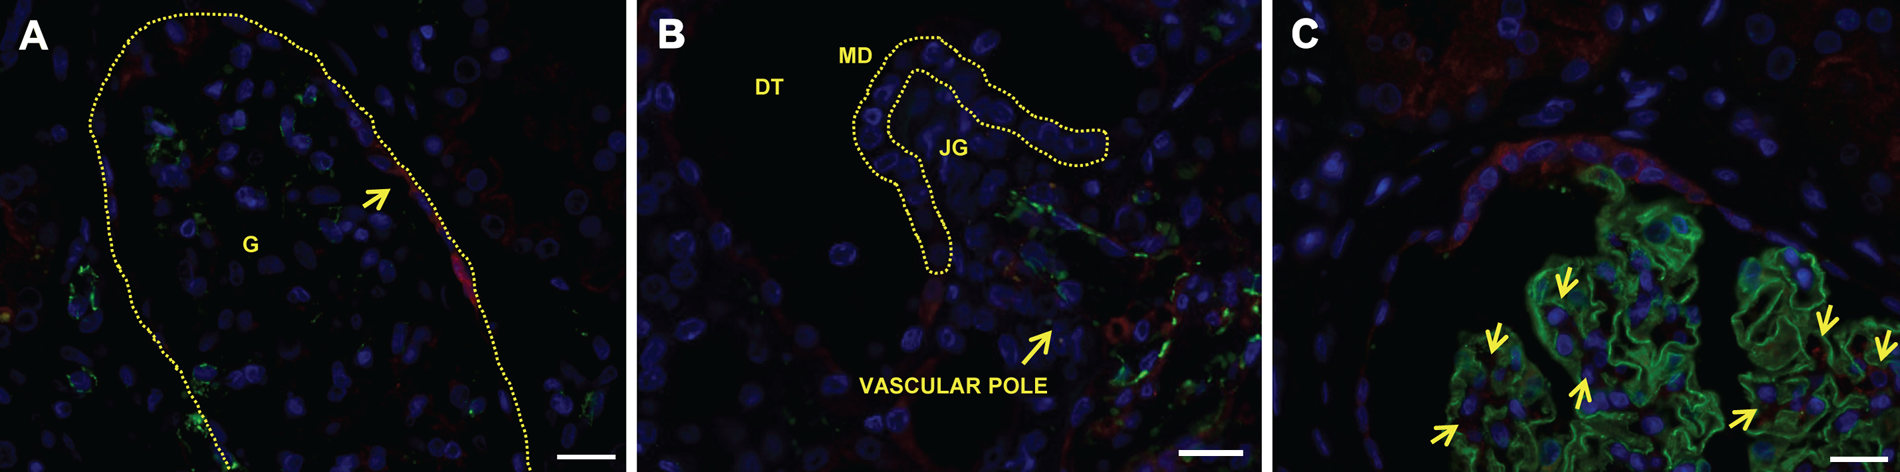
Specific localization sites of carboxypeptidase M (CPM) in human healthy kidney tissue. (A, B) CD31 (green)/CPM (red) immunofluorescent double stainings. (C) Nephrin (green)/CPM (red) immunofluorescent double staining. CPM was detected using rabbit anti-human CPM polyclonal antibodies (1:150). Nuclei were stained with Hoechst 33342 (blue). (A) CPM localizes to the parietal epithelium of the Bowman’s capsule (arrow). The dotted line delineates a glomerulus. (B) The MD (indicated with a dotted line) shows very weak CPM positivity, whereas JGs and endothelial cells (CD31 positive) at the vascular pole of the glomerulus are CPM negative. (C) Arrows indicate examples of CPM positivity at intraglomerular mesangial cells. Scale bar size = 20 µm. DT, distal tubule; G, glomerulus; JG, juxtaglomerular cell; MD, macula densa.
Carboxypeptidase M expression is lost in human renal cell carcinoma tumor cells, whereas it is abundant in tumor-associated foam cells and neovasculature
In this pilot study, eight patients, who were diagnosed with RCC, were included (Table 3). Immunohistochemical CPM reactivity detected in normal-appearing tumor-adjacent renal tissue and tumor regions of the RCC patient samples is presented in Fig. 2. In tumor regions, a classic alveolar growth pattern and clear cytoplasm was observed for all clear cell RCC specimens (Valera and Merino 2011). Irregular nuclei and perinuclear halos were observed in the chromophobe RCC tumor cells (Stec et al. 2009). Generally, tumor cells were CPM negative or weakly positive. However, membrane anchoring of CPM on some tumor cells could not be excluded. In tumor regions of the tissue sections of patient 4, CPM seemed to line the apical side of structures resembling primitive tubules (Fig. 2D). In all tumors, strong CPM staining recurrently was observed at vascular endothelial cells (except for patient 4) and stromal cells (Fig. 2, tumor sections). No staining was observed when primary antibodies were replaced by irrelevant immunoglobulins (data not shown).
Carboxypeptidase M (CPM) Expression and Co-localization with Specific Markers in Renal Cell Carcinoma (RCC) Samples (n=8)
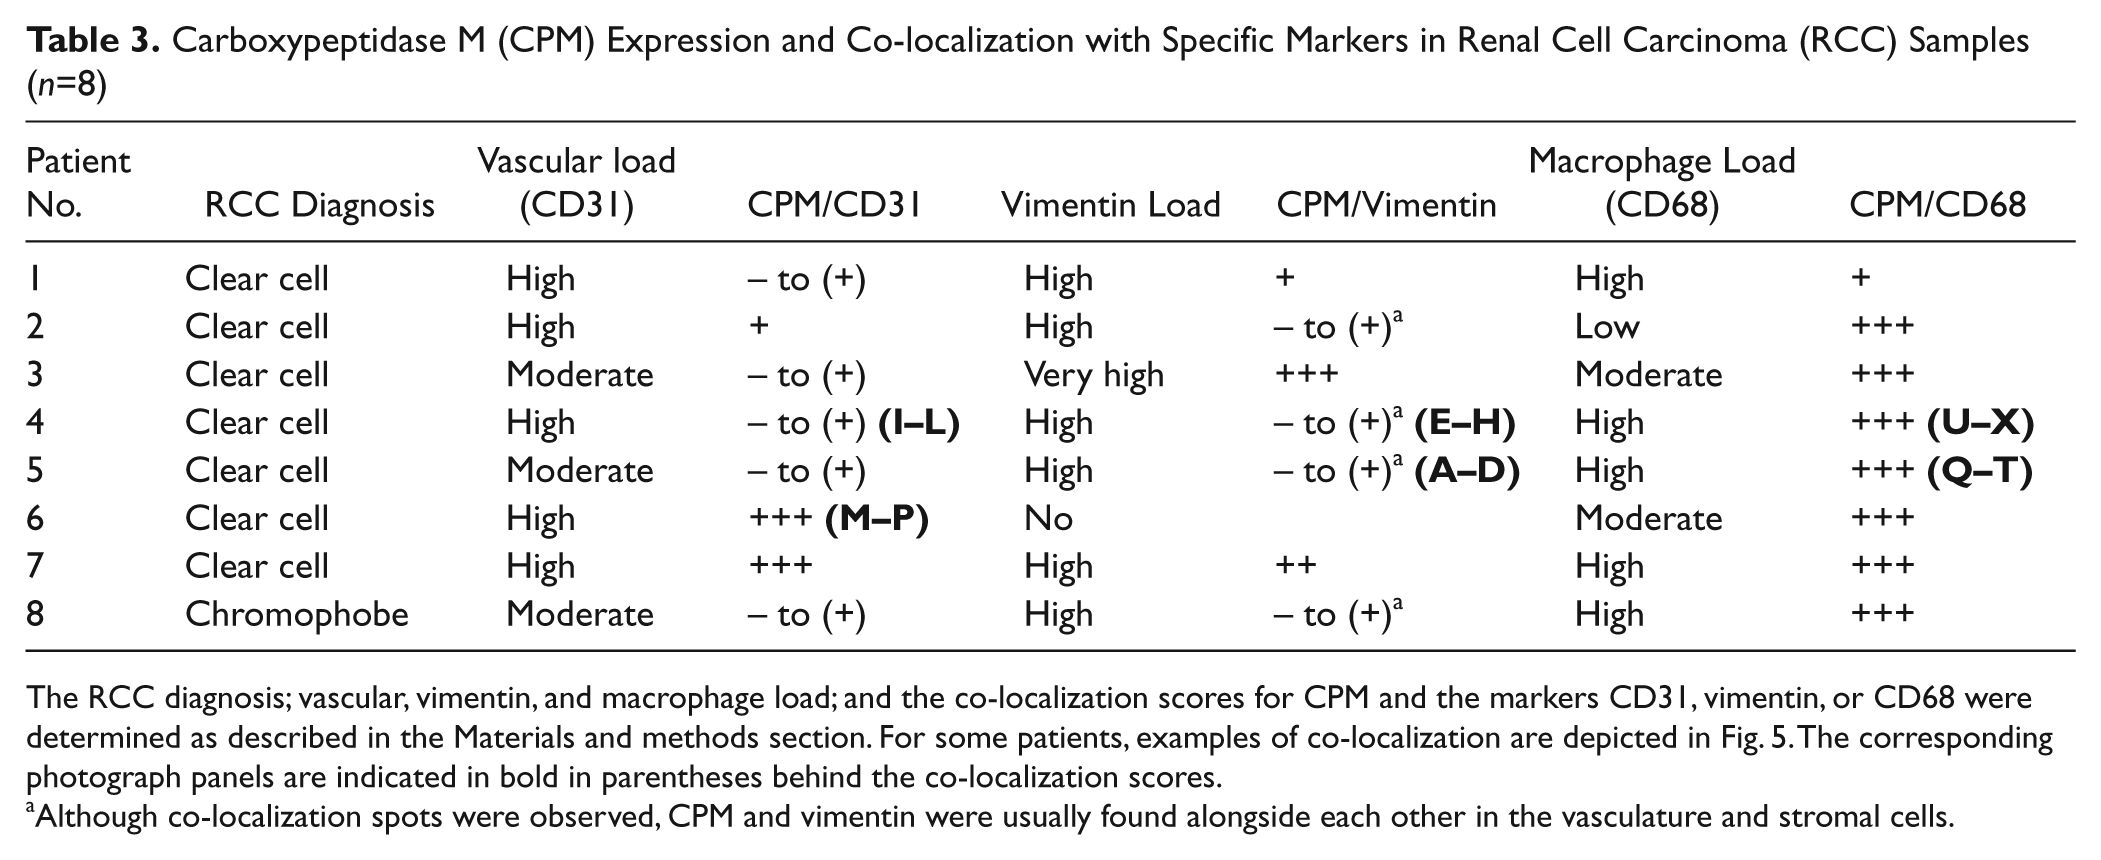
The RCC diagnosis; vascular, vimentin, and macrophage load; and the co-localization scores for CPM and the markers CD31, vimentin, or CD68 were determined as described in the Materials and methods section. For some patients, examples of co-localization are depicted in Fig. 5. The corresponding photograph panels are indicated in bold in parentheses behind the co-localization scores.
Although co-localization spots were observed, CPM and vimentin were usually found alongside each other in the vasculature and stromal cells.
The immunohistochemical observations made for the expression of CPM in RCC were confirmed and refined by examining the co-localization of CPM and specific cell markers in double immunofluorescent staining experiments (Fig. 5). Vimentin was used as a diagnostic marker for RCC. Table 3 summarizes the co-localization data. All RCC cases contained high to very high levels of vimentin, except for this tissue from patient 6, which lacked vimentin positivity. Vimentin positivity was observed at the rich microvascular network and the stroma (e.g., patient 5, Fig. 5A, D). For patient 4, a distinct vimentin staining pattern was detected (Fig. 5E, H). A very intense vimentin positivity was observed at the delicate vascular network and the branching connective tissue that typically separate nested tumor cells in these tumors (Valera and Merino 2011). Also, vimentin highlighted the well-demarcated tumor cell membranes (Valera and Merino 2011). In all other cases (except for the vimentin negative clear cell carcinoma case), CPM and vimentin located alongside each other in the micro- (and macro-) vasculature and stromal cells. In addition, clear CPM/vimentin co-localization spots were detected. This was also observed in the case of chromophobe RCC (data not shown).
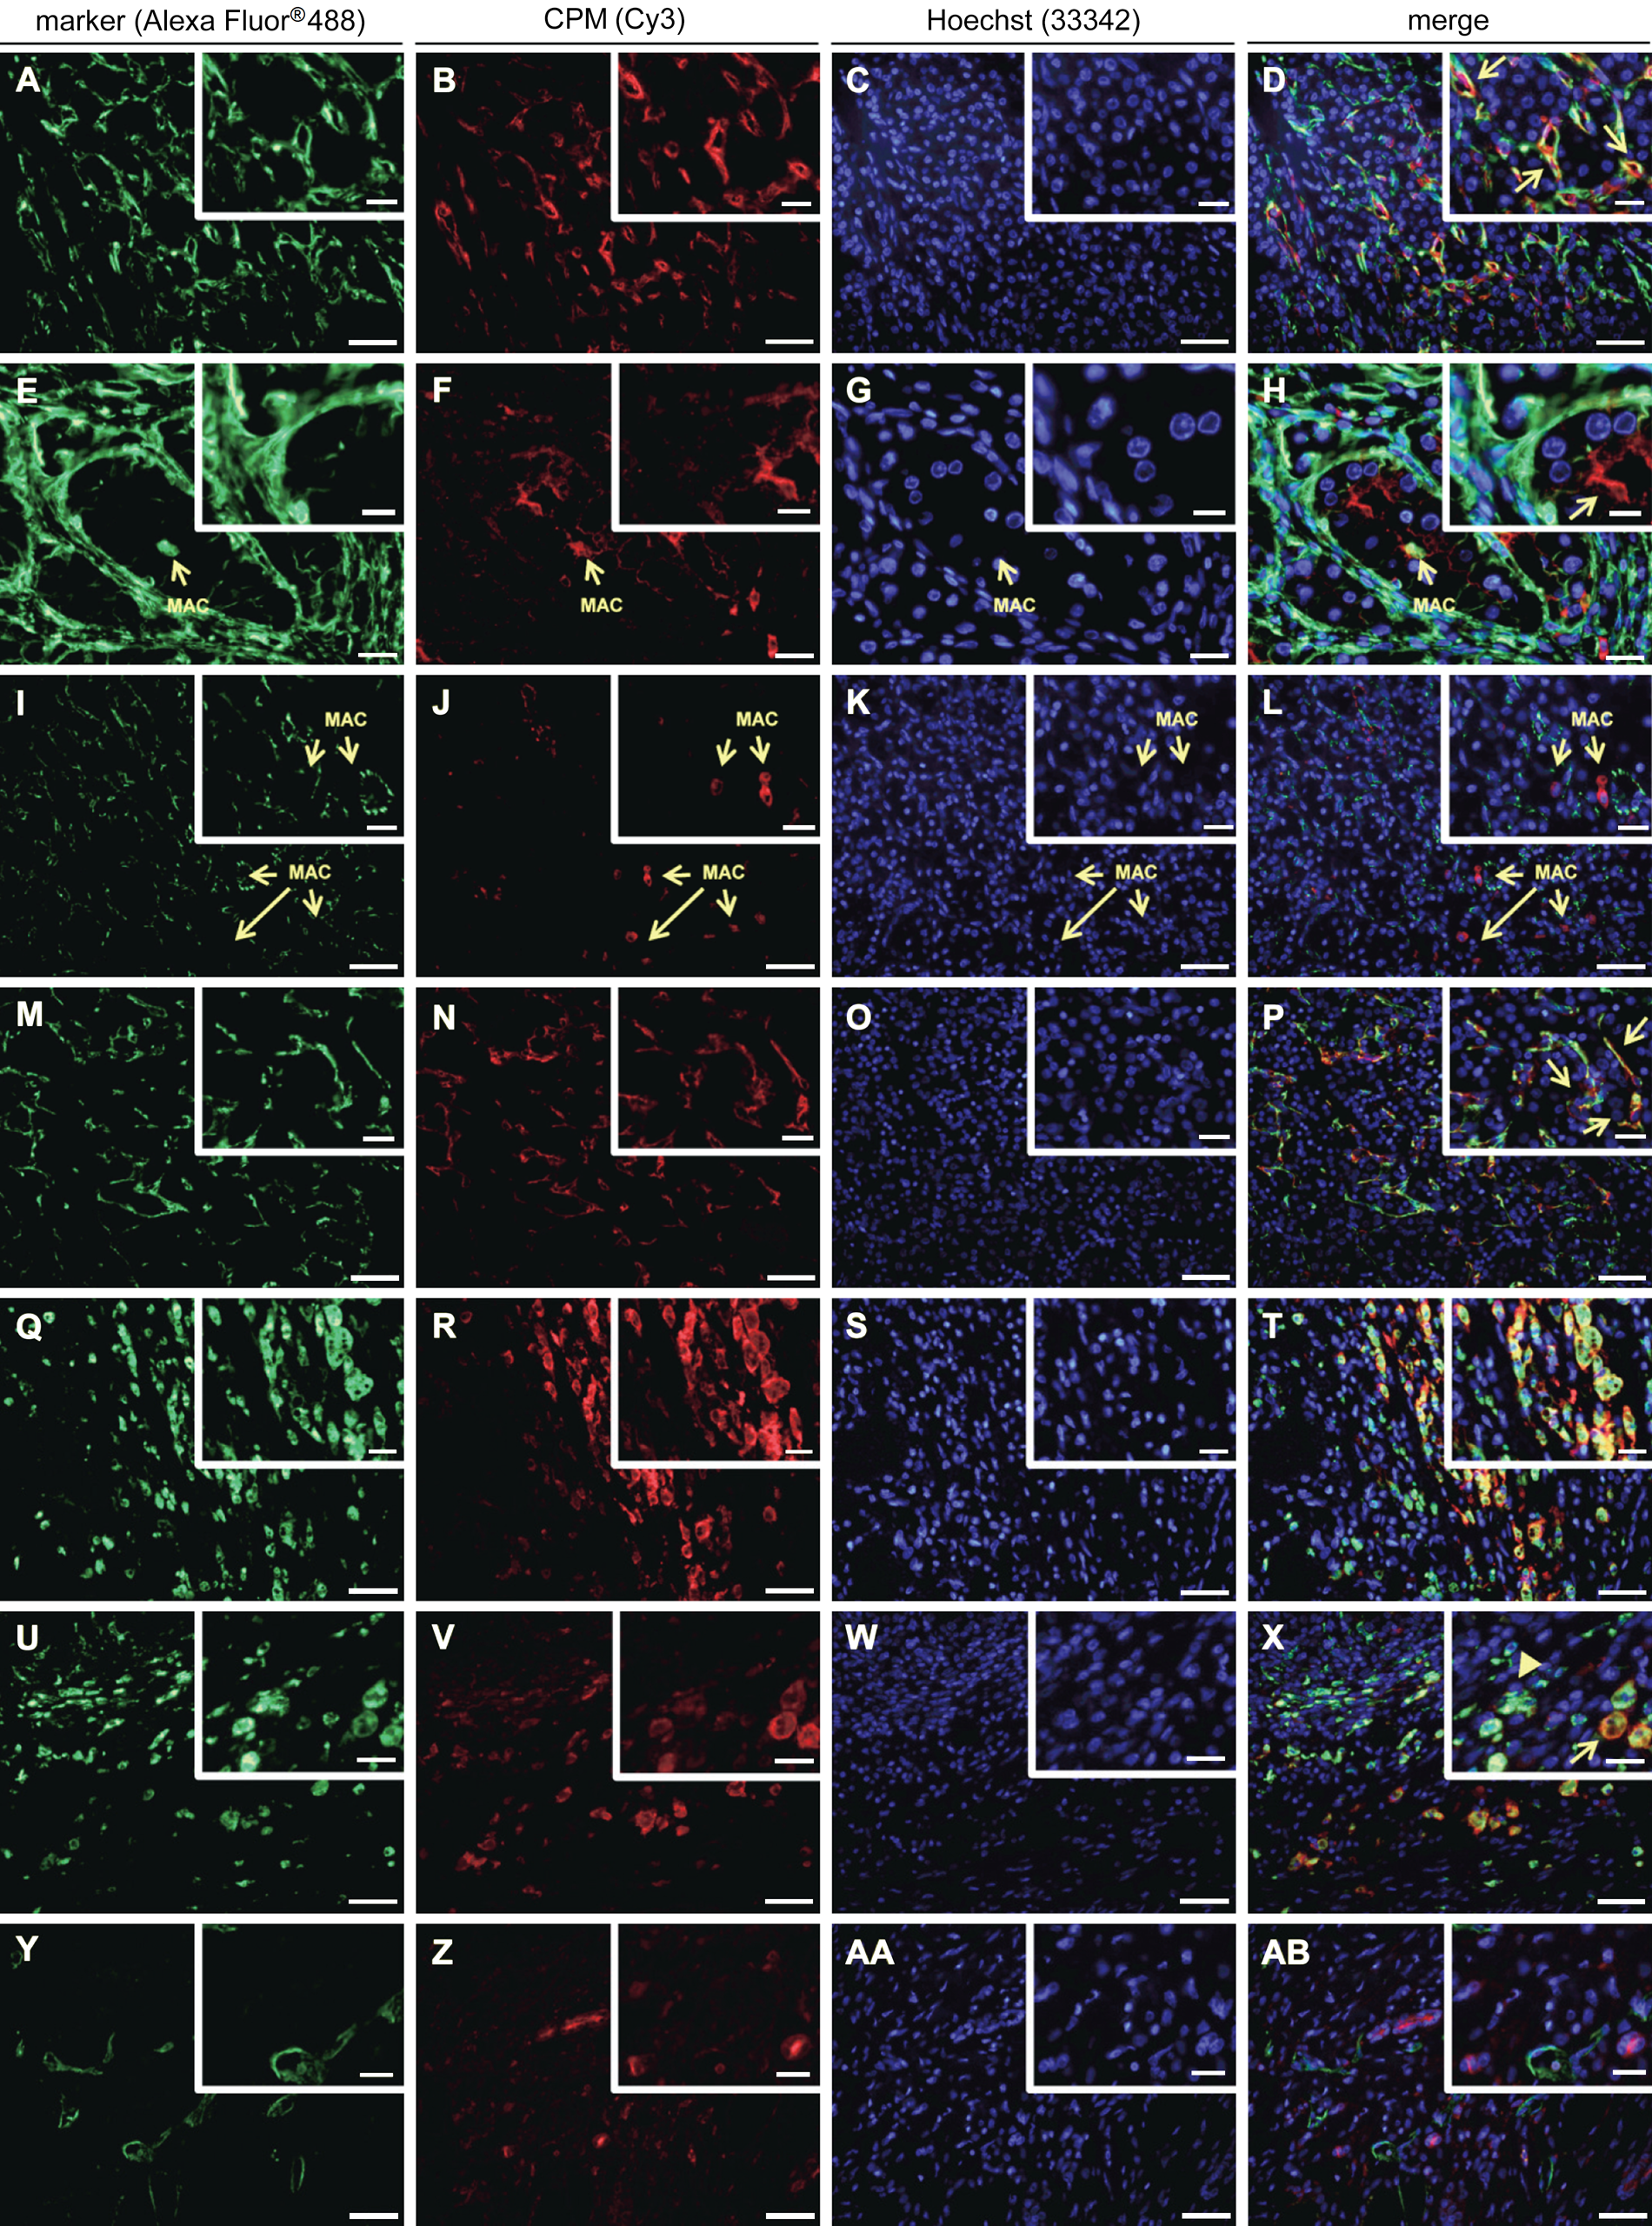
Immunofluorescent double stainings of carboxypeptidase M (CPM) and specific markers in renal cell carcinoma tissue samples (n=8). Paraffin sections of renal cell carcinoma tissue specimens were double stained for a specific marker (green fluorescence) and CPM (red fluorescence). Nuclei were stained using Hoechst 33342 (blue fluorescence). Merged pictures are also shown. The specific markers that were used are vimentin (A and E, RCC diagnostic marker), CD31 (I and M, vascular endothelial cells), CD68 (Q and U, macrophages), and podoplanin (Y, lymphatic capillaries). Insets show selected regions at higher magnification. Scale bar size = 50 µm, with insets 20 µm. For panels E to H: scale bar size = 20 µm, with insets 10 µm. Panels E to H and I to L: macrophages are indicated with an arrow and “MAC.” Panel D, inset: CPM/vimentin co-localization spots (arrows). Panel H, inset: the arrow shows apical CPM staining in a malignant transforming tubule. Panel P, inset: examples of CPM/CD31 co-localization (arrows). Panel X, inset: example of small macrophages with CD68 > CPM positivity (arrowhead) and of big foamy macrophage cells with CPM > CD68 positivity (arrow). MAC, macrophage; RCC, renal cell carcinoma.
The vascular load of the RCC samples was moderate to high, as determined by CD31 staining of the vasculature (Table 3). Sporadic (“spots”) to no co-localization of CPM with CD31 was found in clear cell RCC tissue samples (Table 3 and, e.g., patient 4, Fig. 5I–L) and the chromophobe RCC case. Interestingly, clear CPM/CD31 double positivity was observed in two cases of clear cell carcinoma (patient 6, Fig. 5M–P, and patient 7) that were both highly vascularized (Table 3).
Tumor-associated macrophages (TAMs) present in the RCC samples showed a very intense ring-like staining pattern for CPM, which indicated its membrane-bound presence (Fig. 5Q–T). Noteworthy, some normal-appearing RCC-adjacent tissue samples showed macrophage infiltration (data not shown). Macrophages showed distinct staining for CD68 and/or CPM that appeared to be dependent on the cell size and foamy-like appearance. Small monocytes/ macrophages mainly contained CD68, whereas large, foamy-like macrophages reacted strongly with CPM antibodies. Not all small macrophages were CPM positive. CD68 was detected on foam cells, but staining was usually less intense compared with that of small macrophages. CPM covered the macrophage cell surface and was unambiguously associated with the membrane. CD68 showed a scattered staining pattern, consistent with its expected localization. In TAMs, CPM and CD68 staining intensity varied according to the macrophage size and foamy-like appearance. CPM was extensively present in large, lipid-laden foam cells, whereas CD68 positivity appeared to be stronger in small macrophages (Fig. 5U–X, and X, overview and inset). In contrast to the infiltrating macrophages of normal-appearing tumor-adjacent tissue, all TAMs showed CPM reactivity.
Lymphatic capillaries were scarce in RCC and localized solely to the tumor margin near the fibrous capsule. Lymph vessels showed no CPM reactivity (Fig. 5Y–AB). In all experiments, no staining was observed when primary antibodies were replaced by irrelevant immunoglobulins (data not shown).
Tissue microarray analysis of renal cell carcinoma and other renal condition specimens reveals the presence of carboxypeptidase M in papillary renal cell carcinoma and strong epidermal growth factor receptor presence in squamous cell carcinoma specimens
The expression of CPM and EGFR in various renal tumors, diseased tissue, and (tumor-adjacent) healthy kidney tissue (cf. Table 1) was determined using TMA immunohistochemical staining and analysis. EGFR was included in the analysis for the reasons described earlier. The mean IHC CPM intensity of the tumor or epithelial cells was usually stronger in cores of normal and nephritic samples compared with the other TMA samples (Fig. 6A). In hyperplasia, the mean IHC CPM staining intensity was decreased compared with normal tissue. In general, the CPM staining intensity was less in tumor cores than in normal tissue cores. Only in papillary RCC was a stronger CPM staining intensity present that was similar to that in normal tissue. Similar differences were present regarding % of CPM-stained (tumor or epithelial) cells (Fig. 6B). CPM expression in tumor-adjacent normal tissue did not differ statistically from that in normal kidney (p>0.05). Only in cores of normal tissue, nephritis, and papillary RCC was a high percentage of CPM-stained cells (thus a high H-score) present. The CPM expression in papillary RCC specimens was statistically different from that of all other tumor groups (p<0.05 or p<0.001). In contrast, there was no statistically significant difference when its H-score was compared with normal or normal-adjacent groups (p>0.05). In hyperplasia and all other tumor cores, less than 50% of the cells were positive for CPM. CPM staining in all tumor groups (except for the papillary RCC group) was statistically lower than that in normal kidney (p<0.05). For representative stainings of CPM in renal cell carcinoma TMA cores and other renal conditions, see Suppl. Fig. S1 and Suppl. Text T1.
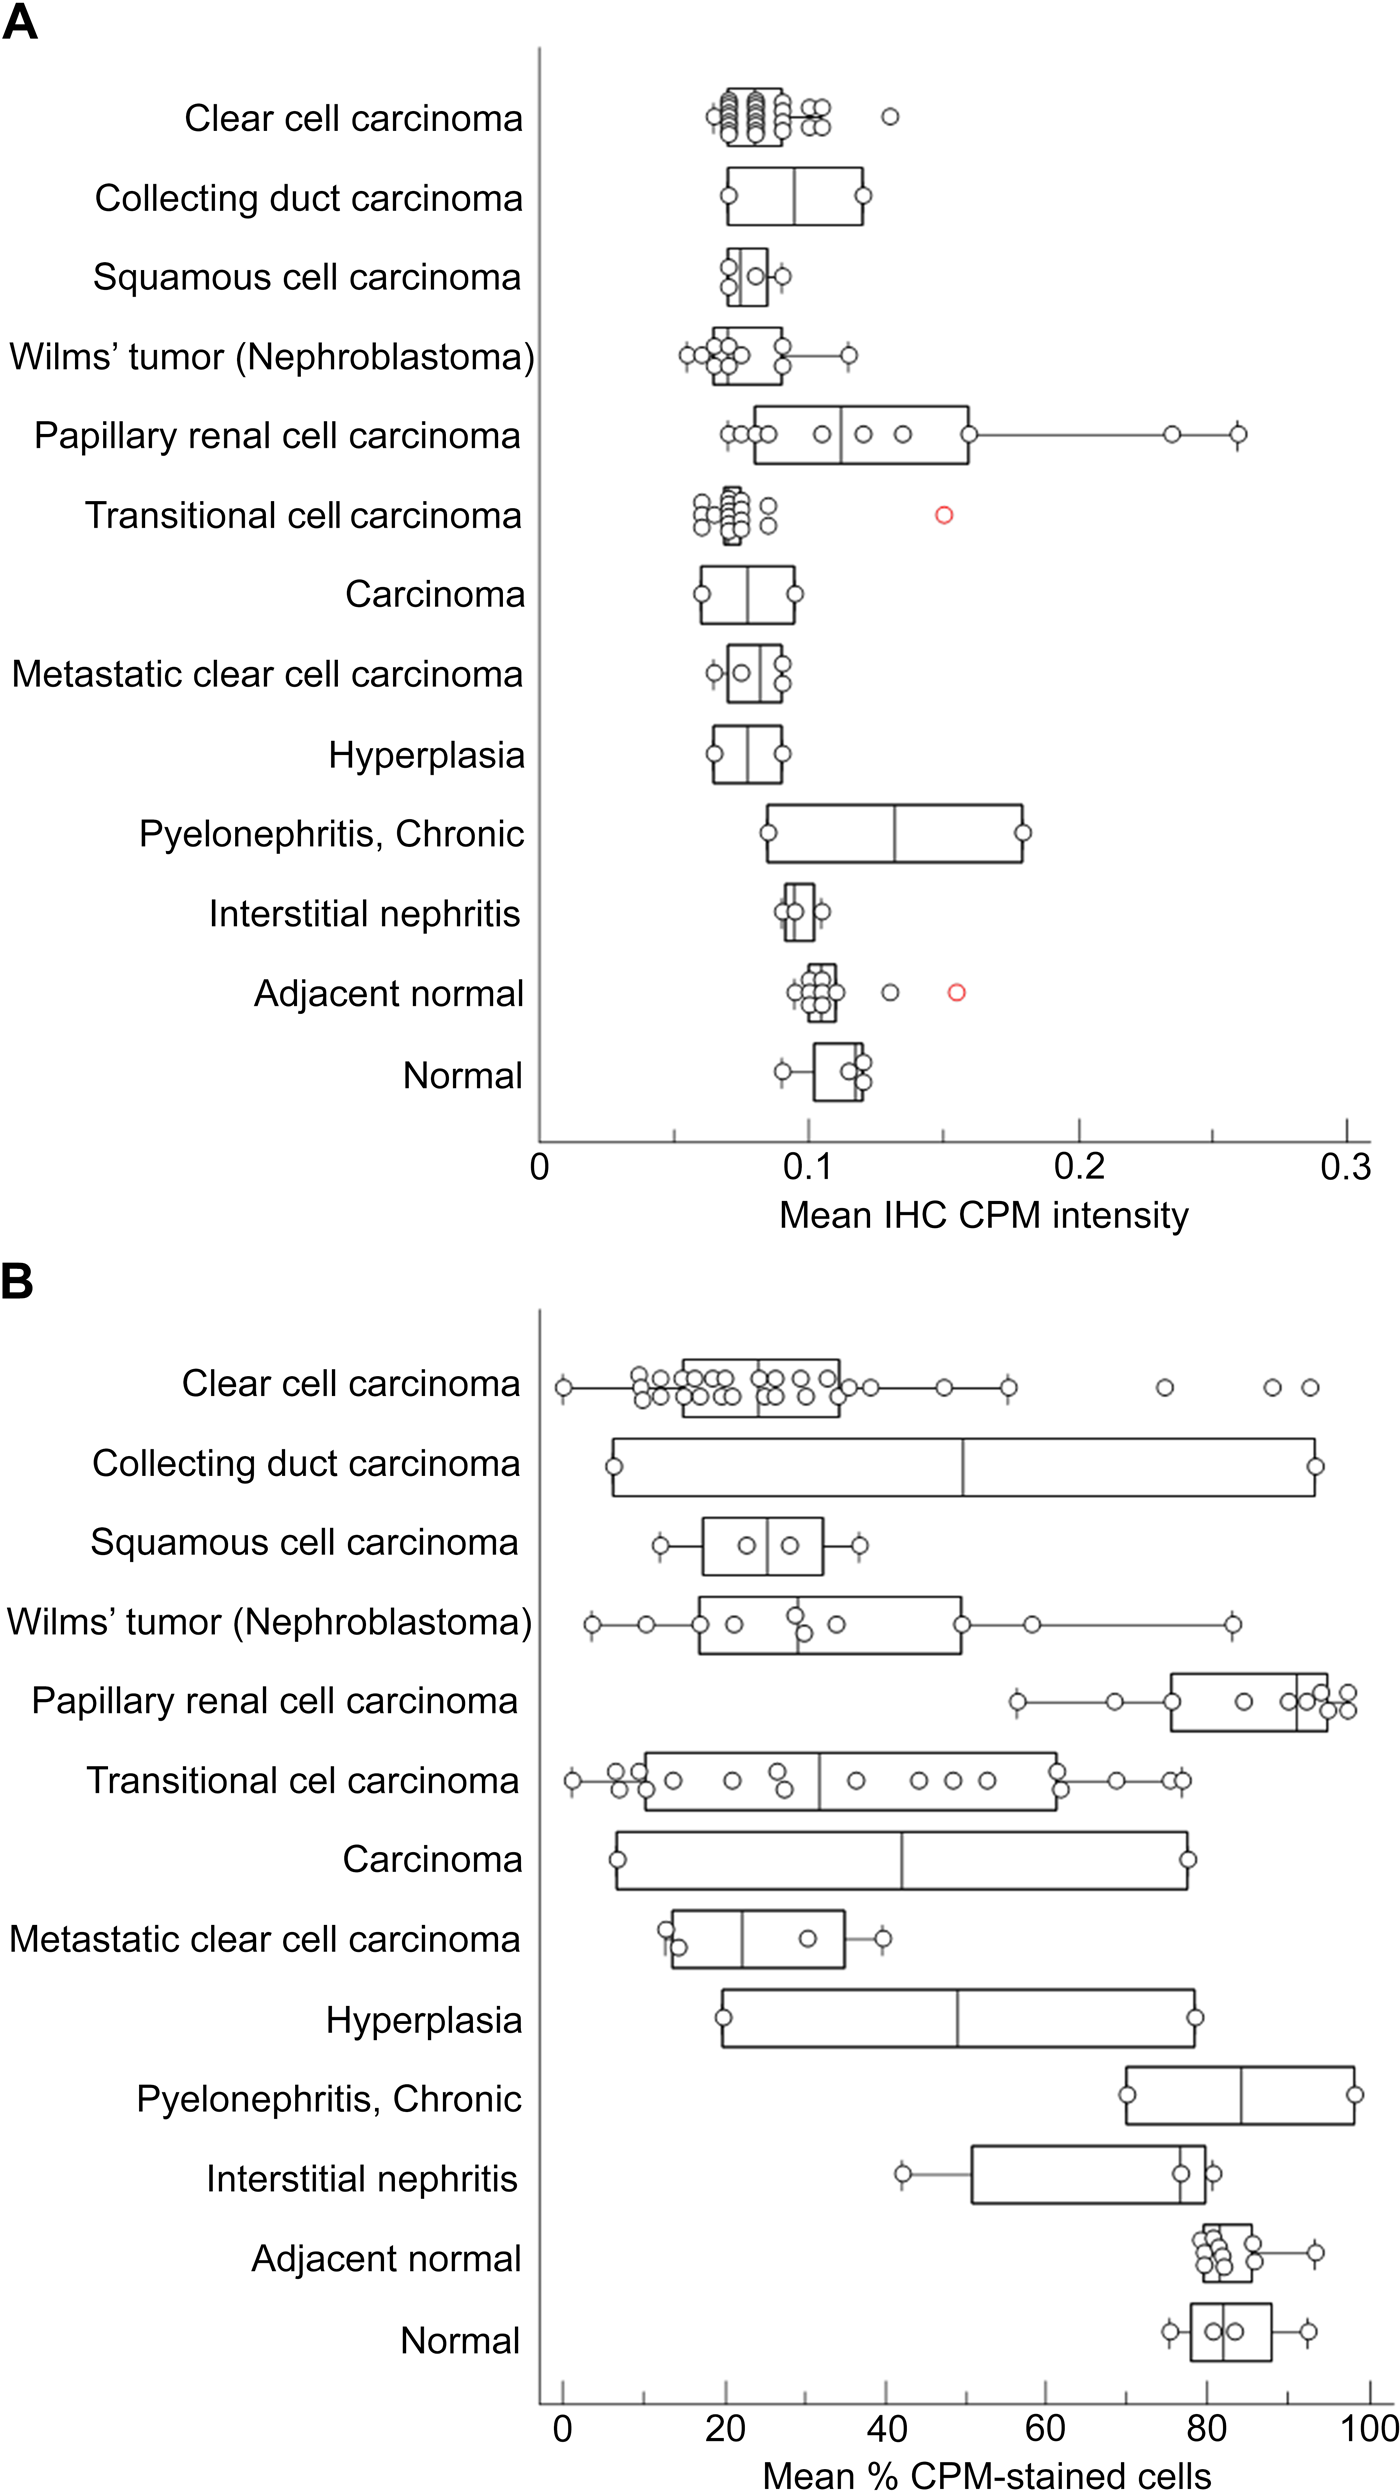
Analysis of carboxypeptidase M (CPM) staining in tissue cores of tissue microarray (TMA) LS-SKICA31 (Lifespan Biosciences, Seattle, WA). Plots of the mean immunohistochemistry (IHC) CPM intensity (A) and mean % CPM-stained cells (tumor or epithelial cells, B) with respect to the diagnosis. Non-tumoral renal disease groups and normal kidney groups were grouped at the end of the charts. Data points represent the average value of two cores/patient. The median value is indicated by the vertical line in the middle of the box, which represents the 25th and 75th percentiles. The error bars on the box indicate the range of the data.
The averaged EGFR staining results are summarized in Fig. 7. Plotting of the mean IHC EGFR membrane staining intensity (Fig. 7A, tumor or epithelial cells) and the H-score of these cells (Fig. 7B) against the different renal diagnoses revealed a weak staining for EGFR in normal tissue and adjacent normal tissue. EGFR expression did not differ statistically between these two groups (p>0.05). Interestingly, in hyperplasia, the mean H-score was higher than that in normal kidney tissue. In cores with pyelonephritis and interstitial nephritis, EGFR membrane staining was weak. The averaged results of the different tumor types demonstrate that the strongest EGFR staining was present in squamous cell carcinoma. The mean H-score for the squamous cell carcinoma group was significantly enhanced compared with all other renal conditions (p<0.05, with the exception of papillary RCC, p=0.054). The averaged results of the other tumor types show that much less EGFR staining was present in the respective cores. However, the EGFR staining results of individual samples within a tumor type differed considerably. There was no significant difference between the mean H-score of the normal kidney group and that of the Wilms tumor, papillary RCC, or metastatic group (p>0.05). Clear cell carcinoma and transitional cell carcinoma showed (somewhat) higher EGFR expression when compared with normal kidney (p=0.029 and p=0.004, respectively). For representative stainings of EGFR in renal cell carcinoma TMA cores and other renal conditions, see Suppl. Fig. S2–S3 and Suppl. Text T2.
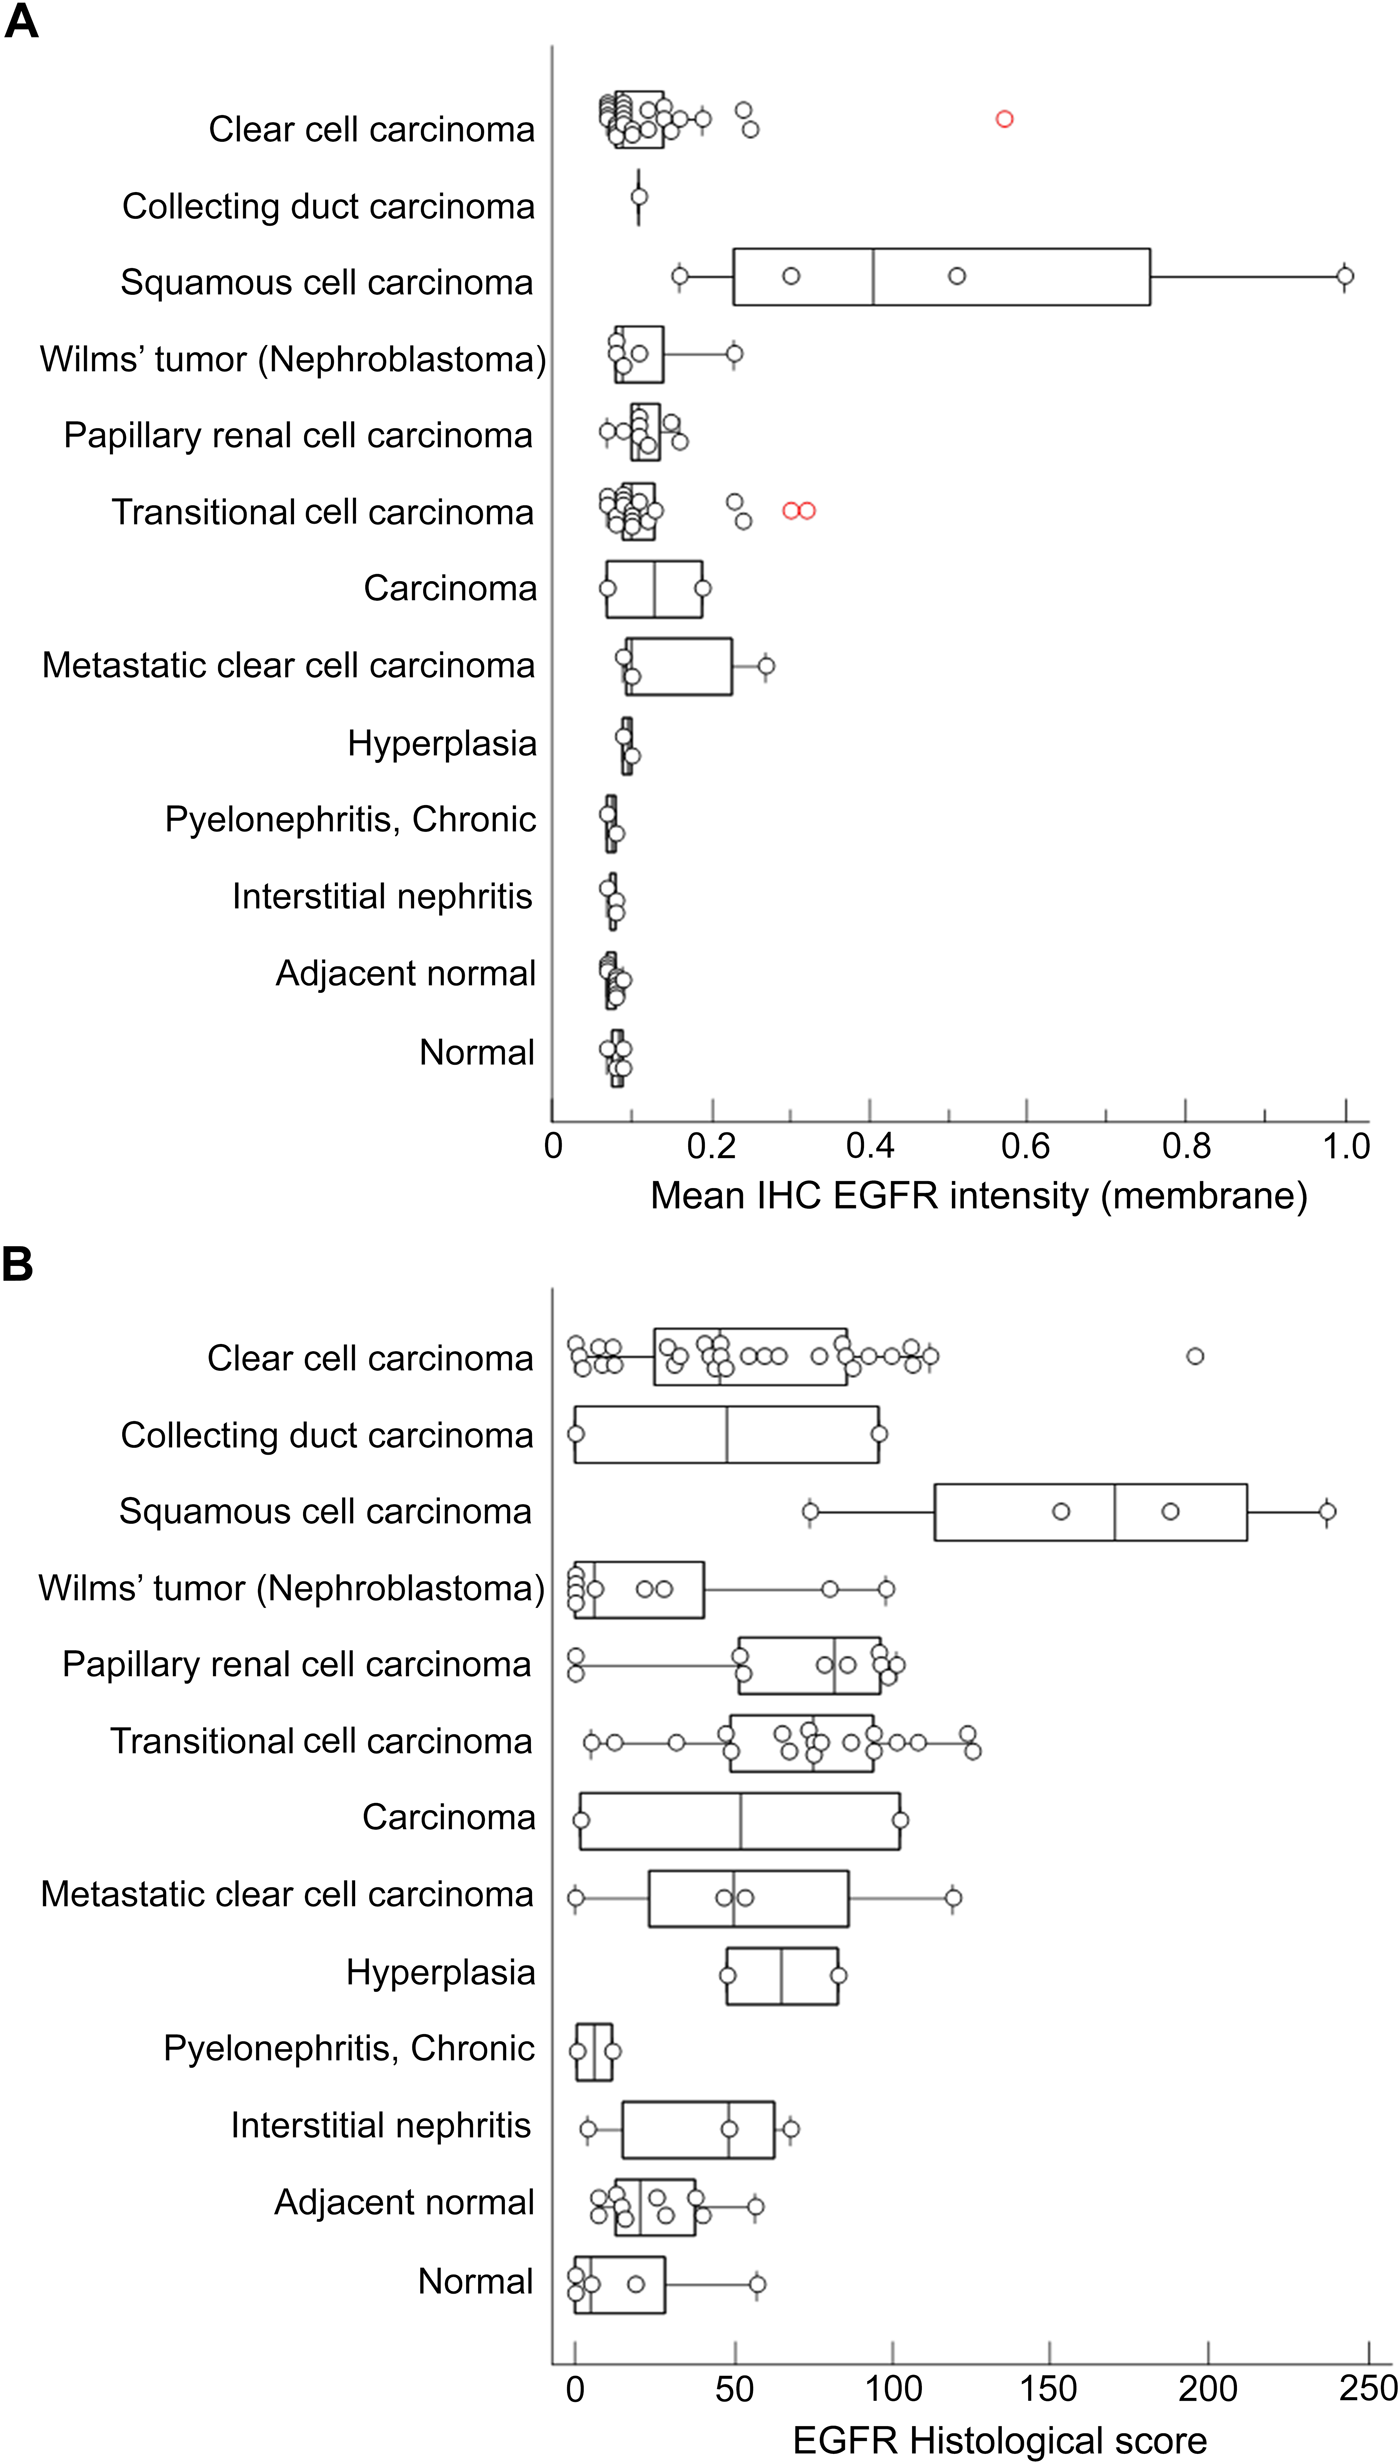
Analysis of epidermal growth factor receptor (EGFR) staining in tissue cores of tissue microarray (TMA) LS-SKICA31 (Lifespan Biosciences, Seattle, WA). Plots of the mean immunohistochemistry (IHC) EGFR intensity (membrane, A) and histological score (B) with respect to the diagnosis. Non-tumoral renal disease groups and normal kidney groups were grouped at the end of the charts. Data points represent the average value of two cores/patient. The median is indicated by the vertical line in the middle of the box, which represents the 25th and 75th percentiles. The error bars on the box indicate the range of the data.
Association of carboxypeptidase M and epidermal growth factor receptor staining with tumor grade and pathological tumor classification in renal cell carcinoma and other renal conditions
Using the Jonckheere–Terpstra non-parametric test, associations between the H-score and increasing tumor grade or pathological tumor classification (“T”-score of TNM classification) were analyzed (Table 4 and Fig. 8). When all diagnoses groups (with TNM classification and/or tumor gradation) were compared, an overall association between the H-score of EGFR and the tumor grade of the samples was found (p=0.009). Tumor samples with a higher tumor grade thus systematically possessed a higher EGFR H-score. This association was not observed for the CPM H-score. No overall association between the CPM or EGFR H-score and increasing pathological tumor classification of the specimens was detected (p>0.05). Within clear cell carcinoma specimens, the EGFR H-score was significantly associated with increasing tumor grade (p=0.027), whereas within transitional cell carcinoma samples, a significant association between the EGFR H-score and increasing pathological tumor classification (p=0.022) or tumor grade (p=0.046) was detected. A significant association between the CPM H-score and increasing tumor grade was only seen within the clear cell carcinoma group (p=0.022). An association between the CPM or EGFR H-scores and the pathological lymph node status or clinical metastasis classification (“N”- and “M”-score of TNM classification) could not be determined because almost all cases were N0 and M0.
Associations of EGFR H-Score or CPM H-Score with Increasing Pathological Tumor Classification (T) and Tumor Grade in Renal Cell Carcinoma
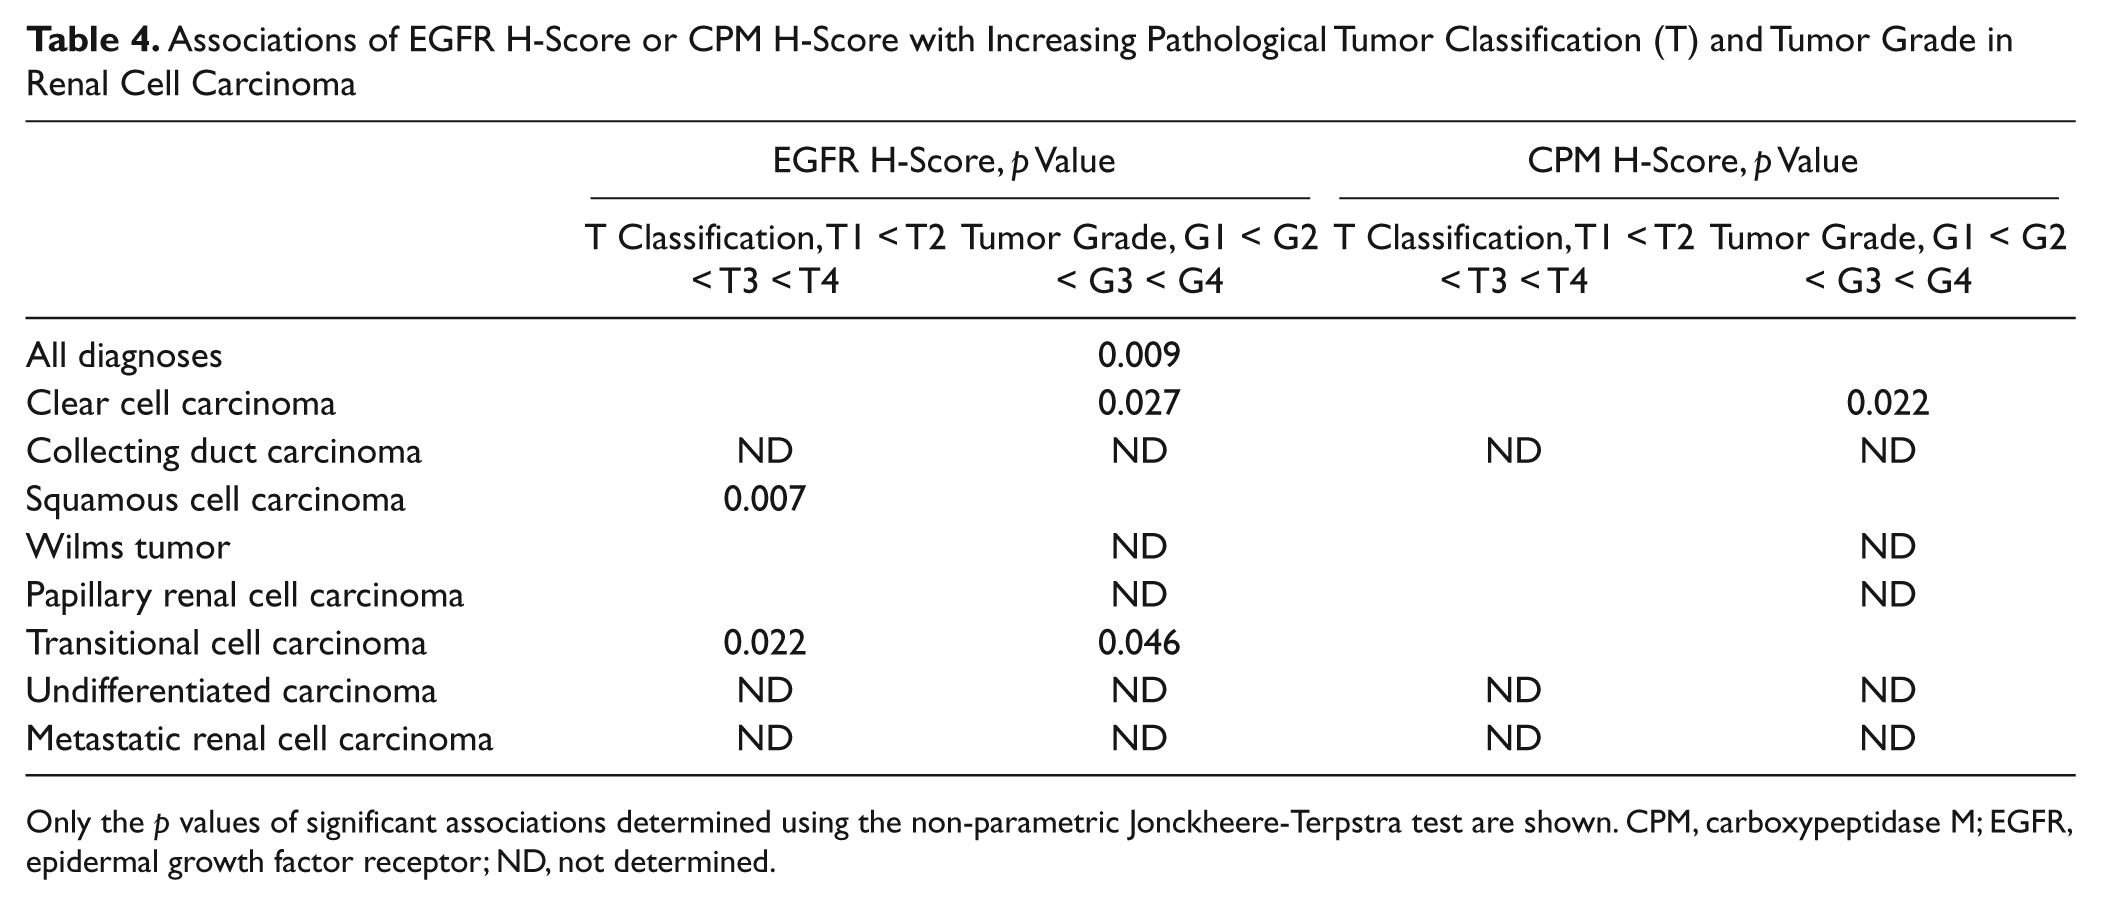
Only the p values of significant associations determined using the non-parametric Jonckheere-Terpstra test are shown. CPM, carboxypeptidase M; EGFR, epidermal growth factor receptor; ND, not determined.
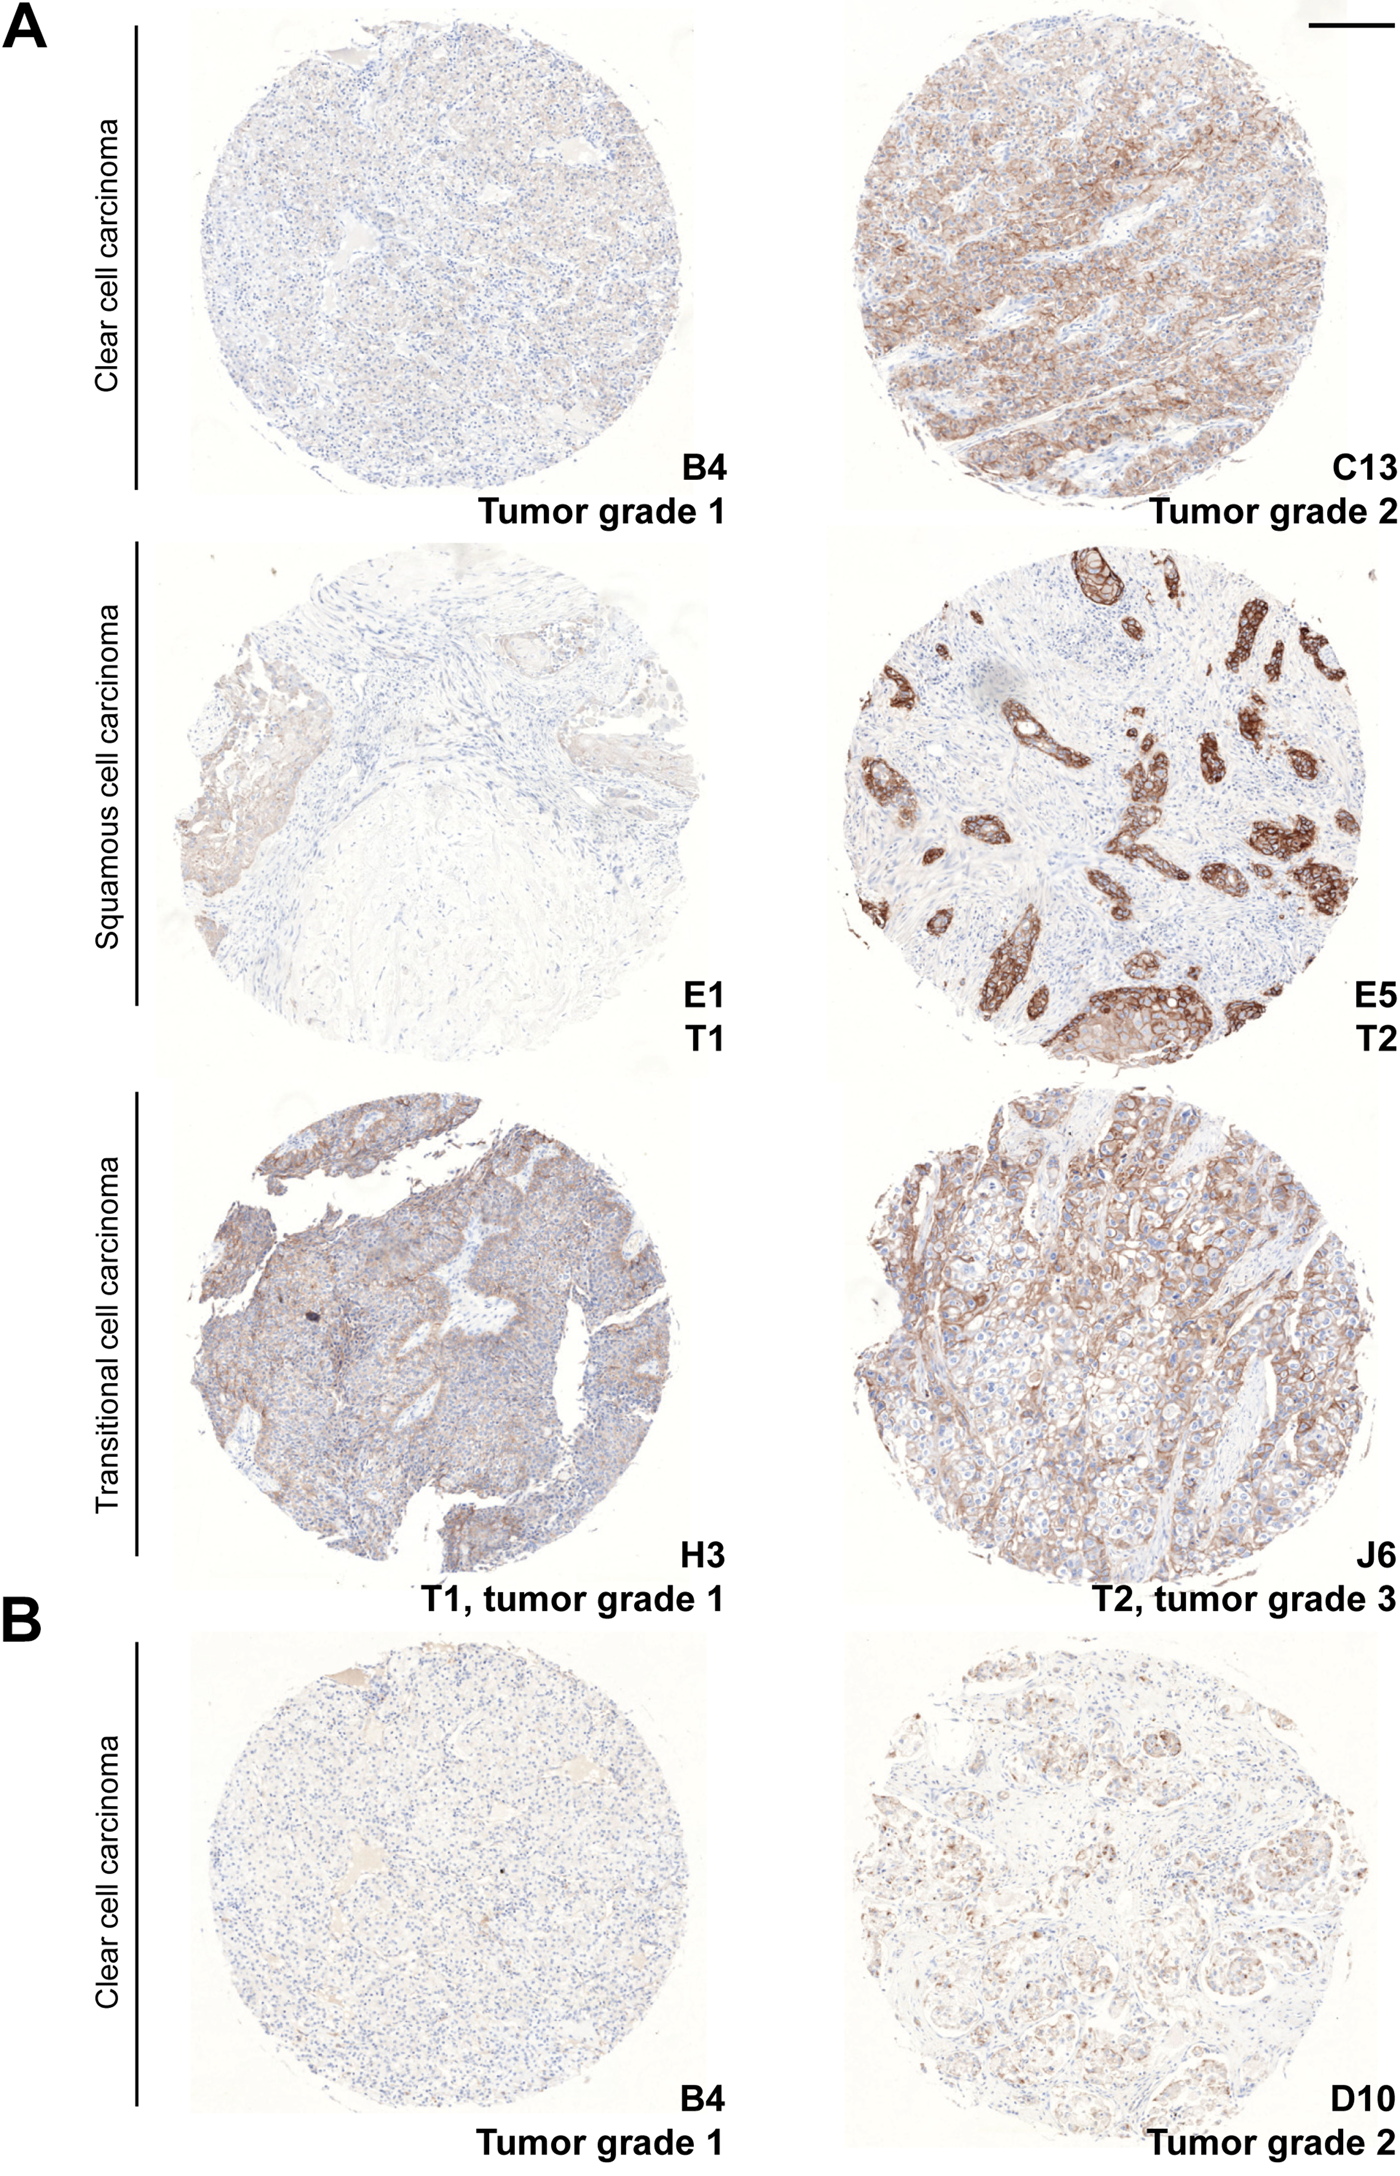
Association of epidermal growth factor receptor (EGFR) and carboxypeptidase M (CPM) staining with tumor grade or pathological tumor classification (T). (A) EGFR-stained cores. (B) CPM-stained cores. The TMA core coordinates, the tumor grade, and/or pathological tumor classification are indicated at the lower right of each core. The diagnosis of the cores is indicated on the left. Scale bar size = 200 µm.
Carboxypeptidase M and epidermal growth factor receptor are simultaneously expressed in papillary renal cell carcinoma but possess divergent subcellular localizations
An overall correlation between the H-scores of the EGFR and the CPM stainings did not exist (Pearson correlation coefficient r = −0.1044, p=0.142). However, a more detailed representation of the H-scores of both stainings illustrates the existence of some subpopulations in the whole cluster of data. Therefore, cluster analysis was performed using the H-scores for CPM and EGFR (cf. the Materials and Methods section). The number of clusters was set to four (Table 5). Table 6 shows a cross-tabulation of the new diagnosis groups (cf. the Materials and Methods section) versus the clusters. Figure 9 depicts the scatter diagram of the EGFR H-score plotted against the CPM H-score. The results demonstrate that normal or adjacent tissues were mainly found in cluster 4 (high CPM/low EGFR), with a few exceptions in cluster 3. The cores with normal or adjacent normal tissue were almost negative for EGFR staining, whereas they did have a weak CPM staining (illustrated in Fig. 9, black circle). In nearly all tumor types, the CPM staining was less than that in normal tissue (cluster 1 or 2), whereas the EGFR staining was negative, weak, or moderately strong. Only one tumor group (i.e., the papillary RCC group) contained both, although weak (50 < H-score < 100), CPM and EGFR staining (Fig. 9, green circle). Papillary RCCs were found only in clusters 3 and 4 (Table 6). Clear cell carcinoma was mostly, but not exclusively, found in clusters 1 and 2. Hence, three subpopulations could be discerned in the scatter diagram of the EGFR and CPM H-scores: normal tissue, papillary RCC, and all other tumors (Fig. 9). Another subpopulation might be that of the squamous cell tumors. These tumor cells have a high EGFR expression and a low CPM expression (cluster 1) (Fig. 9, blue circle).
Cluster Definition for Statistical Analysis of H-Scores of CPM and EGFR TMA Stainings
CPM, carboxypeptidase M; EGFR, epidermal growth factor receptor.
Cross-tabulation of the New Diagnoses Groups vs. the Clusters
The number of cores lying in cluster 1, 2, 3, or 4 is indicated for each diagnosis group.
Scatter diagram of carboxypeptidase M (CPM) and epidermal growth factor receptor (EGFR) H-scores obtained from tissue microarray (TMA) staining analysis. Each core of TMA LS-SKICA31 was attributed a CPM and an EGFR H-score according to the immunohistochemical staining results obtained for both proteins. Legend (upper right corner): observations made for normal or adjacent normal kidney tissue (black dots), clear cell carcinoma (red dots), papillary renal cell carcinoma (green dots), squamous cell carcinoma (dark blue dots), transitional cell carcinoma (light blue dots), metastatic renal cell carcinoma (purple dots), and other renal conditions (yellow dots). Subpopulations discerned after cluster analysis of the data are indicated with a circle (black, normal or normal adjacent; green, papillary RCC; blue, squamous cell carcinoma). RCC, renal cell carcinoma.
The subcellular localizations of CPM and EGFR in papillary renal cell carcinoma were determined using the high-end object-based image analysis program Tissue Studio 2.0, as defined in the Materials and Methods section. This analysis classified the CPM staining as cytoplasmic, whereas EGFR was detected at the cell membrane. Visual inspection of the core stainings confirmed this localization pattern.
Discussion
Although the kidney has generally been accepted as an important source of CPM, data regarding the expression of CPM in this organ are limited and scattered in the literature. However, a detailed insight into the localization of CPM (or any other protein) in the kidney is a prerequisite for the elucidation of its renal-associated function(s). Moreover, the knowledge of CPM expression in healthy tissue enables a comparison to be made with expression data obtained in diseased tissue and can lead to hypotheses regarding the implication of CPM in disease-specific processes.
Previously, Skidgel et al. purified CPM from human urine and suggested the kidney as the source for urinary CPM (Skidgel, Davis, and Erdos 1984; Skidgel, Johnson, and Erdos 1984). The results of this study demonstrate the broad distribution of CPM along the various tubular structures of the nephron in the normal kidney. The very intense staining observed for CPM at the apical surface of the proximal tubuli, distal tubuli, and thick ascending limbs of the loop of Henle is synonymous with an extensive and high membrane-bound presence of CPM at these sites. Although less pronounced, basolateral CPM presence was also detected in TECs. The apical localization positions CPM particularly well for the enzymatic processing of substrates present in the luminal fluid. Apparent luminal CPM positivity was present in these tubular structures, providing additional proof for the existence of the soluble form of CPM in the luminal fluid. Apart from the pronounced membrane-associated presence, TECs also showed cytoplasmic CPM staining (visualized more clearly in the immunohistochemical than the immunofluorescence stainings). Cytoplasmic CPM signals were independent of the antibodies used to detect CPM and the staining protocol, and were not present in negative control stainings. This could point toward CPM sorting to and trafficking (transcytosis) between the polarized sides of the TECs in vivo. A relatively non-polarized distribution of CPM was reported previously for MDCK cells (McGwire et al. 1999), which likely originate from distal TECs. However, McGwire et al. (1999) found higher CPM (immunoprecipitated) activity and protein levels at the apical MDCK cell domains. Based on the CPM mapping results in the normal kidney, CPM appears to cover a large part of the apical and basolateral surfaces of the different renal tubular structures, which is suggestive of a generalized function for CPM in kidney physiology.
The extensive presence of CPM at the glomerular parietal epithelium is reported here for the first time. Unfortunately, the precise physiological functions of glomerular parietal epithelial cells are poorly understood at this moment (Ohse et al. 2009), which makes it difficult to speculate about a possible role for CPM in these particular cells.
The immunoreactivity of MAX.1/MAX.11, which appear to be identical to CPM, was reported in 1988 in glomerular mesangial cells (Andreesen et al. 1988). The results of this study confirm the expression of CPM in intraglomerular mesangial cells in vivo. Thy1.1 (a mesangial antigen) staining experiments failed. Although presumably originating from extraglomerular mesangial cells, we could not explicitly identify the source of the CPM positivity immediately outside of the vascular pole of the glomeruli. Interestingly, mesangial cells are capable of phagocytosis and receptor-mediated endocytosis (Schlondorff and Banas 2009), properties that are shared by macrophages and adipocytes, which both express high levels of CPM (CPM presence in adipocytes: our unpublished observation). The presence of CPM on these “engulfing” cells might be indicative of a role in body defense and the elimination of aged or dead cells in tissues.
Finally, peritubular capillaries and interstitial cells of the normal kidney generally were CPM negative. In some immunohistochemical stainings, however, CPM immunoreactivity at vascular endothelial cells was very occasionally and locally detected. Because CPM appeared to be extensively present on tumor-associated vasculature, a beginning transformation of the “normal,” tumor-adjacent renal tissue (visualized by local tubular basolateral vimentin staining) could explain these sporadic vascular endothelial CPM signals.
The immunostainings for CPM in “normal” kidney were reproducible because we obtained very similar (if not identical) CPM staining patterns in whole tissue sections and TMA tissue cores. The reproducibility was further strengthened by the use of two immunohistochemical staining protocols (manual vs. automated), two commercially available anti-CPM antibodies targeting different epitopes in CPM, and the immunofluorescent co-localization studies. The two anti-CPM antibodies were able to detect recombinant, soluble human CPM at the expected protein size in Western blotting experiments (data not shown).
The pilot study regarding the expression of the CPM protein in RCC tissue specimens led to particular findings. Although normal TECs expressed high levels of CPM, an almost complete loss of the CPM protein was observed in malignant cells of the eight RCC tissue specimens. Likely, this loss of CPM reflects the loss of epithelial cell polarity and dedifferentiation occurring during malignant transformation. In tumor regions of patient 4, apical presence of CPM was detected at primitive tubules presumably. Because CPM is a well-known marker of many mature cells, the enzyme might just not be expressed on more immature stadia of the TECs. Interestingly, it was suggested that tumor suppressor pathways would favor the preservation of cell polarity, whereas activated oncogenic pathways would target and disrupt epithelial cell polarity to achieve malignant transformation (Royer and Lu 2011). CPM might represent such a polarity protein and might thus be downregulated by (an) oncogene(s). Whether polarity proteins themselves are tumor suppressors remains unanswered at present (Royer and Lu 2011).
The low presence or absence of CPM on tumor cells was confirmed in all tumor types investigated by TMA analysis, with the exception of papillary RCC. CPM expression was also diminished in hyperplasia (although not statistically evaluated). The physiological proliferation of cells often represents a preneoplastic sign. Since (pyelo)nephritis samples showed very similar CPM levels when compared with normal kidney, the loss of CPM expression appears to be tumor associated. As a marker associated with differentiation, loss of CPM could indicate or contribute to the disordered cellular differentiation occurring in cancer. Noteworthy, higher CPM staining was detected in clear cell carcinoma samples with a higher tumor grade (grade 2 vs. grade 1). In this type of RCC, the expression of CPM might thus be upregulated along with tumoral dedifferentiation.
In some tumoral tissue cores of clear cell RCC, papillary RCC, transitional cell carcinoma, and metastatic tumors, cytoplasmic CPM dots were observed, as well as possible CPM staining at the Golgi apparatus. The biological significance of this unusual CPM localization pattern is not clear at the moment.
Indubitably, CPM represents an excellent marker of active, foamy macrophages in RCC tissue and is a part of the tumoral inflammatory environment. Tsakiris et al. (2012) very recently described a consistent expression of CPM in lipid-laden tissue macrophages, including foamy macrophages of early atherosclerotic plaques, and TAMs in invasive ductal carcinoma and seminoma when related to cell destruction and subsequent lipid uptake. Comparable to our observations, CD68 (and CD163) antibodies appeared to stain other tissue macrophages besides the lipid-laden ones as compared with the CPM antibodies (Tsakiris et al. 2012). The authors suggested that CPM could promote foam cell formation by acting in the lipid regulation process of macrophages. Also suggested by Tsakiris et al., possible involvement of CPM in macrophage lipid regulation probably would occur via the processing of peptides (directly or indirectly) implicated in lipid uptake/influx. Elevated levels of CPM on TAMs were reported earlier in lung adenocarcinoma, necrotic areas of cerebral gliomas after irradiation, and in a case of clear cell RCC with an atypical, sarcoid-like granulomatous reaction (Kovacs et al. 2004; Julow et al. 2007a, 2007b; Tsakiris et al. 2008). Because TAMs accumulate into (tumoral) necrotic core regions, CPM might be implicated in the process of necrotic debris removal (Julow et al. 2007a). TAMs are believed to play a dual role in tumor proliferation, progression, and metastatic spread (i.e., pro- and antitumoral activities) (Mantovani et al. 2008; Sica et al. 2008). Whether CPM is involved in the “good” or the “bad” side of TAMs should be addressed in future studies.
To the best of our knowledge, this study is the first to report the expression of CPM in tumor-associated neovasculature. Because CPM appeared as good as absent on normal renal vasculature (interstitial and glomerular), this finding certainly warrants further investigation in the context of tumor-specific angiogenesis target finding. Angiogenesis has proven to be a valuable prognostic factor in various malignancies. The neovascular expression of CPM might be related to higher tumor stages and a worse prognosis. Because resistance to angiogenesis inhibitors in RCC often develops over time, the identification of new angiogenesis markers remains crucial (Tamaskar et al. 2011).
Multiple publications describe an overexpression of EGFR in RCC, ranging from 40% to 80% (Eble et al. 2004; Ravaud et al. 2007). Yoshida et al. (1994) reported an increased EGFR content in RCC compared with normal kidney and found significantly higher EGFR expression in RCCs with higher nuclear grades. Comparable to these results, lower EGFR contents were detected in this study in normal kidney when compared with RCC tissue. Although another tumor grading system was used here, a significant association between EGFR expression and increasing RCC tumor grade was also detected. In this study, squamous cell carcinoma specimens showed particularly elevated EGFR levels. EGFR overexpression has been reported for numerous other carcinoma types with squamous cell histology, including head and neck cancer and non-small cell lung cancer that are currently treated with EGFR antagonists among other medication (Kamath and Buolamwini 2006; Ciardiello and Tortora 2008). Analogously to the study by Tsakiris et al. (2012) in lung adenocarcinoma, coexpression of CPM and EGFR was analyzed in RCC. Cluster analysis of CPM and EGFR H-scores revealed coexistence only in one tumor group (i.e., papillary RCC). However, CPM staining often was observed in the cytoplasm of tumor cells and possibly at the Golgi apparatus, whereas EGFR showed a predominant membranous staining in tumor cells. This makes the interaction between both proteins difficult. Occasionally, CPM was detected at the EGFR+ tumor cell membrane in papillary RCC.
Overall, the detailed mapping of CPM in normal human kidney presented in this study forms a valuable foundation for the generation of new strategies regarding the role of CPM in kidney physiology. The observations made with respect to the expression of CPM in RCC hint to a loss of the enzyme in all renal tumor types analyzed except for papillary RCC. The (extensive) presence of CPM in the RCC neovasculature and its absence in normal renal vasculature opens exciting possibilities regarding the identification of a specific tumor angiogenic marker and subsequent targeting in anticancer therapy. The consistent, elevated expression of CPM on lipid-laden macrophages reported in this study and recent publications definitely merits further investigation.
Footnotes
Acknowledgements
We thank Professor P. d’Haese, Dr. A. De Beuf, and Dr. A. Verhulst and S. Dauwe (Laboratory of Pathophysiology, University of Antwerp) for the optimization of the initial manual immunohistochemical CPM stainings.
Declaration of Conflicting Interests
The authors declared no potential conflicts of interest with respect to the research, authorship, and/or publication of this article.
Funding
The authors received no financial support for the research, authorship, and/or publication of this article. C. J. Denis was a doctoral fellow of the Flanders Science Foundation (FWO-Vlaanderen).
References
Supplementary Material
Please find the following supplemental material available below.
For Open Access articles published under a Creative Commons License, all supplemental material carries the same license as the article it is associated with.
For non-Open Access articles published, all supplemental material carries a non-exclusive license, and permission requests for re-use of supplemental material or any part of supplemental material shall be sent directly to the copyright owner as specified in the copyright notice associated with the article.