
Abstract
Hemochromatosis is an inherited defect in Salers cattle, characterized by increased iron absorption and wasting in young animals. Loss of teeth and soft bones has been reported. This study details bone changes in a prospective study of an affected Salers heifer and an age-matched, half-sibling control. The heifer fell 2 weeks before euthanasia, developed non-weight bearing lameness, and then became recumbent. At necropsy, the heifer was smaller than the control and had fractures of the humerus, femur, and ribs. Distinctive circumferential laminations in the outer third of the cortex were seen radiographically as layers of variably decreased density. In midshaft cross sections, the cortex was wider in some long bones, and fluorescent labeling revealed irregular and intermittent mineralization in the outer cortical layers. Mineral apposition rates in osteons of the inner cortex were decreased as compared with the control, and longitudinal bone formation at the growth plate was markedly decreased. Histologically, there were buried layers of osteopenic, poorly mineralized plexiform bone in outer circumferential lamellae. There was stainable iron in woven bone cores of the matrix. Iron was found in occasional osteoclasts as well. The mandible was severely affected, with loss of cortical bone as well as trabecular bone around the teeth and resorption of dental roots. Bone analysis revealed iron levels in the affected calf that were 30–50 times greater than the control and decreased percent ash in the outer cortex. These results indicate that periosteal dysplasia and osteopenia are responsible for pathologic fractures and tooth loss.
Keywords
Introduction
Hemochromatosis is an uncommon inherited defect in Salers cattle, characterized by increased iron absorption, elevated transferrin saturation, and iron deposition in the liver and other organs. 16,20 Clinically, there is an extended clinically silent period (6–12 months), followed by a wasting syndrome associated with hepatic failure. The condition has similarities to human hemochromatosis, which is associated with mutations of the gene for HFE. 11 This is a protein that complexes with transferrin, and mutations are thought to allow increased iron uptake and storage in parenchymal cells. Loss of incisors and soft bones has been reported in some cattle with hemochromatosis, 16,20 but bone lesions have not been studied in detail.
The objective of this study was to describe the bone changes in a prospective study of an affected Salers heifer in the early stages of disease, using an unaffected half-sibling as a control.
Materials and Methods
A hemochromatosis-affected heifer (heifer No. 1) from a breeding colony of Salers maintained at the Wyoming State Veterinary Laboratory was identified and monitored from weaning until euthanasia at 18 months of age. The diagnosis of hemochromatosis was made by taking transcutaneous liver biopsies of the animals at 40, 125, and 150 days of age. Hepatic iron concentrations in the affected calf were 693, 1,467, and 2,076 µg/g wet weights, respectively (reference concentration: < 300 µg/g). Transferrin saturation increased during the first 6 months of life as follows: 68.3% (55 days), 95.5% (70 days), 87.4% (92 days), and 92.9% (148 days) (reference concentration: < 60%). Histologic evidence of iron accumulation in hepatocytes was present at 40 days of age, with progressive accumulation during the following 16 months. By 1 year of age, the heifer failed to gain weight as quickly as other animals. For comparison, an unaffected, age-matched half-sibling Salers heifer (heifer No. 2) was selected for necropsy at the same time as a control. These animals were kept in the same environment and received the same diet. Heifer No. 1 had a minor fall 2 weeks before euthanasia and developed an acute non–weight bearing lameness of the right forelimb. The animal became recumbent, and although the animal was made comfortable and continued to eat, it lost weight rapidly. Before necropsy, the two animals were injected with oxytetracycline (20 mg/kg, IV) 5 and 12 days before euthanasia to provide a fluorescent label of bone formation. Samples from both animals were collected and compared using gross findings, radiographic and morphometric evaluation, bone mineral analysis, and histopathology to determine skeletal changes.
Radiography
Routine radiographs were taken of fractures in the affected heifer and the mandibles of both control and affected animals. From long bones of both animals, midshaft cross sections of the femur, humerus, metacarpal, and metatarsal bones were ground to 4 mm thickness, and contact radiographs were taken in a radiographic cabinet (Faxitron, Rochester, NY) using mammography film. In addition, the following samples from both animals were similarly ground and radiographed: midrib cross sections and longitudinal sections at the costochondral junction from the right ninth rib, transverse sections through the right mandible at premolar 3 (PM3) and through the right maxilla at premolar 5 (PM5), and longitudinal sections through the right medial incisor.
Morphometry and fluorescent label studies
The same 4-mm-thick ground sections used for radiography were photographed under ultraviolet illumination to identify fluochrome labels, digitized, and evaluated in an image analysis program (Metamorph, Universal Imaging, Downington, PA). In cortical bone cross sections, periosteal (Ps) and endocortical (Ec) perimeters (Pm, mm) were measured and the proportion of surface with label determined (%LS). The cortical area was expressed as percent total cross-sectional area (C.Ar/Tt.Ar, %). The average cortical width was calculated from the differences in the diameters calculated by dividing the Ps and Ec perimeters by Π = 2.14 (PsPm/2.14 – EcPm/2.14). Fluorescent labels were also studied in 120-µm-thick ground sections. Bone sections were surface embedded in rapid-setting plastic (Sampl-Kwick, Buehler Ltd., Evanston IL) and ground with 300- to 600-grit wet-dry sandpaper to 120 µm thickness. Samples used were cross sections of the right femur and left metacarpus and longitudinal sections through the costochondral junction of the right ninth rib and growth plates of the proximal tibia and femur. Four equidistant lines were drawn across quadrants of the cross sections, and the number of labeled haversian systems (N.On/Ct.Ar, #/mm2) were counted in fields adjacent to each of the lines. These represented secondary osteons remodeling the inner cortex where more mature bone was present. The distance between double labels was measured and divided by the 7-day interval between labels to get the mineral apposition rate (MAR, µm/day), which is an index of cell-level bone formation. 12,22 In longitudinal sections through the growth plate, the distance between the linear labels across the mineralized cartilage and labeled cartilage in the metaphysis was similarly measured and longitudinal growth rate (LoGR) was expressed in micrometers per day.
Histopathology
Bone samples for routine histology were decalcified in 10% formic acid over resin beads, paraffin embedded, and sections were stained with hematoxylin and eosin (HE). Selected sections were stained with Masson's trichrome stain and Perls' iron stain. Perls' stain was also used on undecalcified, 120-µm-thick ground sections of selected bones.
Scanning electron microscopy
A palmarolateral corner of the right third metacarpal (Mc3) cortical cross section (approximately 1 × 2 cm) from affected and control animals was ground to 2 mm thickness and polished with up to 2,000-grit paper. After dehydration in alcohols, samples were placed in hexamethyldisilazane to replace alcohol to maintain structure. They were dried in a vacuum evaporator and examined on a Phillips SEM 505 scanning microscope fitted with a Kevex Quantum 8000 energy-dispersive spectroscopy (EDS) unit for mineral analysis. For spectroscopic analyses of areas of interest, a field size of 0.09 mm2 was scanned for 180 seconds, and the total counts of various elements at 1–10 keV were plotted. Elements selected for primary study were Ca, P, and Fe; Cu, F, and Al were also studied. EDS sampling was done in the outer cortex (within 1 mm of the periosteal surface) and the middle cortex (2 mm or more deep to the outer cortical site) in both animals. Additional sampling was done in the dense, more mature bone of the inner cortex (1–2 mm inside the endocortical surface). Relative values for calcium, phosphorus, and iron levels were expressed as total counts/sampling period. These were measured at the major peaks for Ca, P, and Fe (3.7, 2.0, and 6.4 keV, respectively) and the other elements.
Mineral analysis
A 1.5-cm-thick midshaft cross section of the dorsal femoral cortex from each animal was divided into inner cortex and outer cortex samples. The outer cortex samples were approximately the outer third of the cortex, where laminar discoloration could be seen in the hemochromatosis animal grossly. Samples were dried to constant weight and ashed to determine percent ash per dry weight. Ash was then analyzed using atomic absorption spectrophotometry to determine levels of iron, calcium, phosphorus, and other elements: copper, manganese, molybdenum, zinc, and fluoride. Hepatic iron concentrations in both animals were determined using inductively coupled plasma atomic mass spectroscopy as described previously. 20
Results
Gross findings
Heifer No. 1 had 70% of the skeletal stature of the unaffected half-sibling control heifer (heifer No. 2) and was in poorer body condition, with less muscle mass (body weights were 254 kg, affected; 368 kg, control). Incisors were loose in the affected heifer. No gross lesions were seen in the control. In heifer No. 1, there was a large “butterfly” fracture of the right humerus, with splitting and separation of large cortical segments from the middle and distal shaft. There was fibrous callus tissue around the fracture compatible with a 2-week duration. The left femur had an oblique transverse fracture of the proximal shaft with early fibrous callus tissue in the area judged to be of the same or somewhat shorter duration as the callus in the humeral fracture. Along the shaft of both humerus and femur, thin layers of light and dark tan bone were seen in the outer cortex beneath the periosteum. At the femoral fracture site, separation of the cortical layers was seen for 2–3 cm back from the fracture end. When the long bones and mandible of the affected calf were cross-sectioned, the distinctive circumferential light-dark laminations in the outer third of the cortex gave them an onionskin appearance. This change corresponded to areas of variable density on radiographs (Fig. 1) and was seen in sections of all long bones. In the frontal bone, the inner and outer plates were somewhat thickened and closer together. In the thorax, there were healed transverse fractures through the middle of the 10th and 11th ribs on the right side. On cut surface, these were well-united fractures with bony callus judged to be of at least 6-week duration. There was a 6- to 8-cm-long thickening of the 12th rib slightly more distally, which had longitudinal streaks on cut surface compatible with an incomplete or “green stick” fracture of the cortex. No changes were seen in sections through the vertebrae. In the joints, articular surfaces, synovial fluid, and membranes were grossly normal. The tendon of origin of the biceps was equivocally softer than that of the control. Comparable samples were saved for histology along with samples of meniscus and synovial membrane. The livers in both animals were comparable in size, but as percentage body weight, the liver was somewhat greater in the affected animal (5.9 and 4.5 kg; 2.3 and 1.2% body weight; heifer Nos. 1 and 2, respectively). The liver of the affected animal was uniformly dark brown with no detectable increase in consistency. There was a 3.3-m area of diffuse brown discoloration in the duodenal mucosa of the affected heifer that began immediately distal to the pyloric sphincter.
Radiograph of mandible; hemochromatosis heifer No. 1 and control heifer No. 2. Layers of variable density are seen along the cortical bone beneath the periosteal surface in the affected animal.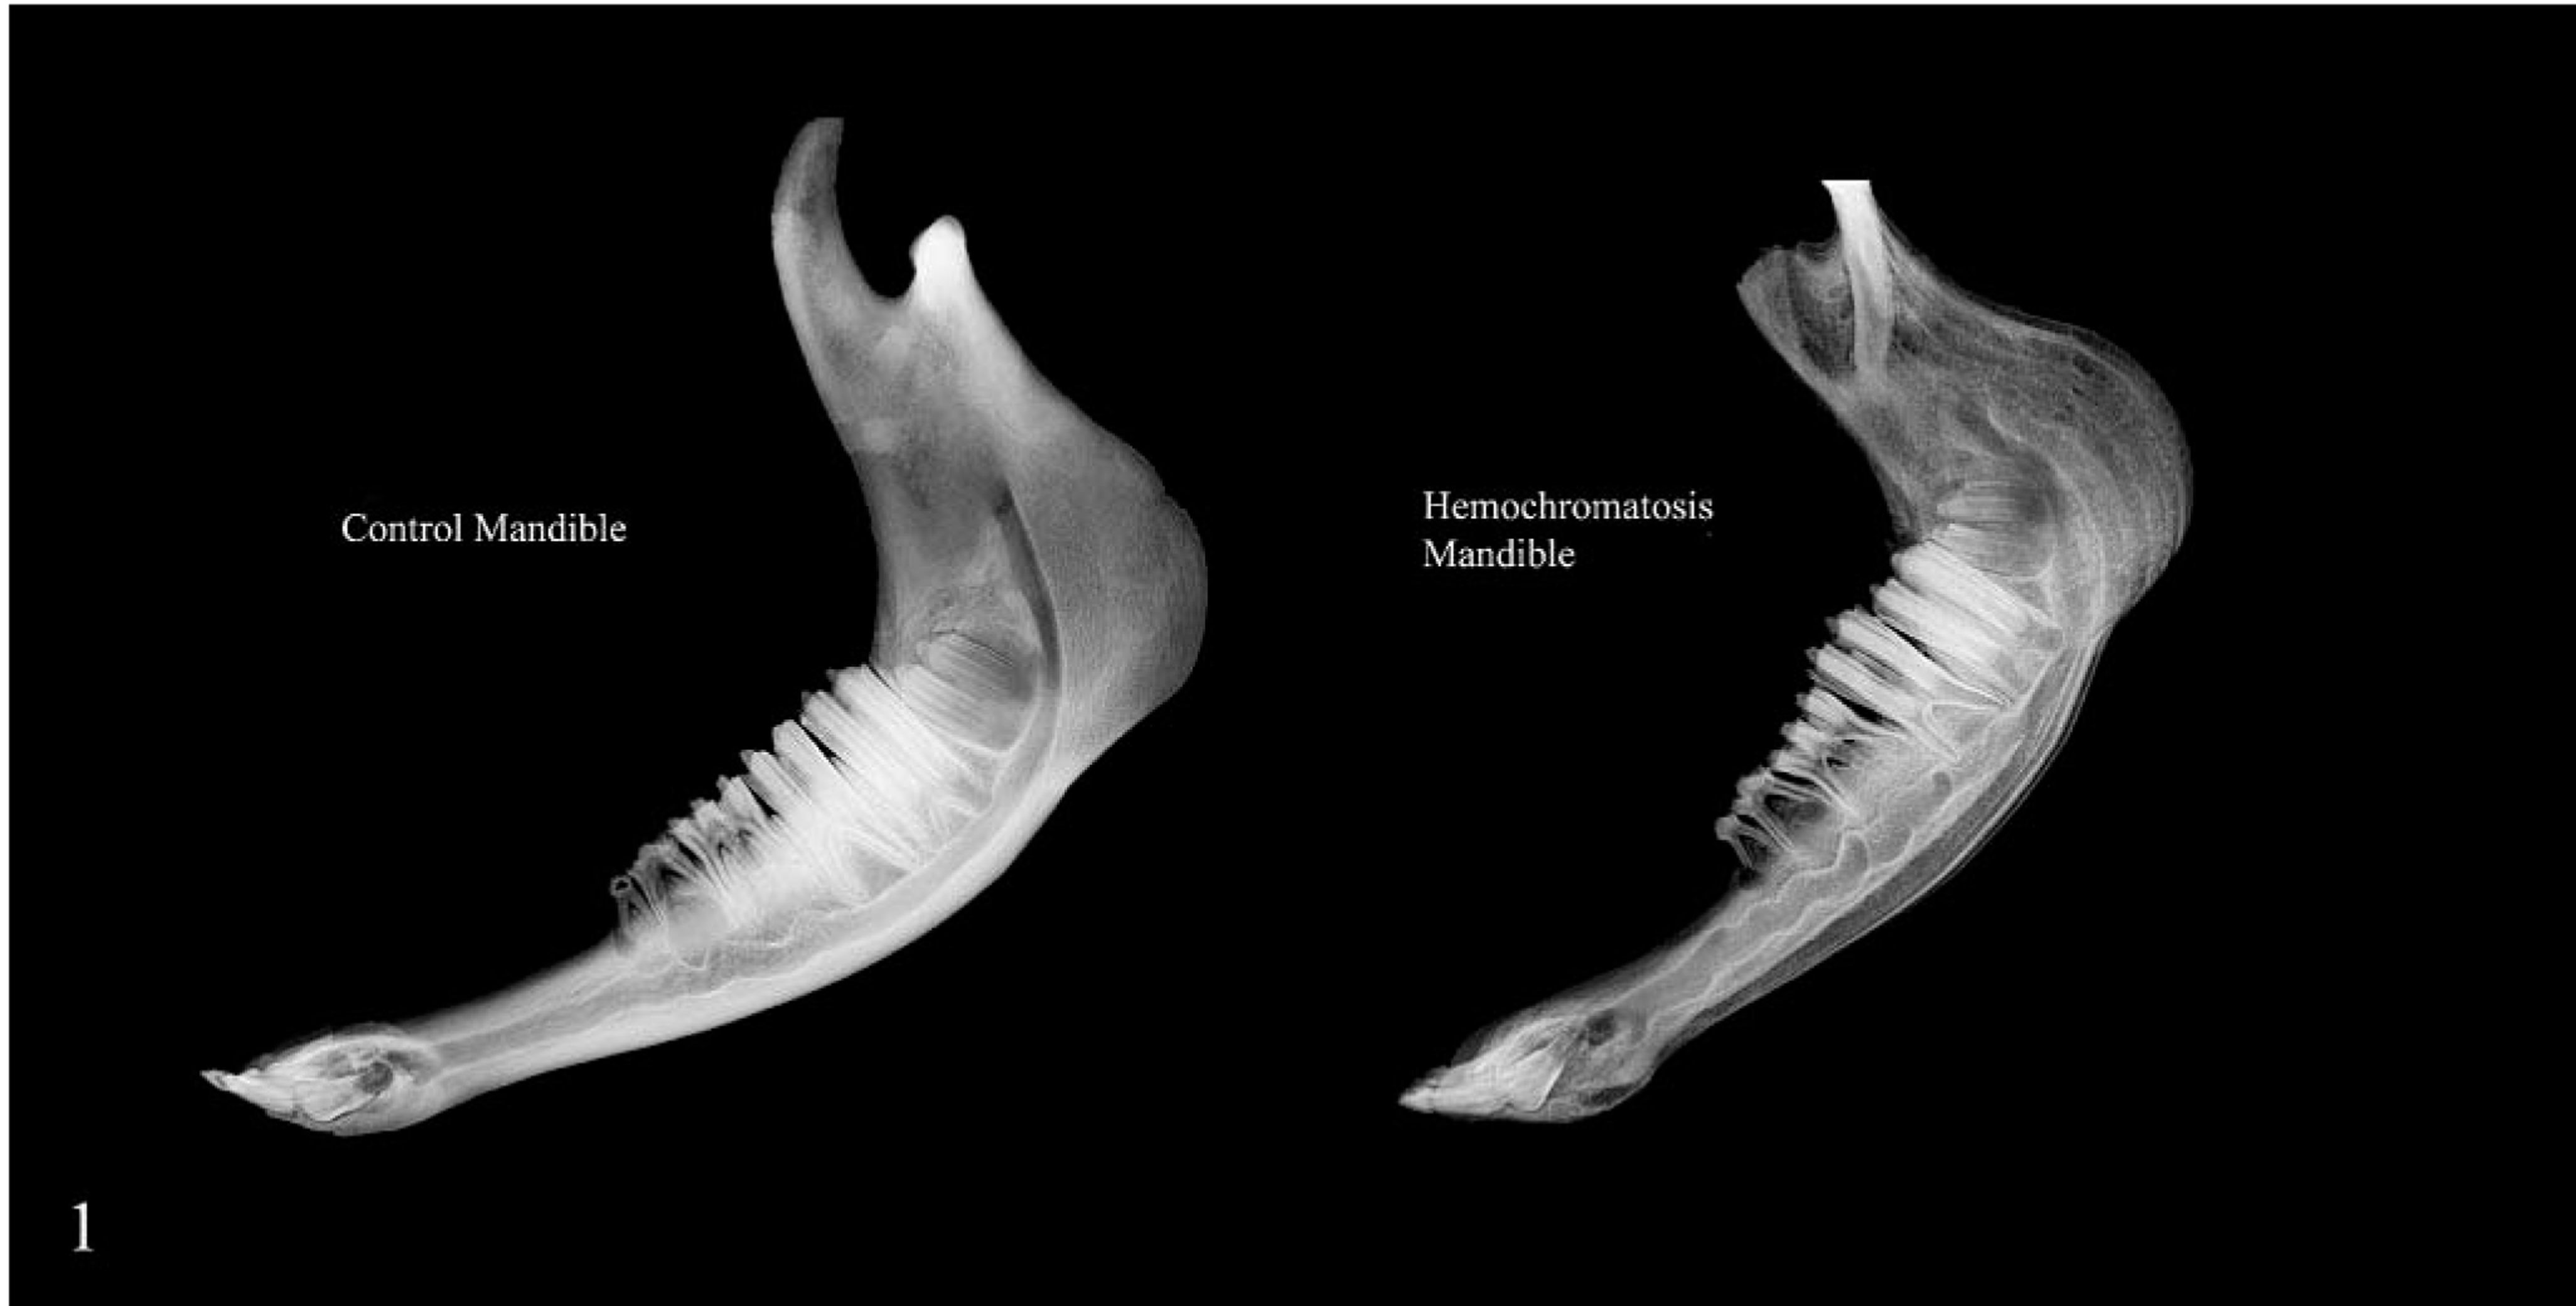
Contact radiograph of 4-mm-thick midshaft cross sections of femurs; control heifer No. 2 (A) and hemochromatosis heifer No. 1 (B). The control bone was larger, but the cortex of the hemochromatosis animal is thicker with layers of decreased density in the outer cortex and on the periosteal surface. Similar, less extensive change is seen on the endocortical surface.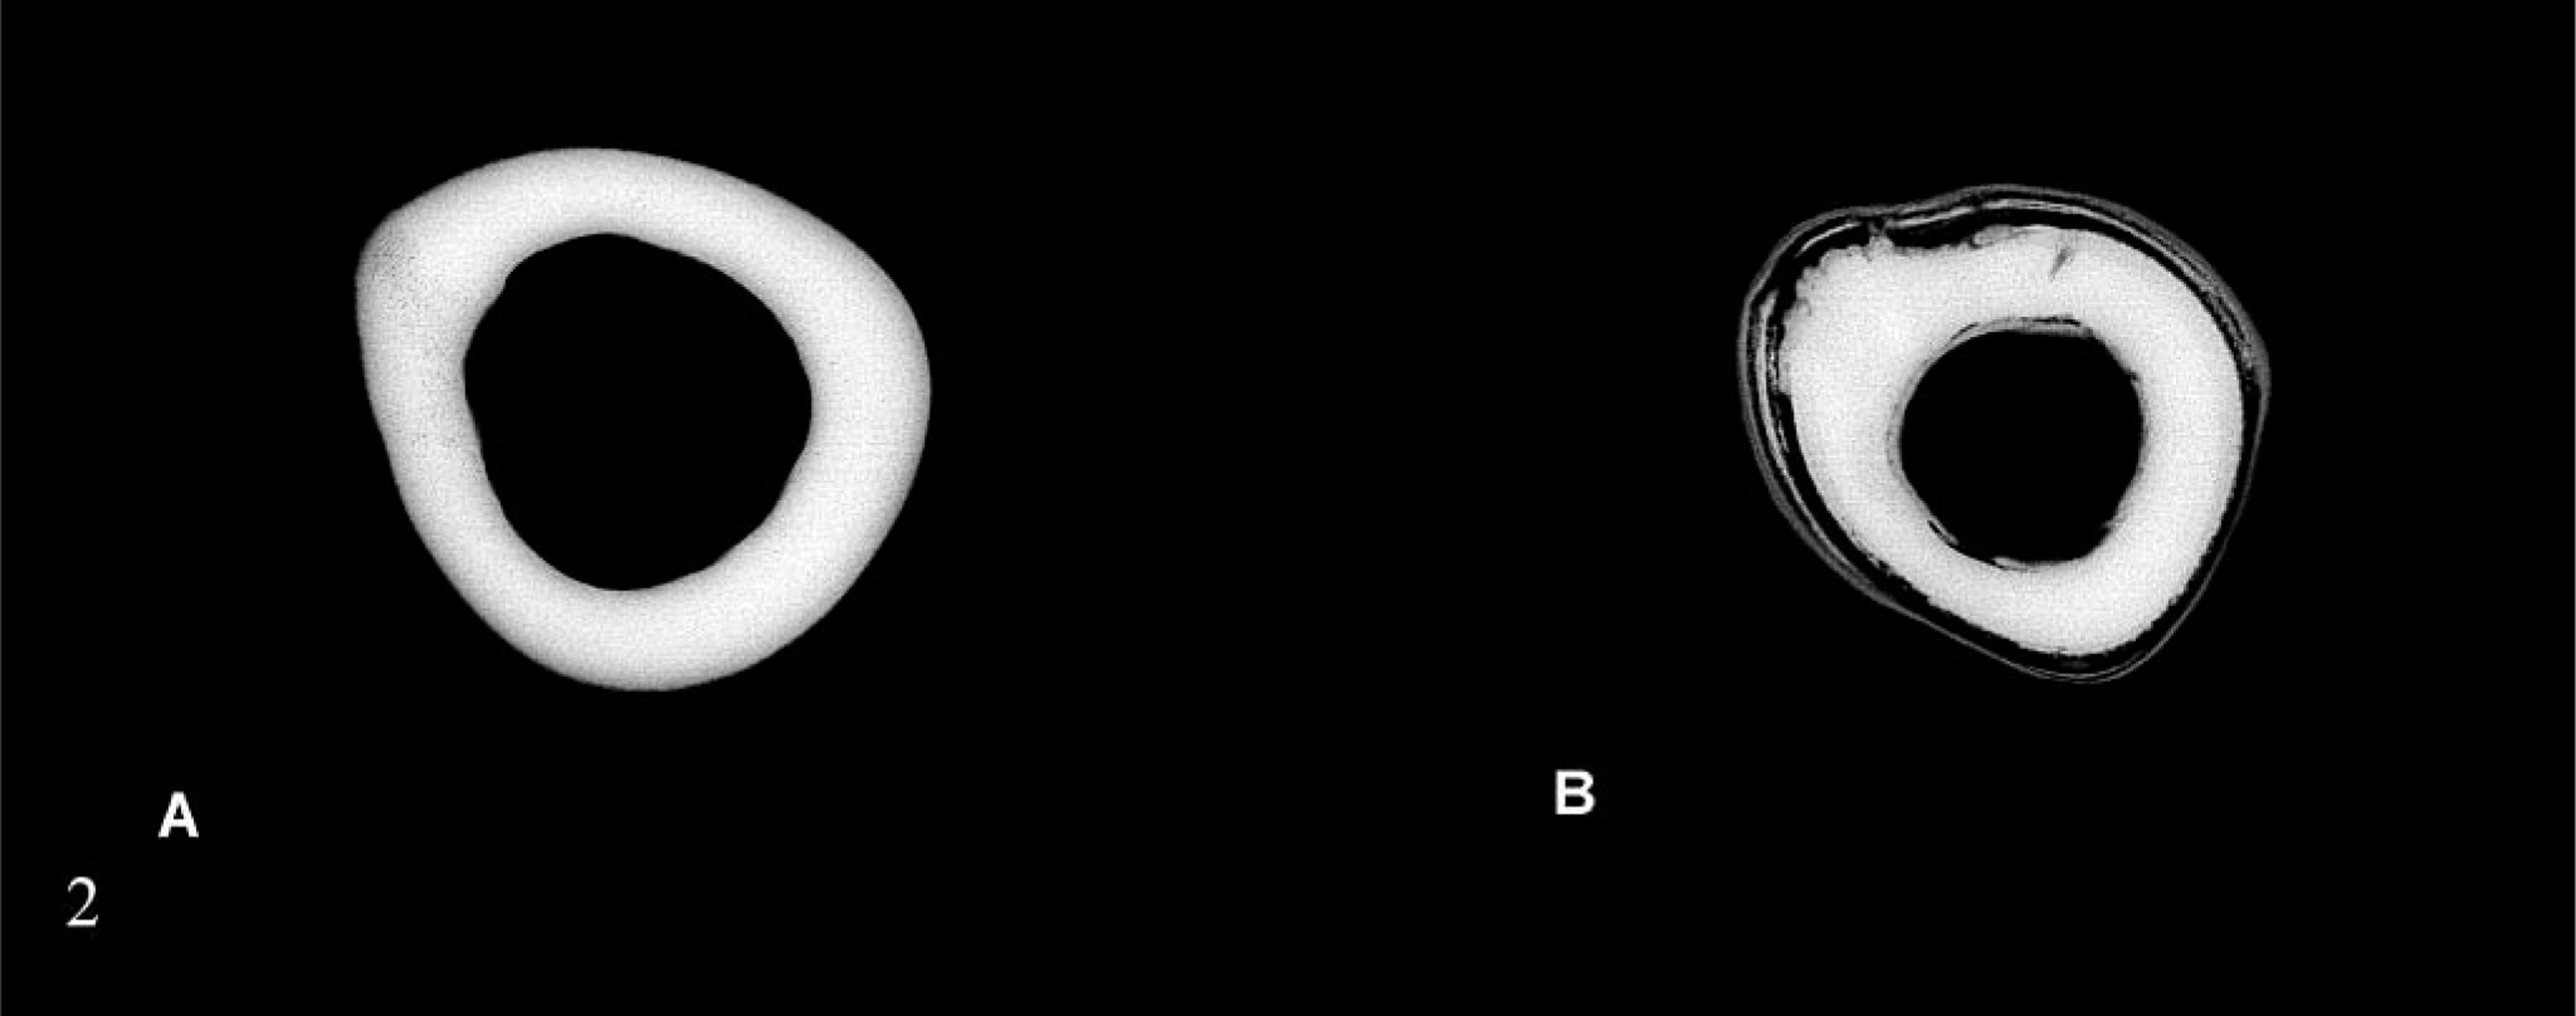
Radiography
In routine radiographs of long bones from heifer No. 1, there were layers of variable radiodensity in the outer third of the cortex that corresponded to the light-dark laminations seen grossly (Fig. 1). This change was more prominent in the mandible, where more faint laminations were present in the deeper bone. There was also rarefaction of the cortex as well as alveolar bone and decreased definition or loss of the lamina dura dentes at the alveolar margin (Figs. 3, 4). In radiographs that included the middle incisor, partial resorption of the root was present only in heifer No. 1.
Contact radiograph of 4-mm-thick cross section of mandible at level of third premolar; control heifer No. 2. Cortex is uniformly dense, and there is abundant alveolar bone and a well-defined lamina dura dentes (arrowheads) around the tooth root.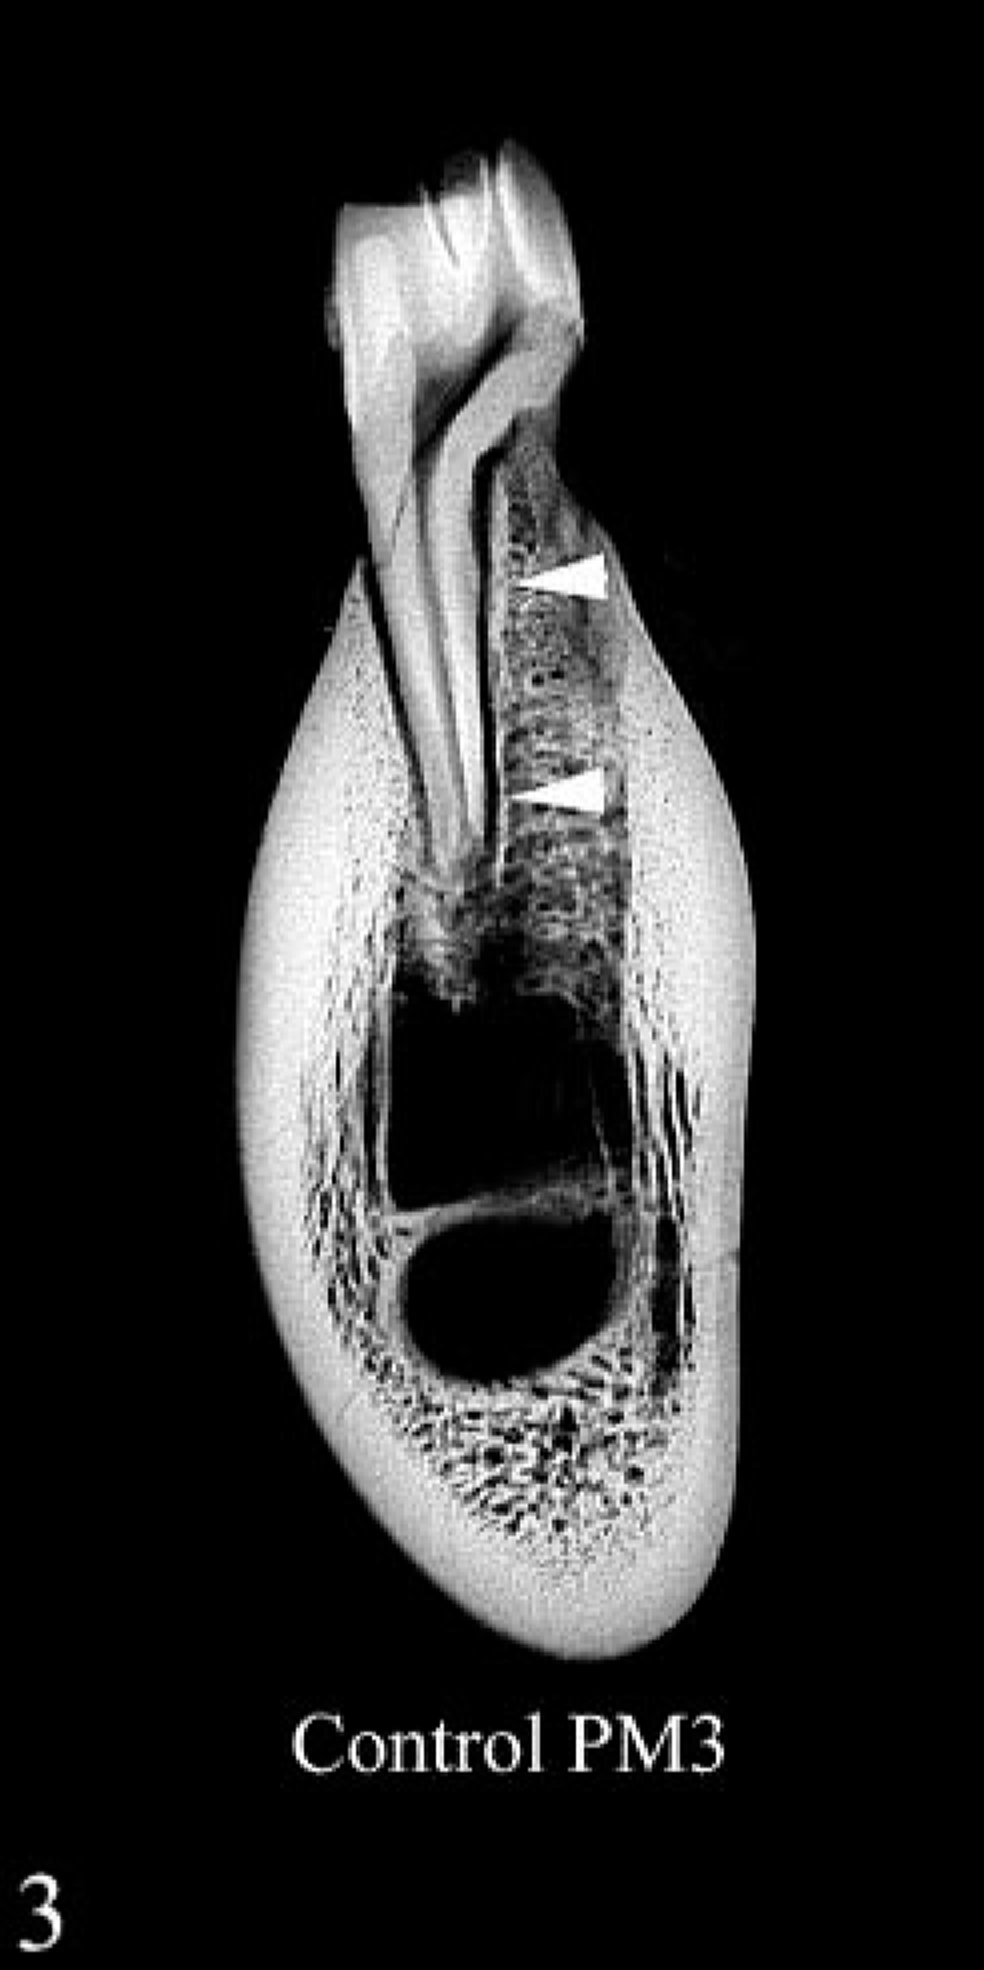
Contact radiograph of 4-mm-thick cross section of mandible at level of third premolar; hemochromatosis heifer No. 1. Layers of decreased density and increased porosity are seen in the cortex, and there is rarefaction of alveolar bone and lamina dura dentes (arrowheads) around the tooth root.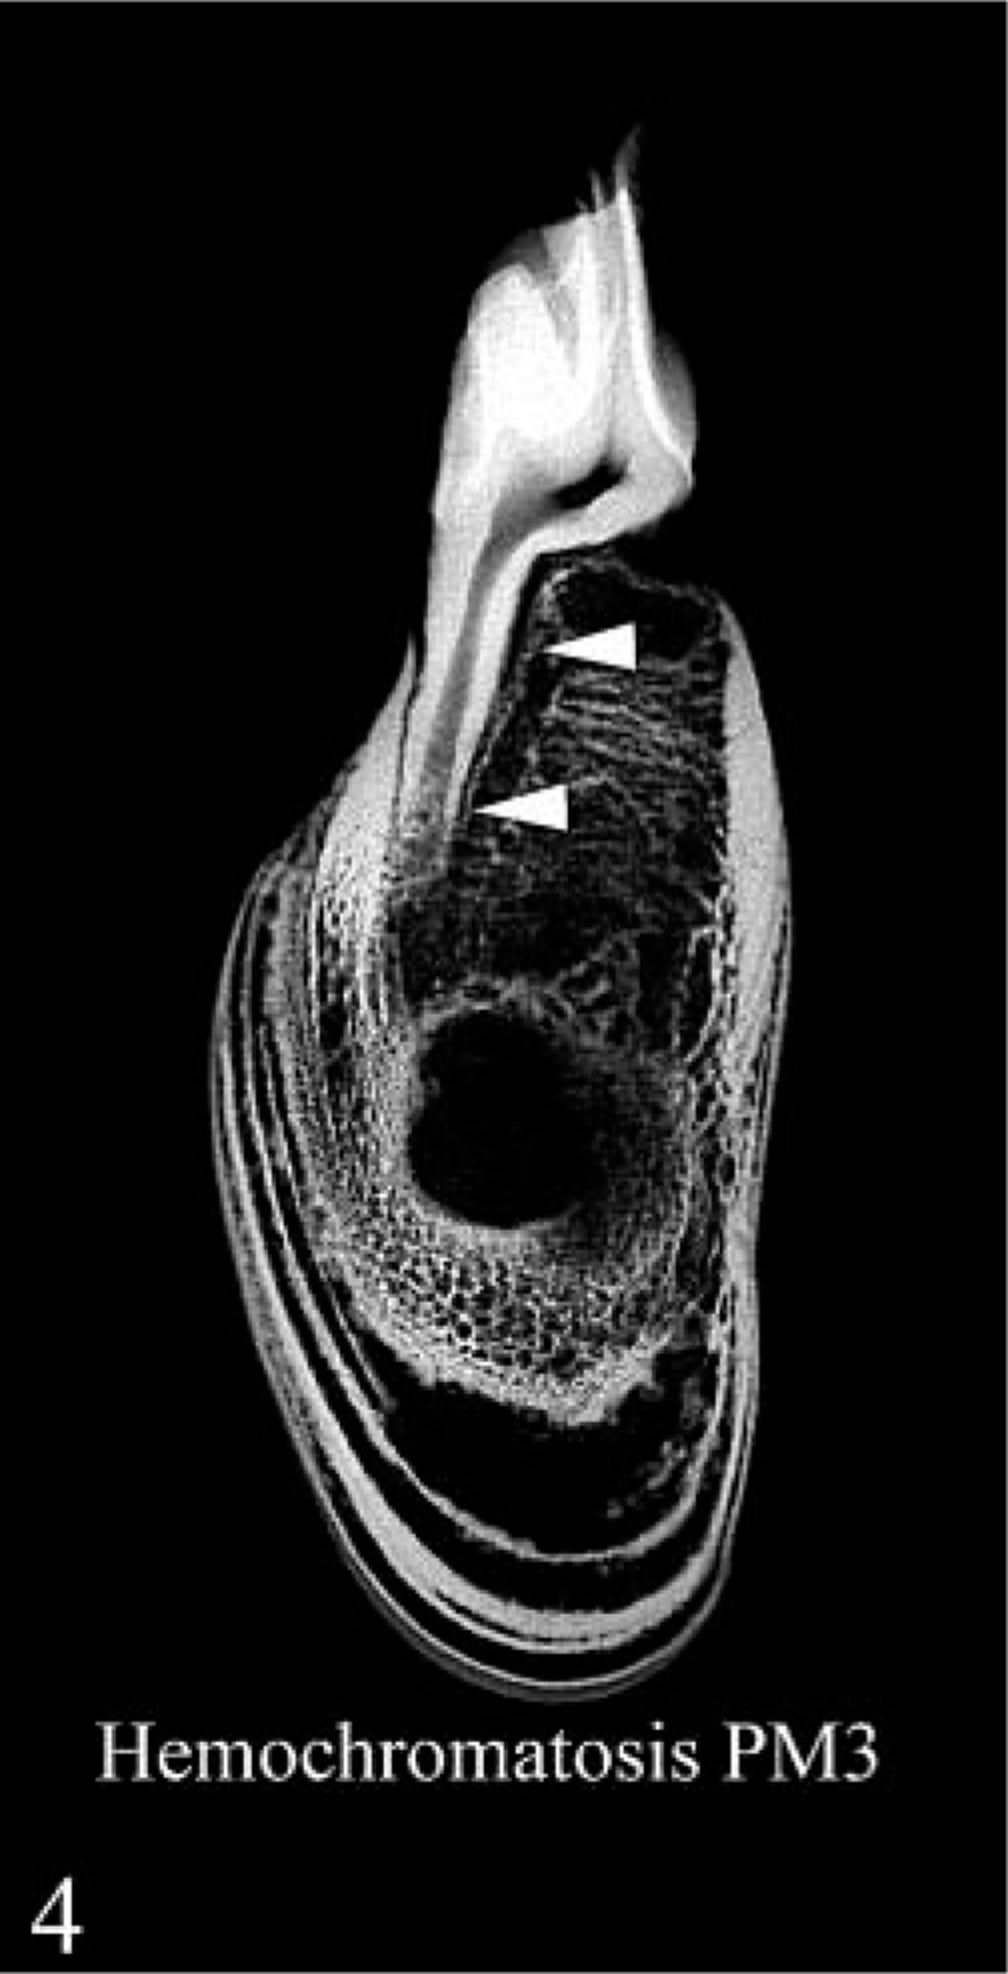
Morphometry and fluorescent label studies
Data are presented in Table 1. In the cross section of the right (nonfractured) femur, there was a thicker cortex in the affected animal as compared with the control. Although the entire periosteal surface was labeled in both animals, additional tetracycline labeling of buried outer circumferential bone was seen in the cortex in heifer No. 1. This pattern was confirmed in the 120-µm-thick ground sections (Figs. 5, 6). Generally, labeling in the hemochromatosis-affected heifer No. 1 followed the same pattern as the control but was less distinct and somewhat uneven. In addition, a greater portion of the endocortical surface had fluorescent label, indicating bone formation here had contributed to the increased width of the cortex in these bones. Essentially, the same changes were seen in the cross section of the humerus in heifer No. 1 as compared with the control. In cross sections of the metacarpal and metatarsal bones, there was no distinct difference in the width of the cortex and more variability in the surface labeling. However, there was still some tetracycline labeling of buried outer circumferential layers in the cortex of the hemochromatosis animal. There was a thicker cortex in the rib of heifer No. 1, although there was somewhat more surface labeling in the control.
Morphometric findings in cortical bone cross sections.∗.
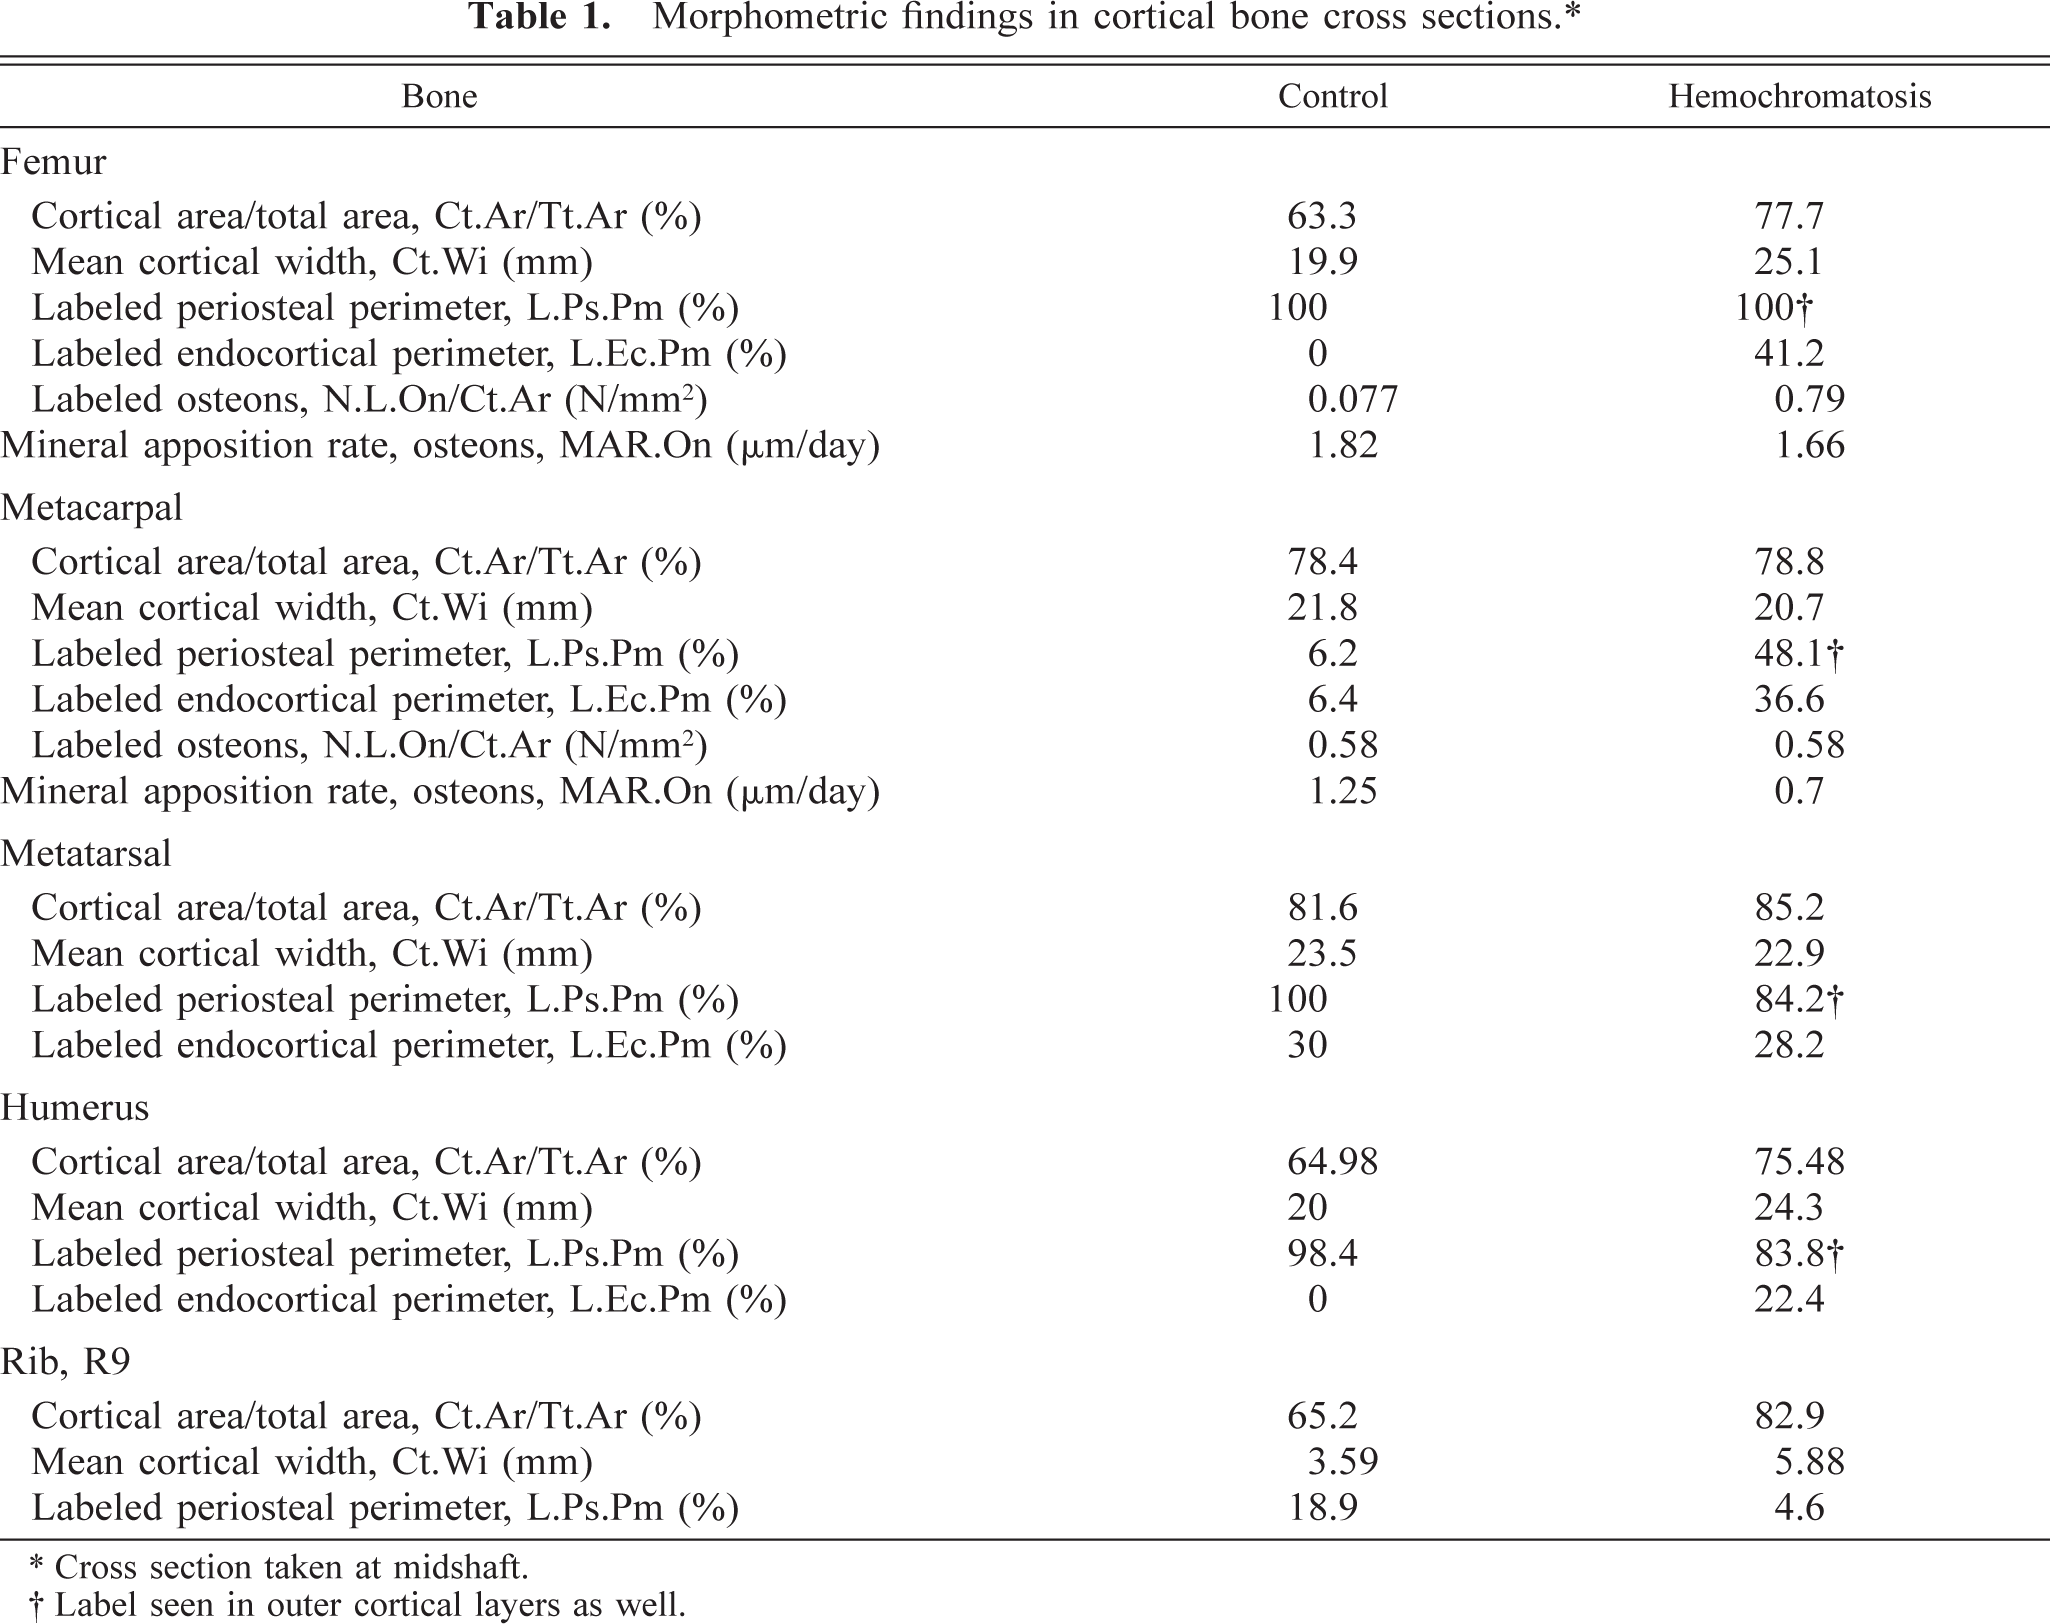
∗ Cross section taken at midshaft.
† Label seen in outer cortical layers as well.
Cross section, outer femoral cortex; control heifer No. 2. Fluochrome labeling of mineralization in outer circumferential layers of plexiform bone formation beneath the periosteum. Undecalcified, 120-µm-thick ground section, ultraviolet light. Bar = 150 µm.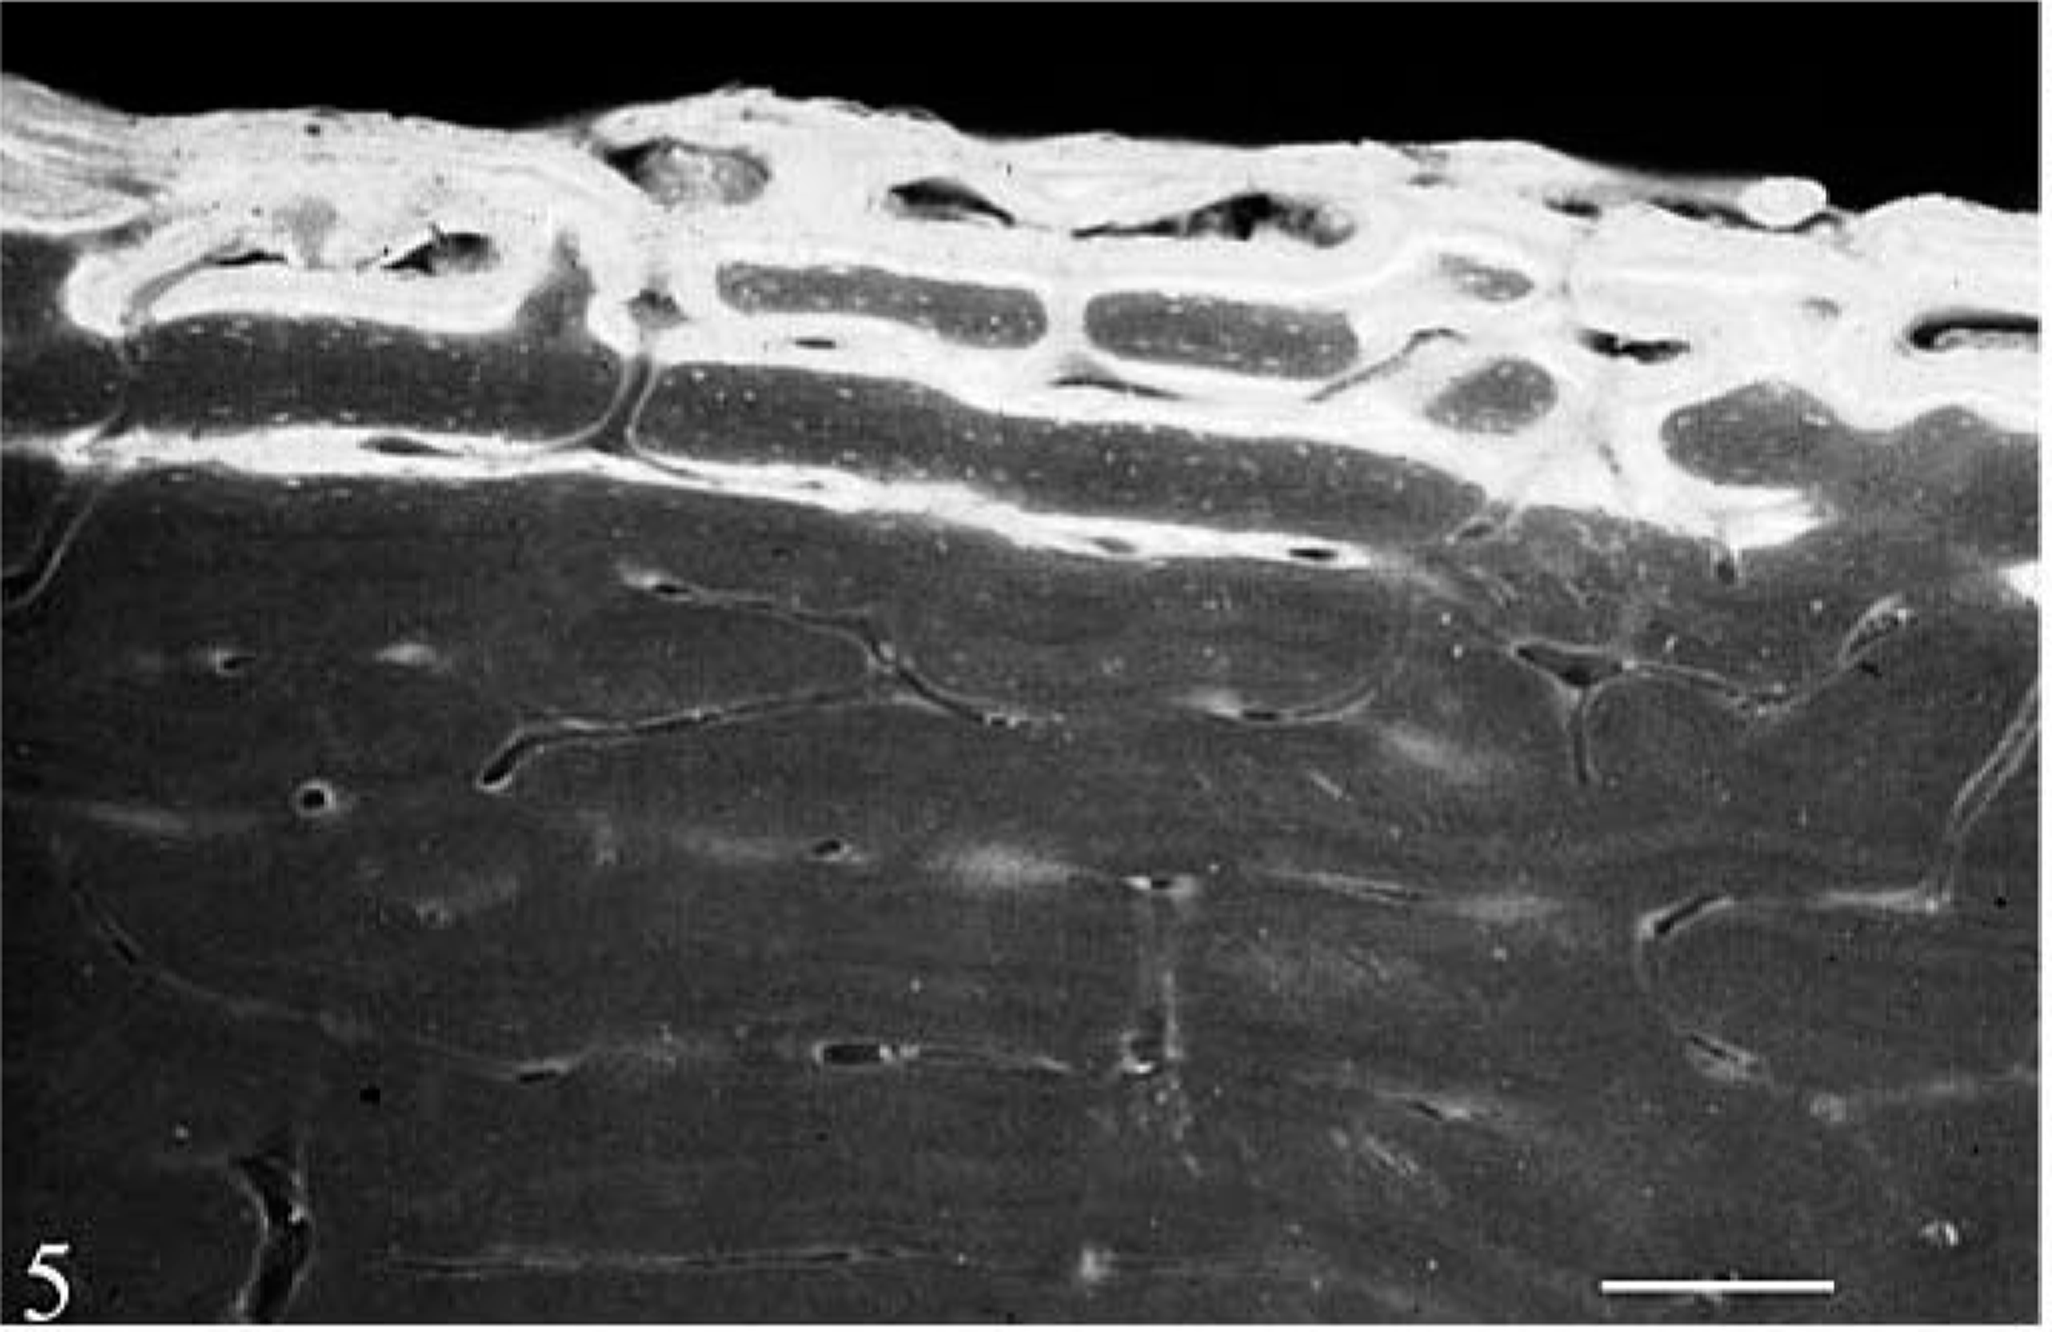
Cross section, outer femoral cortex; hemochromatosis heifer No. 1. Fluochrome labeling is less discreet and somewhat uneven in less mature outer circumferential layers of bone that extend deeper into cortex. A layer of nonlabeled (mineralized) matrix (between arrowheads) is seen over labeling in a deeper layer of mineralizing matrix at bottom. Undecalcified, 120-µm-thick ground section, ultraviolet light. Bar = 150 µm.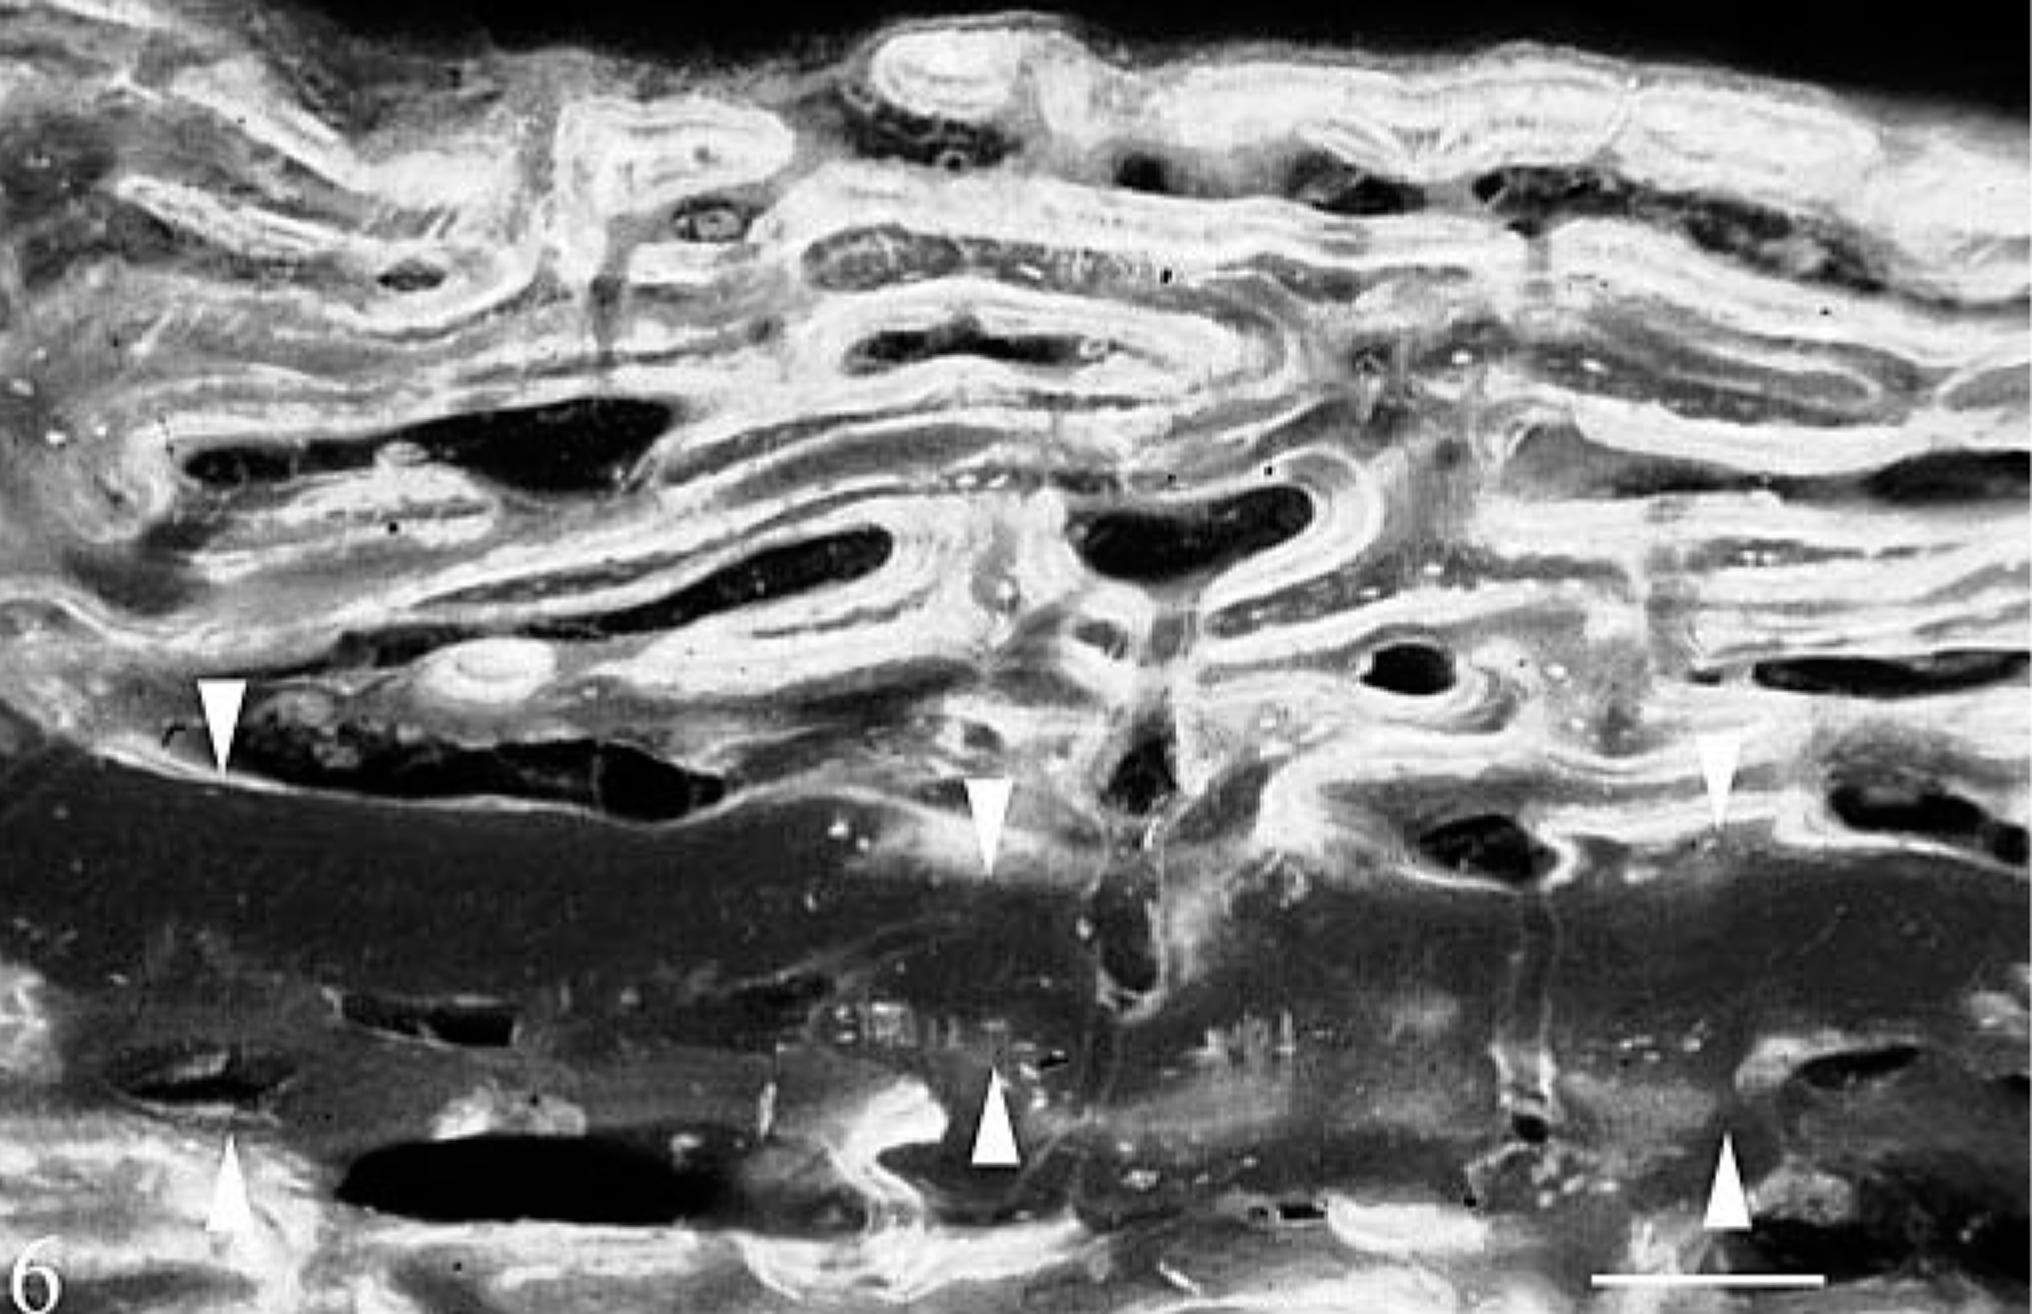
MAR (µm/day), as measured in inner cortical osteons, was only slightly less in the femur of heifer No. 1, which had many more actively forming osteons (N.L.On/mm2). However, in the metacarpal cortex, where the density of labeled osteons was the same, the MAR was markedly decreased in the affected animal. LoGR measured at the costochondral junction was 2.1 µm/day in the control and 1.1 µm/day in the hemochromatosis-affected heifer No. 1. Even greater suppression of LoGR in the hemochromatosis animal was estimated from labels beneath growth plates in the femur and tibia.
Histopathology
The following bones were examined: right ninth rib (cross- and longitudinal sections), proximal tibia and femur at growth plate, cross sections of humerus and metacarpus, mandible through PM3, maxilla through PM5, and longitudinal section through the end of the femoral fracture. The most striking change was in the cortex, where the hemochromatosis-affected heifer No. 1 had variable degrees of abnormal bone formation beneath the periosteum. This was most prominent in long bones and mandible but could be seen in ribs as well. There were increased layers of newly formed plexiform bone beneath the periosteum in outer circumferential lamellae. No abnormalities were seen in osteoblasts or in the bone (Figs. 7, 8). Deep to this, in the outer third of cortex, there were layers of variable thickness of rarefied woven or woven and lamellar bone in a plexiform pattern between layers of more dense normal cortical bone with formed haversian systems. In some areas the increased number of Howship's lacunae in the entrapped layers resulted in a moth-eaten appearance. The inner cortex of long bones was not osteopenic, and porosity here was generally comparable to that of the control. On some endocortical surfaces, there was osteoclastic erosion, as could be found in the control, and limited plexiform bone formation as well. The cortical changes were most extensive in the mandible, where there was little normal bone. Here, the radial angulation of the plexiform bone pattern suggested that mechanical factors influenced its formation. With Masson's trichome stain, the buried layers of plexiform bone stained predominantly blue similar to the overlying periosteal collagen, whereas the normal bone stained predominantly red (Fig. 9). There was often sharp demarcation of staining between layers.
Cross section, outer dorsomedial mandibular cortex (periosteal surface at top); control heifer No. 2. More mature, dense bone with only inactive cells in vascular canals is seen beneath the periosteum in the control animal. HE. Bar = 100 µm.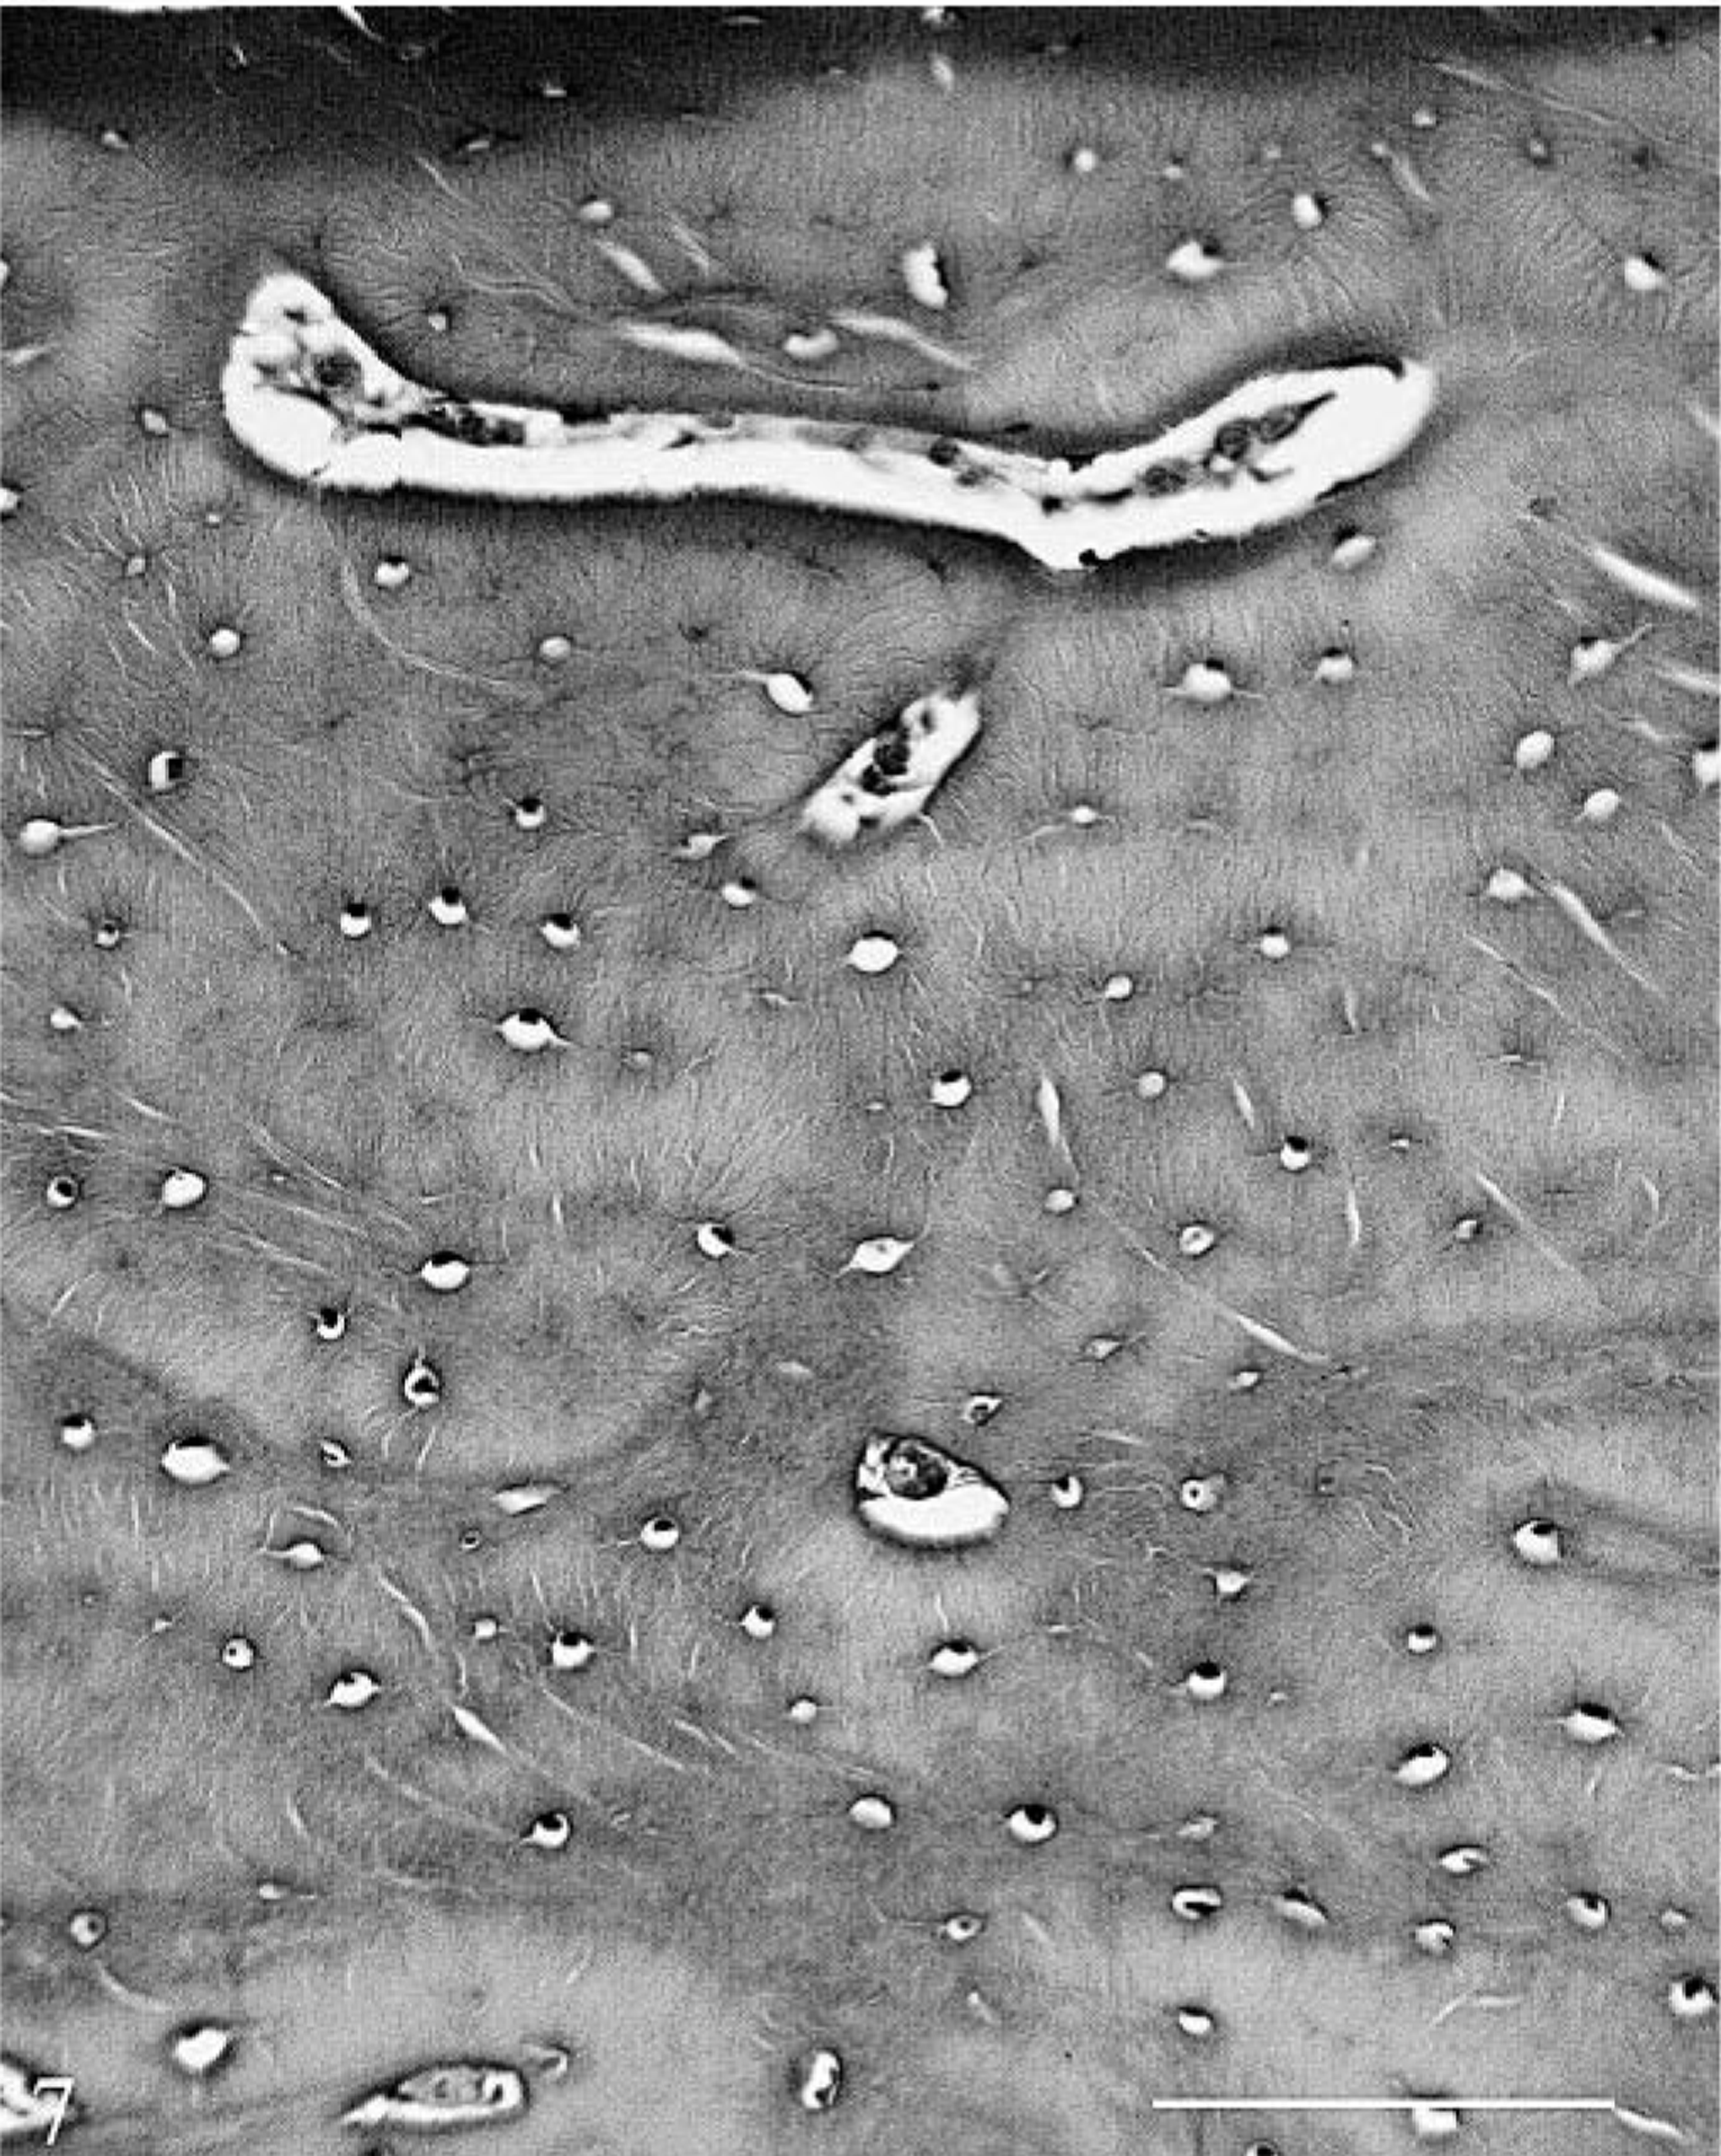
Cross section, outer dorsomedial mandibular cortex (periosteal surface at top); hemochromatosis heifer No. 1. No abnormalities are seen in osteoblasts or bone in the still forming circumferential layers of plexiform bone. HE. Bar = 100 µm.
Cross section, ventrolateral mandibular cortex; hemochromatosis heifer No. 1 (periosteal surface at top). Layers of rarefied, osteopenic bone with a more radial angulation of the immature plexiform pattern (P) are seen between layers of more normal bone (N). With trichrome stain, the layers of plexiform bone stained predominantly blue like the collagen in the periosteum, whereas the more mature bone stained predominantly red. Masson's trichome. Bar = 100 µm.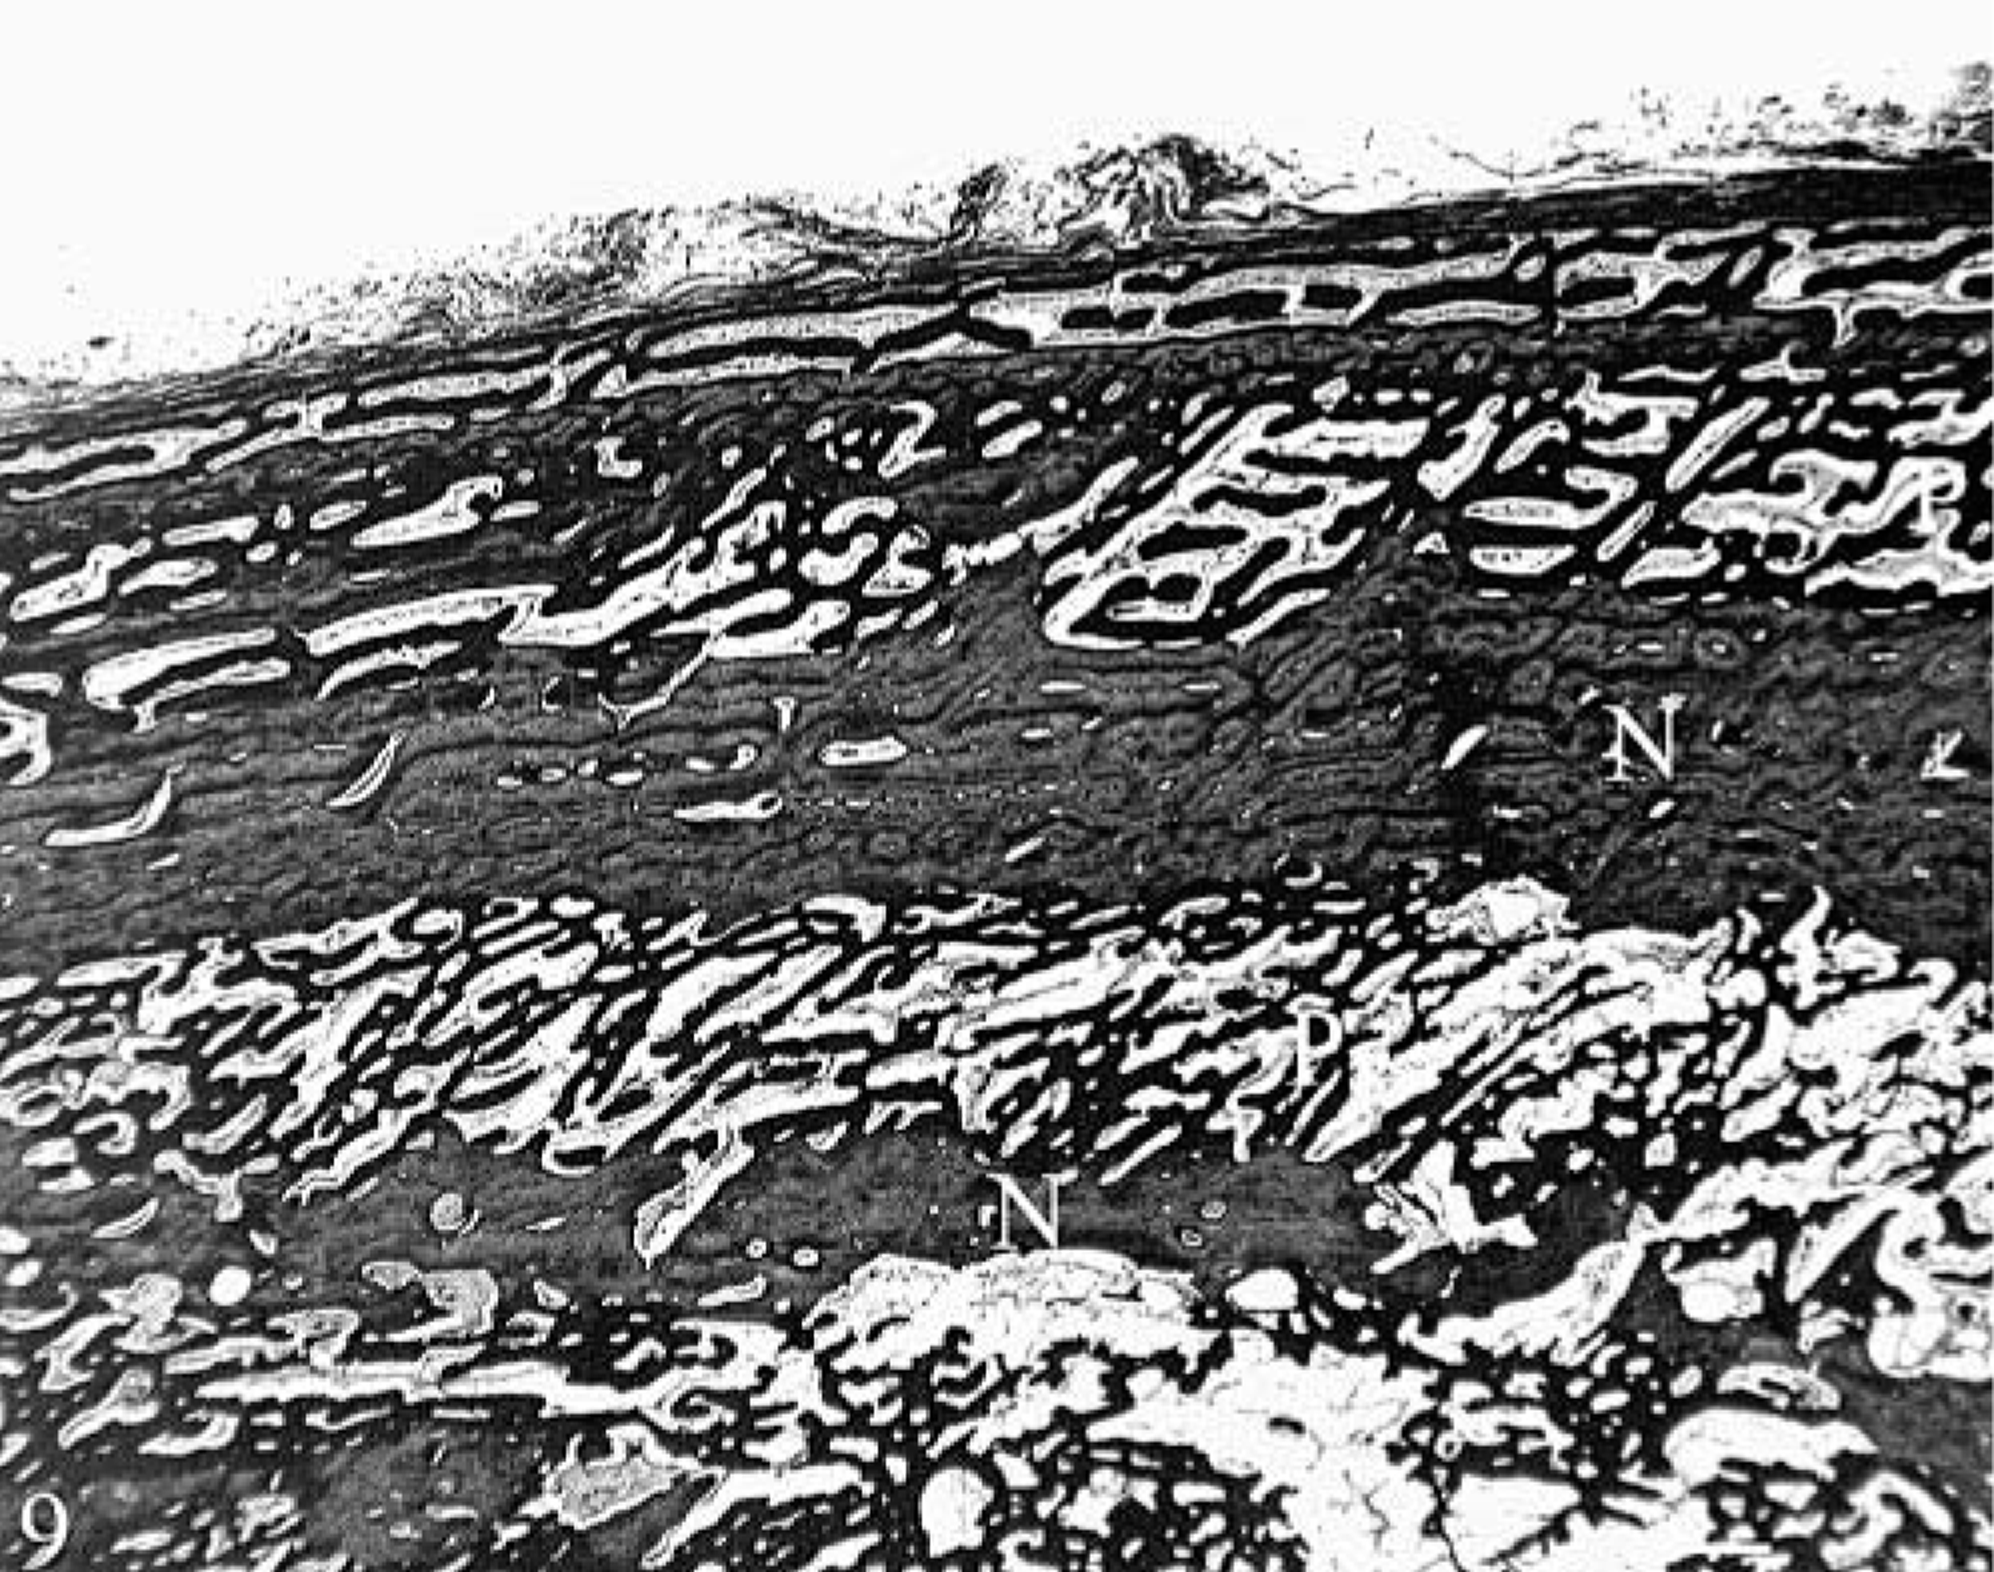
There was little or no staining for iron with Perls' stain in the decalcified sections. This was attributed to the loss of iron and bone mineral in the demineralization process. However, prolonged exposure to acid may also be a factor because histologic sections of iron-positive soft tissue controls lost about 50% of staining intensity after being left overnight in 10% formic acid. Faint positive staining for iron was seen in the more mature matrix of the inner mandibular cortex of heifer No. 1, and here, occasional osteoclasts had fine iron-positive granules in their cytoplasm. No staining was found in osteoblasts. The undecalcified, 120-µm-thick ground sections of long bone cortex revealed iron in the woven bone cores of the radiographically less-dense plexiform bone in the superficial cortex and buried layers (Fig. 10). Discrete linear reaction was also present in cement lines and at the interface with unmineralized matrix as well as along endocortical surfaces in the dense bone of the inner cortex. Matching sections from the control were negative for iron.
Cross section, outer femoral cortex; hemochromatosis heifer No. 1. Iron-positive staining (Fe) is seen in the woven bone cores of poorly mineralized plexiform bone in the superficial cortex and buried layers. Iron is also present at the surface of and interface with nonstaining, normal mineralized bone (N) as a discreet line. Note the artifactual separation between the iron-containing matrix and the more mature mineralized matrix at the bottom. Undecalcified, 120-µm-thick ground section, Perls' iron stain. Bar = 800 µm.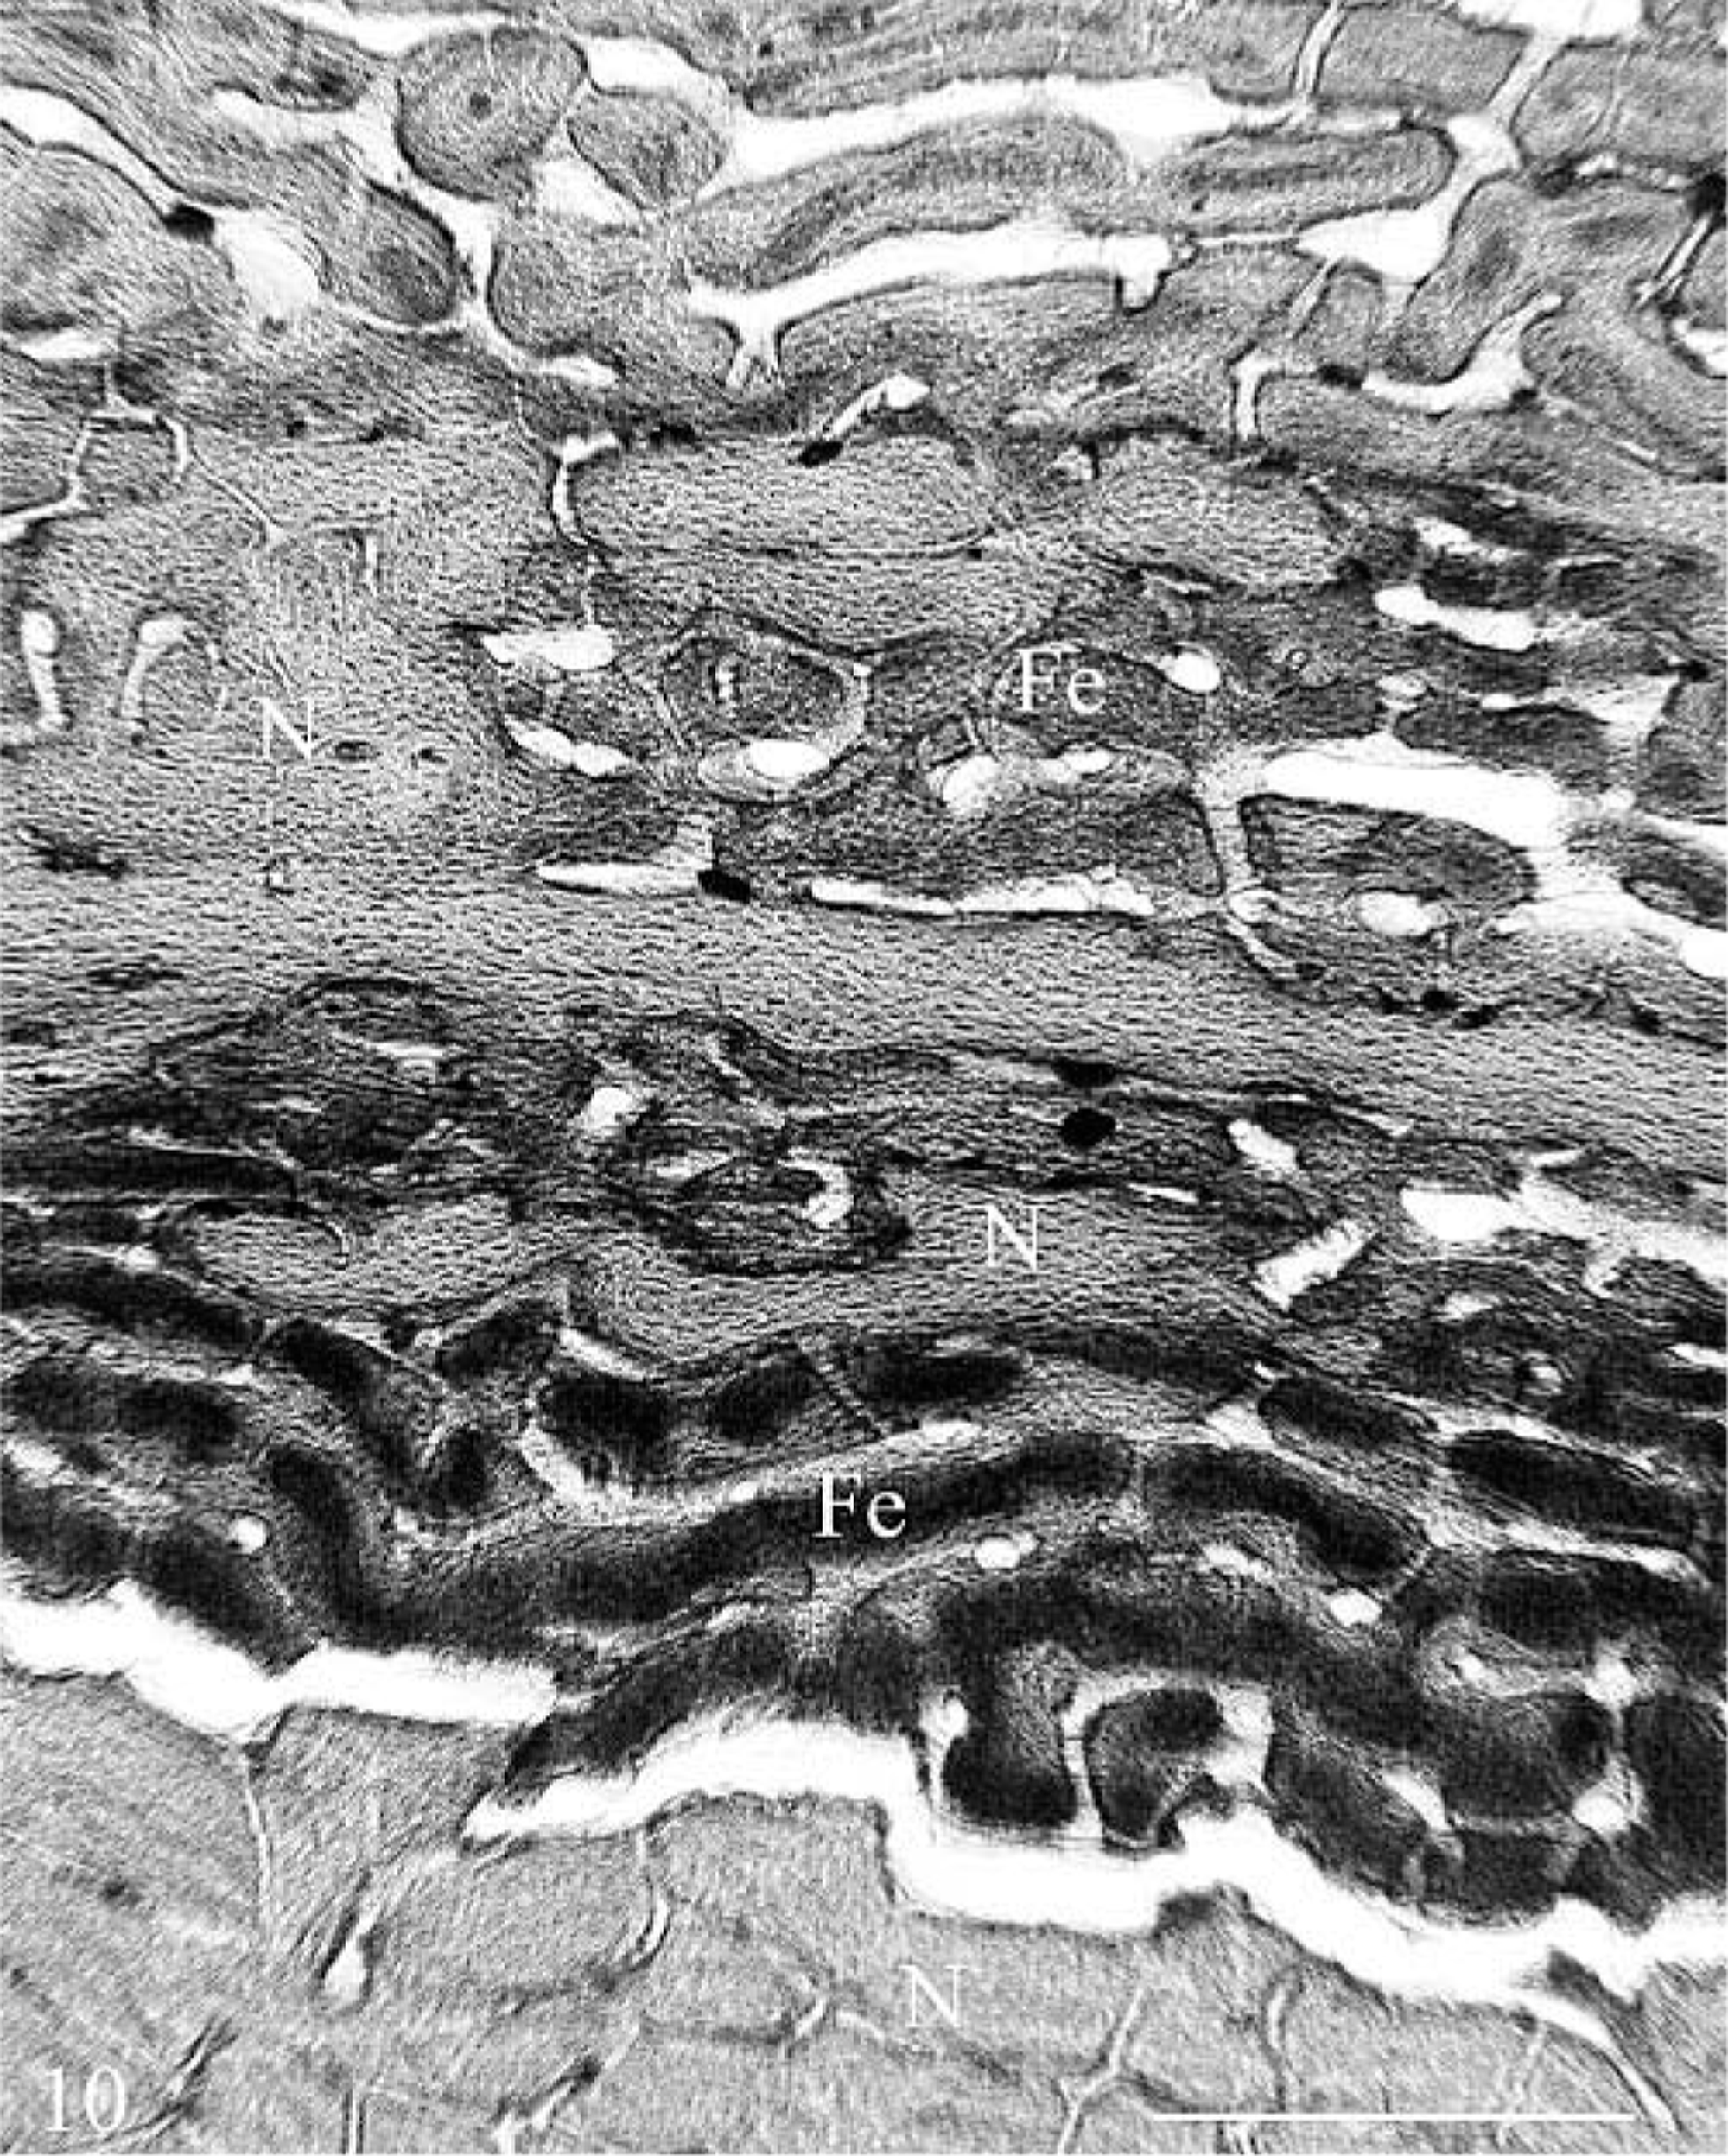
Trabecular bone did not appear to be primarily affected in the hemochromatosis-affected heifer No. 1. Trabecular bone was grossly normal in the vertebral column and long bones. Histologically, the trabecular bone in the rib sections was considered comparable to that of the control. In the mandible and maxilla, there was rarefaction of the trabecular bone around the tooth and at the alveolar margin that corresponded to the radiographic lamina dura dentes. In the teeth, resorption cavities lined by Howship's lacunae of osteoclastic erosion were seen in the cementum and dentin of the roots in the hemochromatosis animal. No dental resorption was seen in the control animal.
Endochondral bone formation was evaluated in the rib, tibia, and femur. There was evidence of slower growth in the hemochromatosis-affected heifer No. 1, with decreased cellularity of the cartilage and shorter hypertrophied cartilage cell columns. There were shorter bone spicules in the primary spongiosa that tended to have thicker cartilage cores and more transverse connections (Figs. 11, 12). Fewer osteoblasts were seen on trabecular surfaces, and osteoblasts had a less plump, more flattened appearance.
Endochondral ossification at costochondral junction of right ninth rib; control heifer No. 2. Abundant cellularity of cartilage cell columns and long, fine spicules of metaphyseal bone indicated normal growth. Note plump osteoblasts on trabecular surfaces. HE. Bar = 100 µm.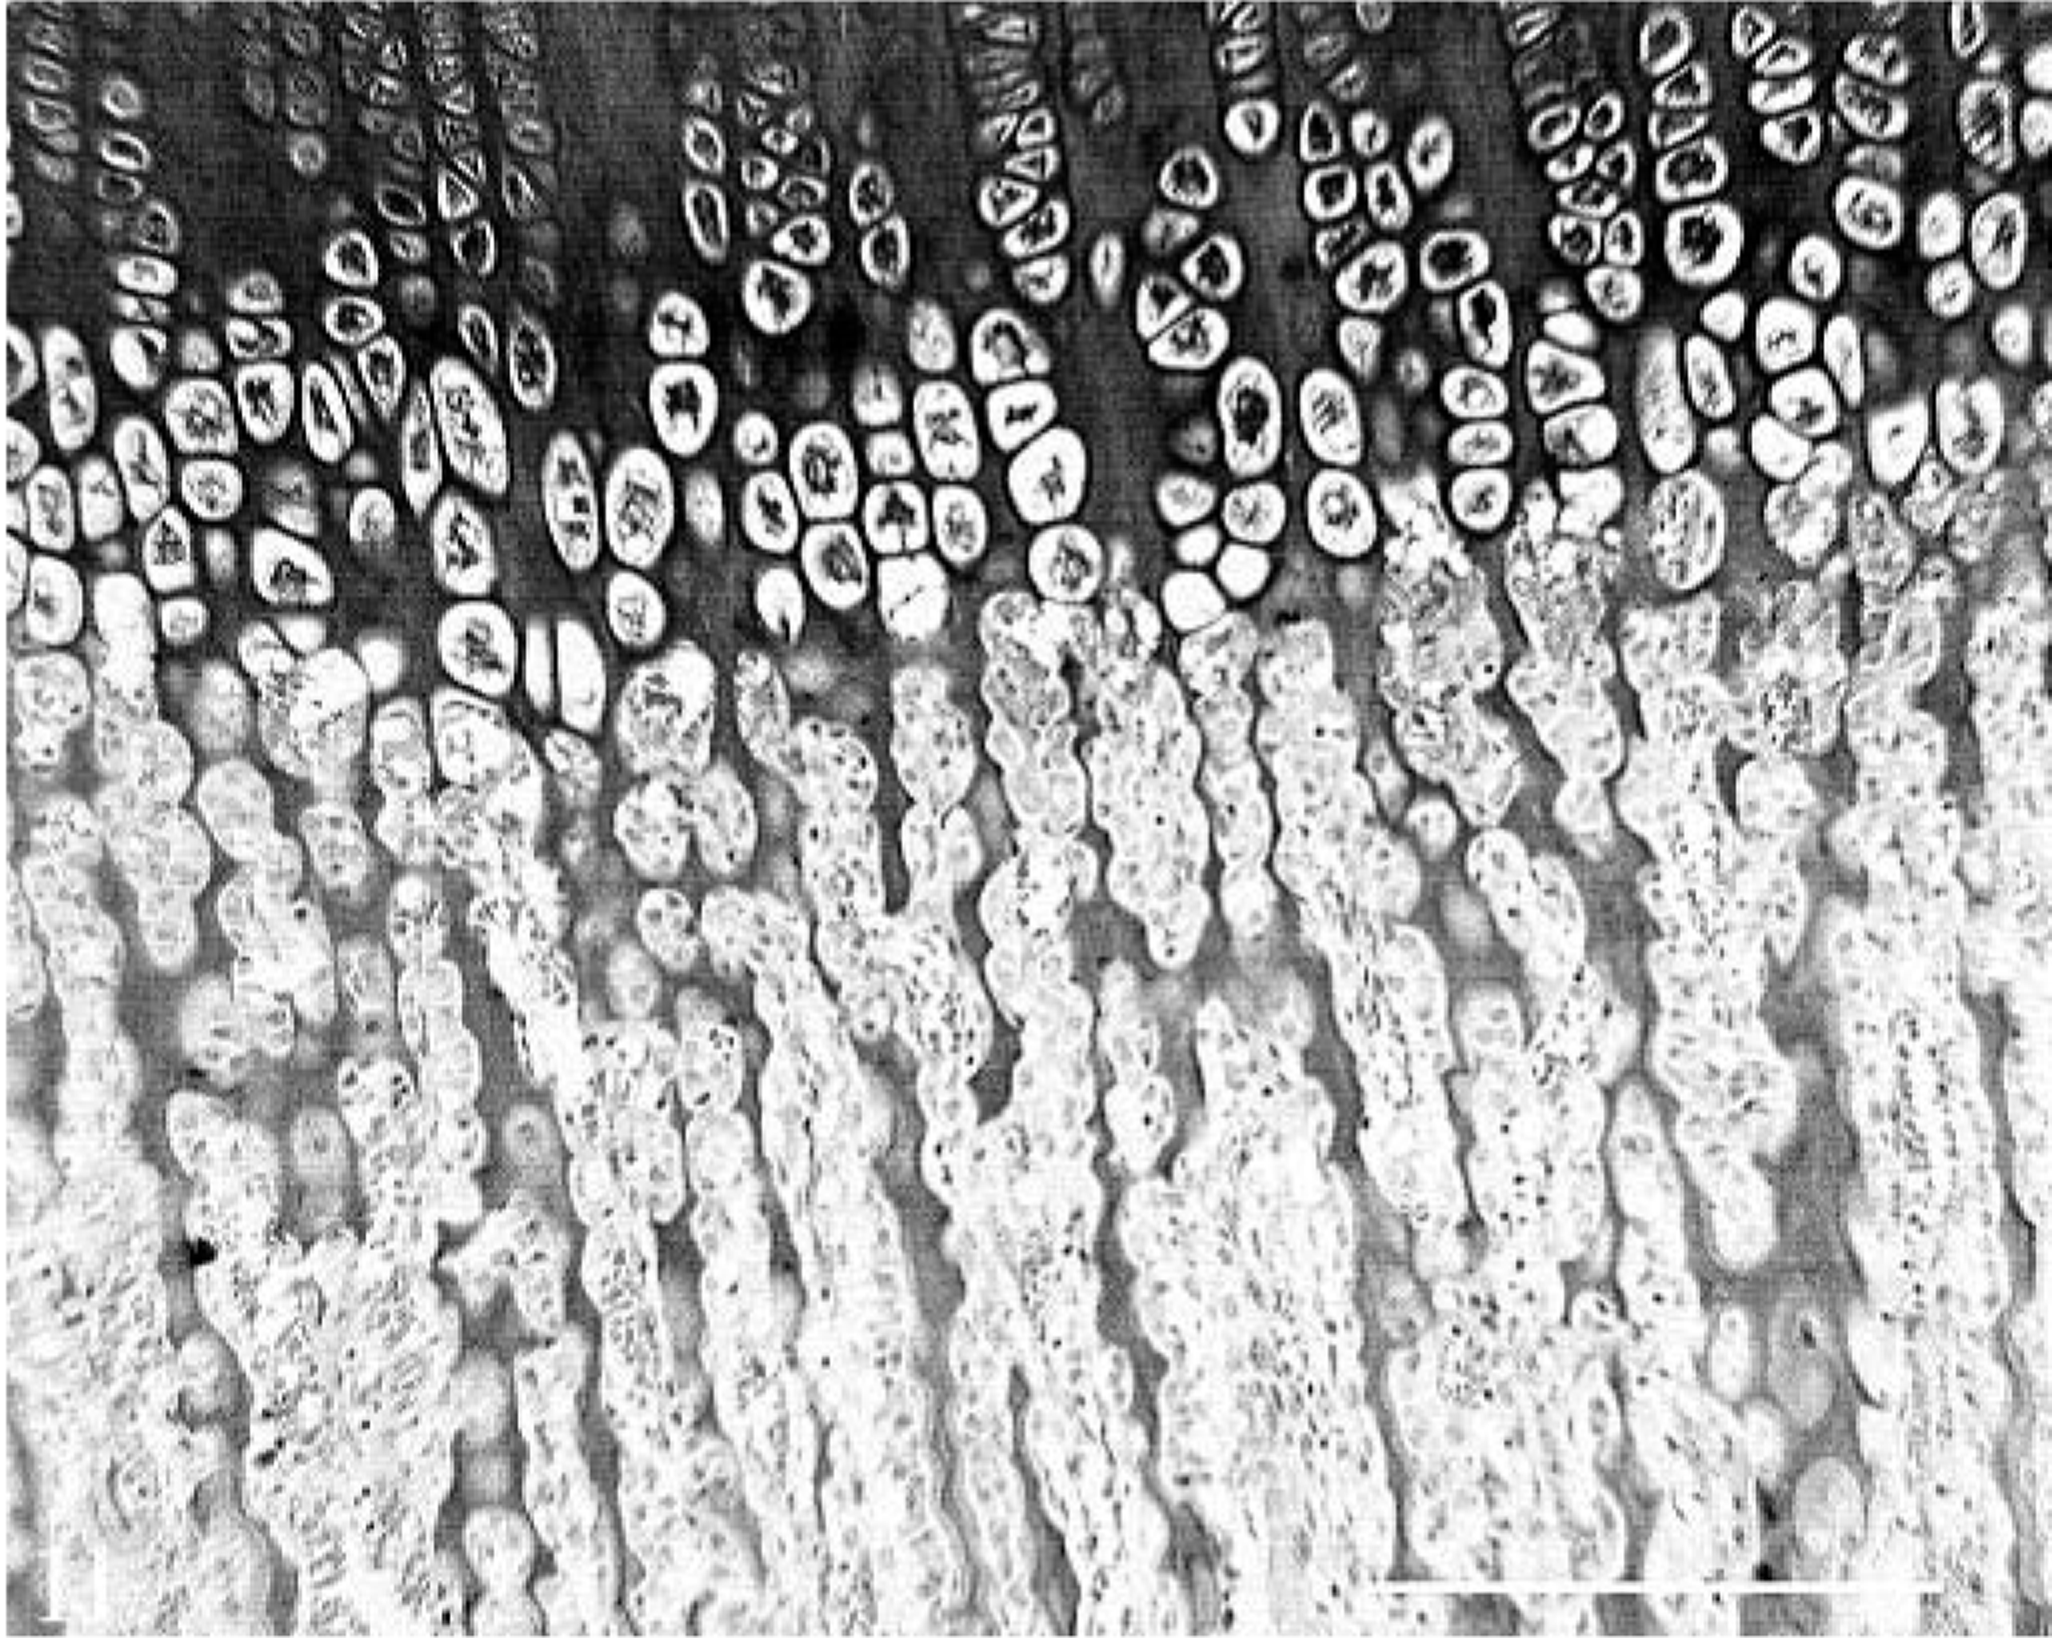
Endochondral ossification at costochondral junction of right ninth rib; hemochromatosis heifer No. 1. There was evidence of decreased growth in the less cellular cartilage and shorter, thicker trabeculae in the primary spongiosa with wider cartilage cores (arrows) and transverse connections (arrowheads). There were also fewer, more spindyloid osteoblasts on trabecular surfaces. HE. Bar = 100 µm.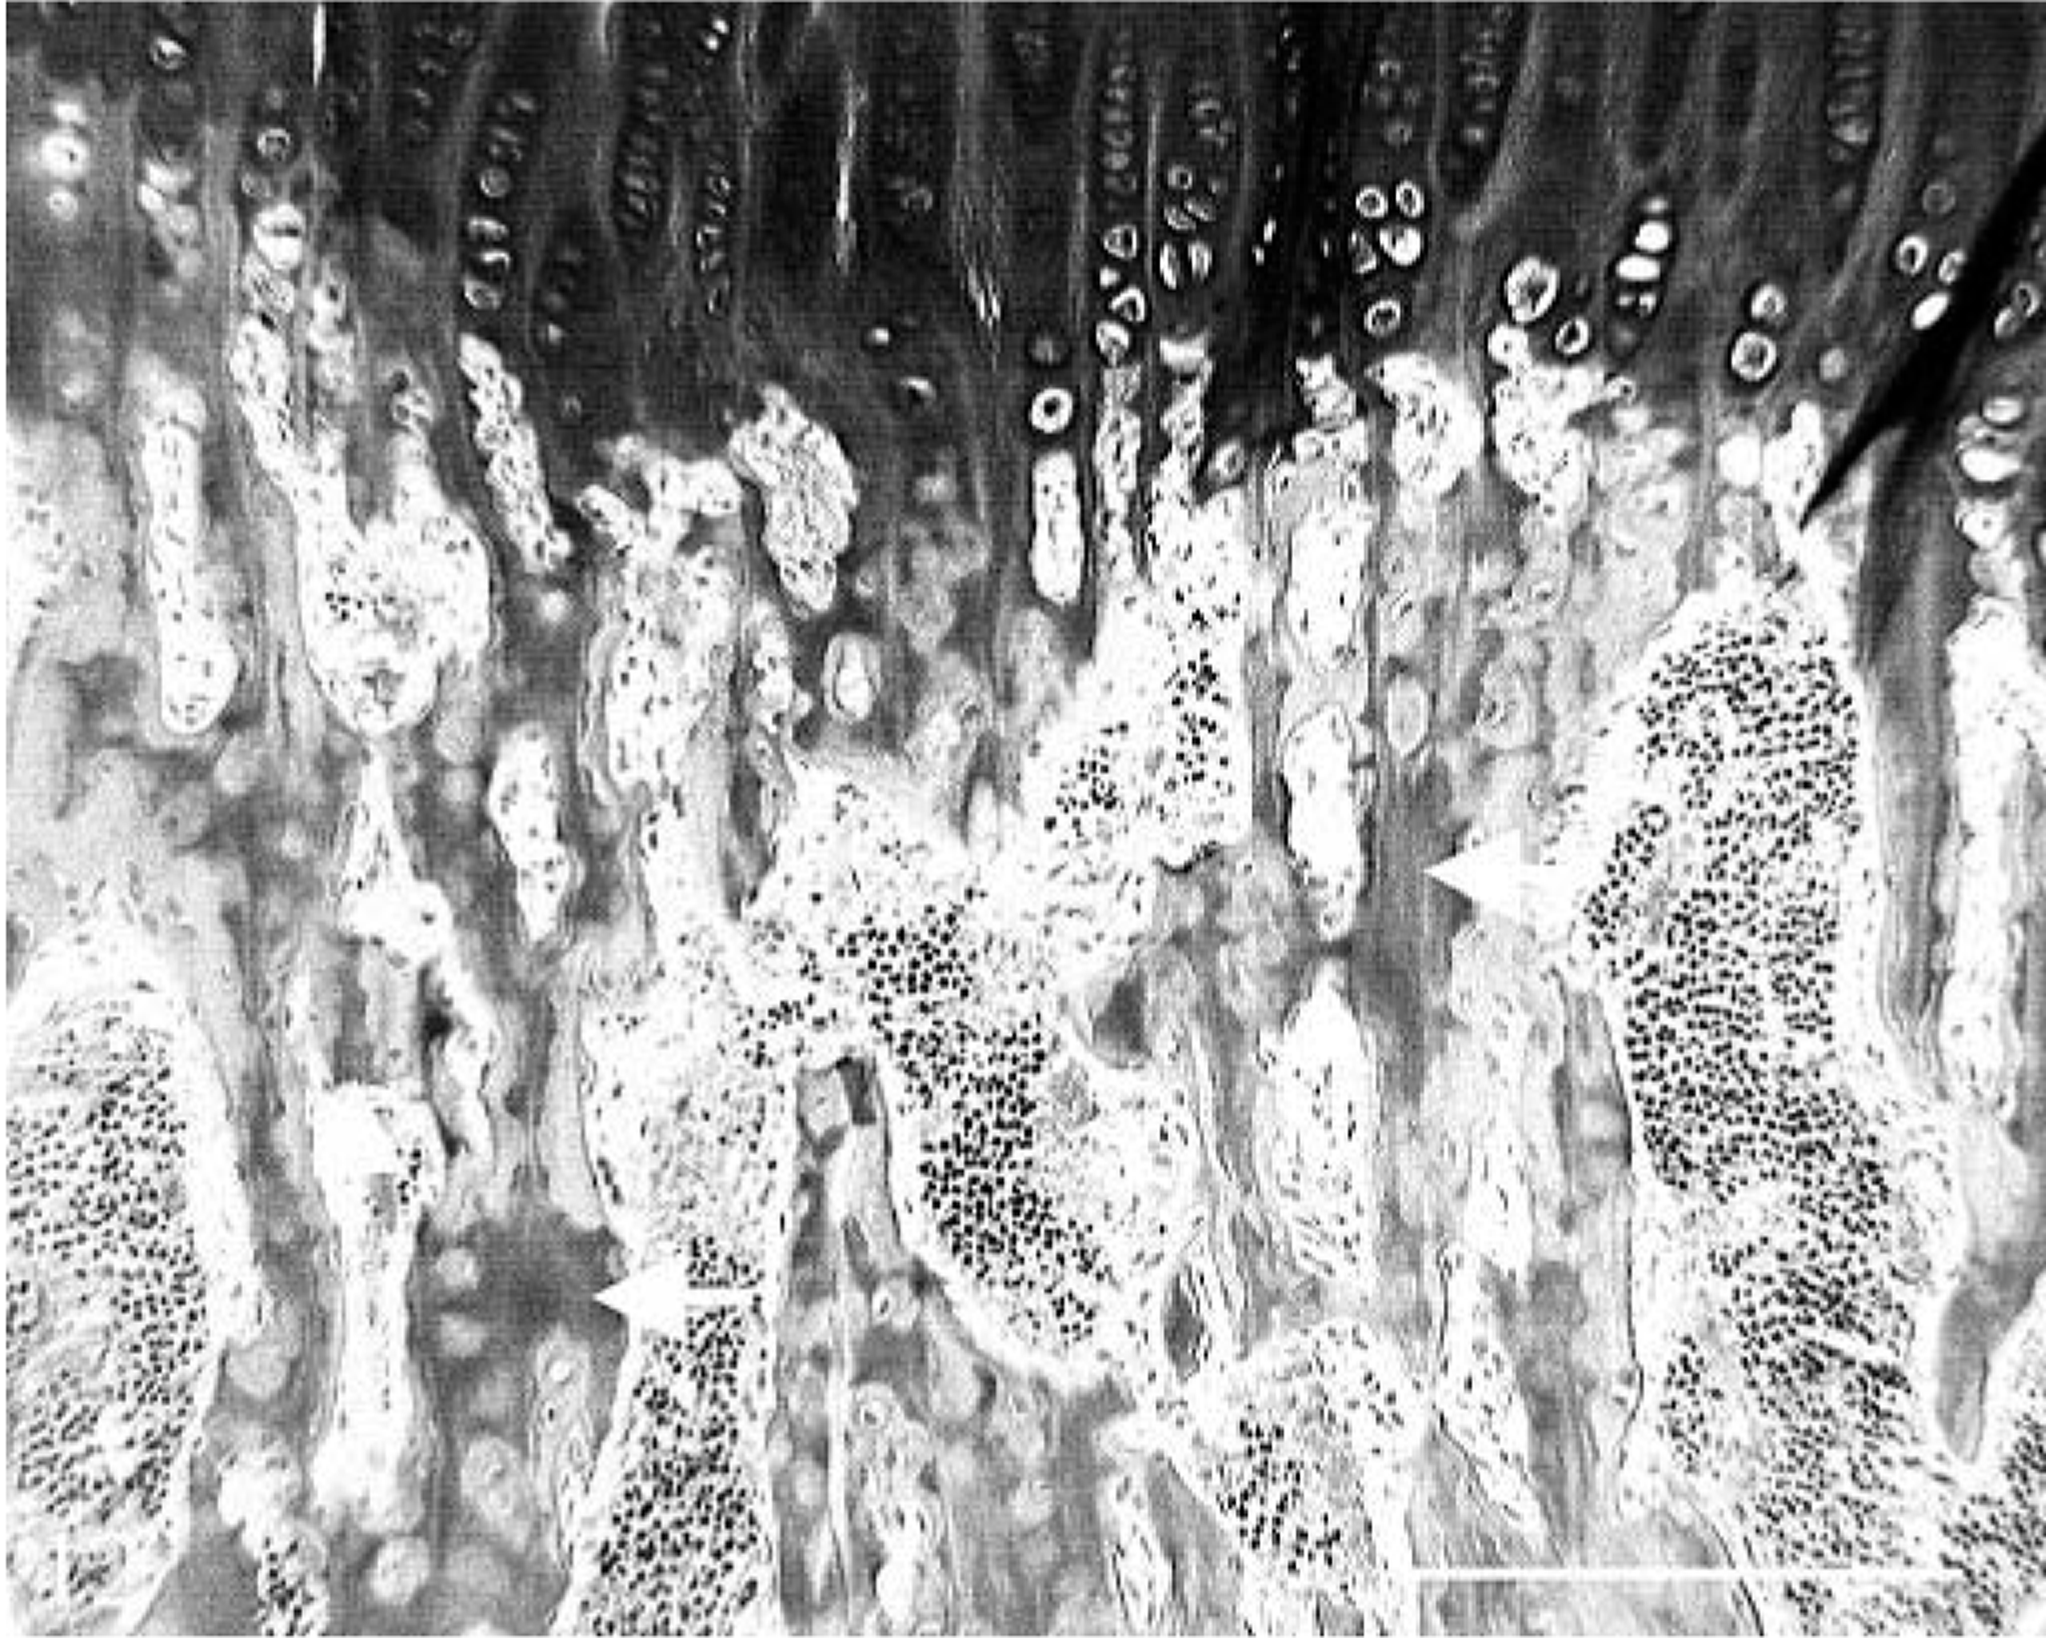
The fracture site in the right 12th rib had layers of woven bone between lamellar bone compatible with healing callus along separation planes in a green stick fracture. There was active remodeling at the site, and areas of necrotic bone were present. Similar changes were seen at the site of the fracture in the humerus, indicating that there had been separation of cortical layers. Remodeling was active as well, and some osteoclasts at the site had a more tan cytoplasm, suggesting the presence of iron.
In joints, no changes were recognized in articular cartilage or subchondral bone in the hemochromatosis animal. Samples of synovial membrane, meniscus, and biceps tendon had no histologic abnormalities. Nor was there any evidence of iron accumulation with Perls' stain. There was heavy intracytoplasmic hepatocellular accumulation of Perls'-positive iron granules in all acinar zones of heifer No. 1, with moderate staining of Kupffer cells. Heifer No. 2 had essentially no stainable iron in hepatocytes and Kupffer cells. A histologic grading of 4+ and 0 was obtained for affected and unaffected livers, respectively, using Conn's grading. 3 There was no histologic evidence of fibrosis or necrosis in either animal. Stainable iron was present in the hemochromatosis animal in mucosa of proximal duodenum (heavy), renal tubular epithelium (heavy), abomasal mucosa (light), and follicular epithelium of thyroid (light).
Scanning electron microscopy
The cross section of outer metacarpal cortex in the control had only remnants of circumferential bone formation beneath the periosteum and more dense cortical bone beneath it (Fig. 13). On EDS analysis, there was higher calcium and phosphorus in the middle and inner cortex than in the more superficial cortex. No iron was detected. The hemochromatosis animal had layers of buried immature matrix, which had a porous appearance and sometimes appeared collapsed (Fig. 14). On EDS analysis, calcium and phosphorus levels were reduced in the normal bone of the outer cortex in the hemochromatosis animal to approximately half those of the control. Only small amounts of calcium and phosphorus were present in the buried abnormal matrix. Iron was detectable in some areas of abnormal matrix. In the mature bone of the inner cortex the calcium and phosphorus levels were higher and comparable to those of the control. No iron was detected in the inner cortical site in either animal. No detectable Cu, F, or Al was found in analyses of samples from either animal.
SEM of cortical surface of Mc3 cross section; control heifer No. 2. Remnants of plexiform bone in outer circumferential lamellae are present beneath the periosteum. Sites of EDS sampling in the outer and middle cortex are shown, and relative calcium (Ca) and phosphorus (P) levels are given as counts per sampling time. Iron (Fe) was not detected (nd). Bar = 150 µm.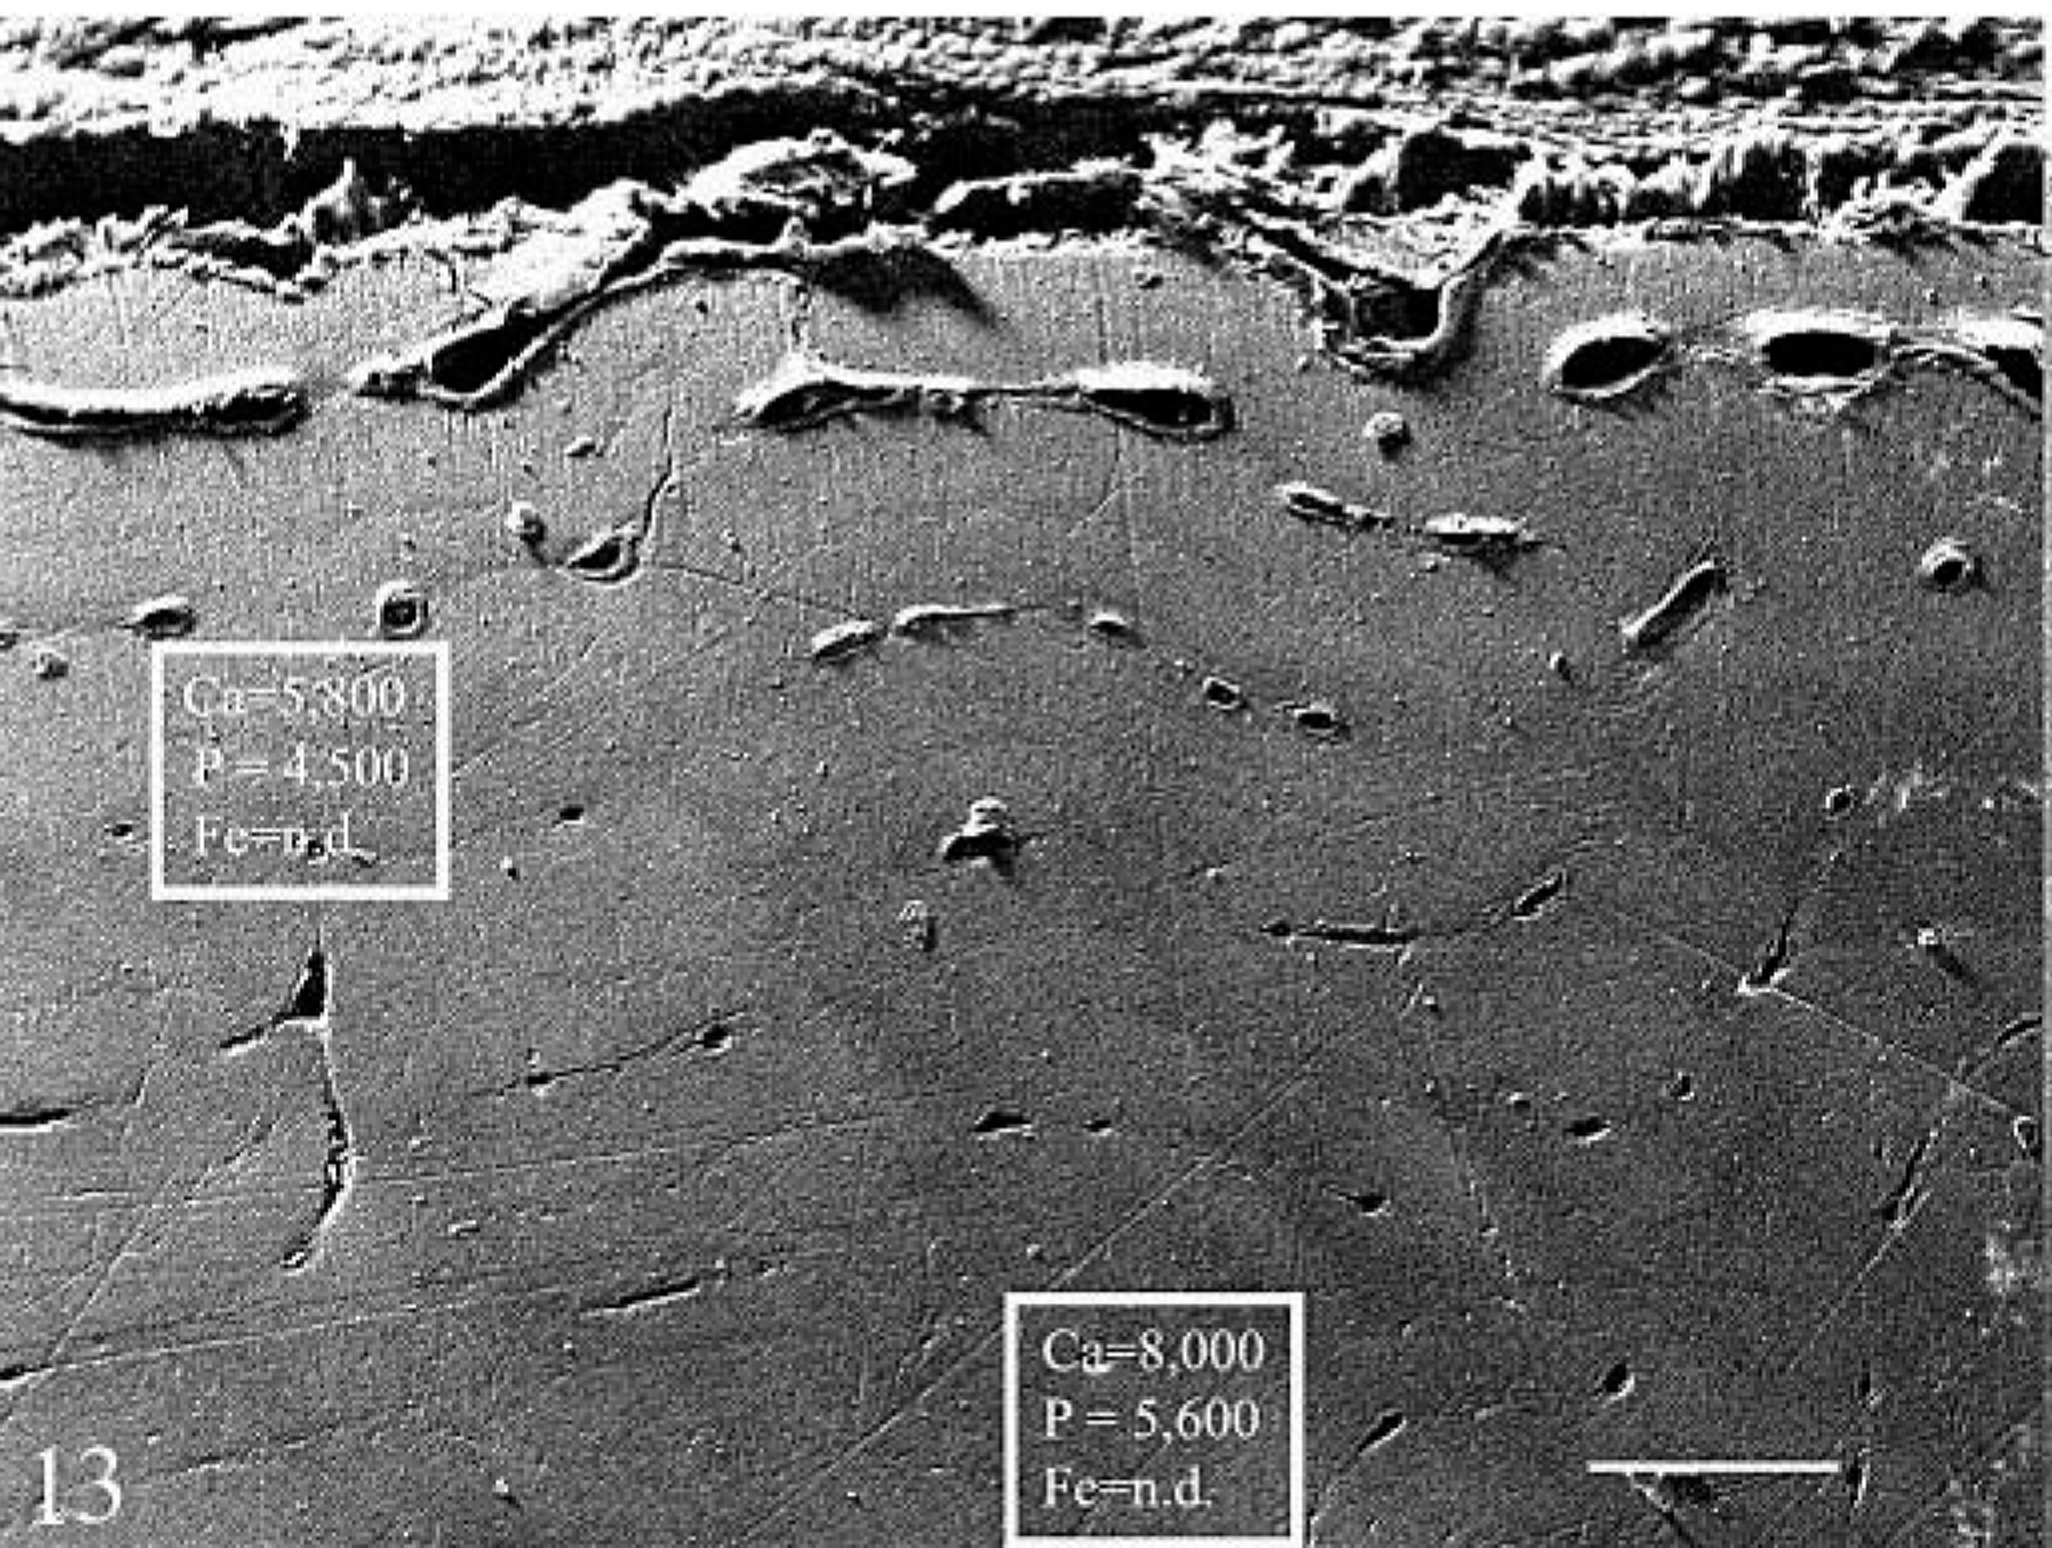
SEM of cortical surface of Mc3 cross section; hemochromatosis heifer No. 1. Pale islands of less-dense matrix (outlined by arrowheads) and bands of darker, immature matrix (outlined by arrows) were seen in concentric layers beneath the surface. Sites of EDS sampling and relative calcium (Ca), phosphorus (P), and iron (Fe) levels are given as counts per sampling time. Calcium and phosphorus levels were reduced in normal and affected matrix as compared with control. Iron was detectable in some areas of abnormal matrix. Bar = 150 µm.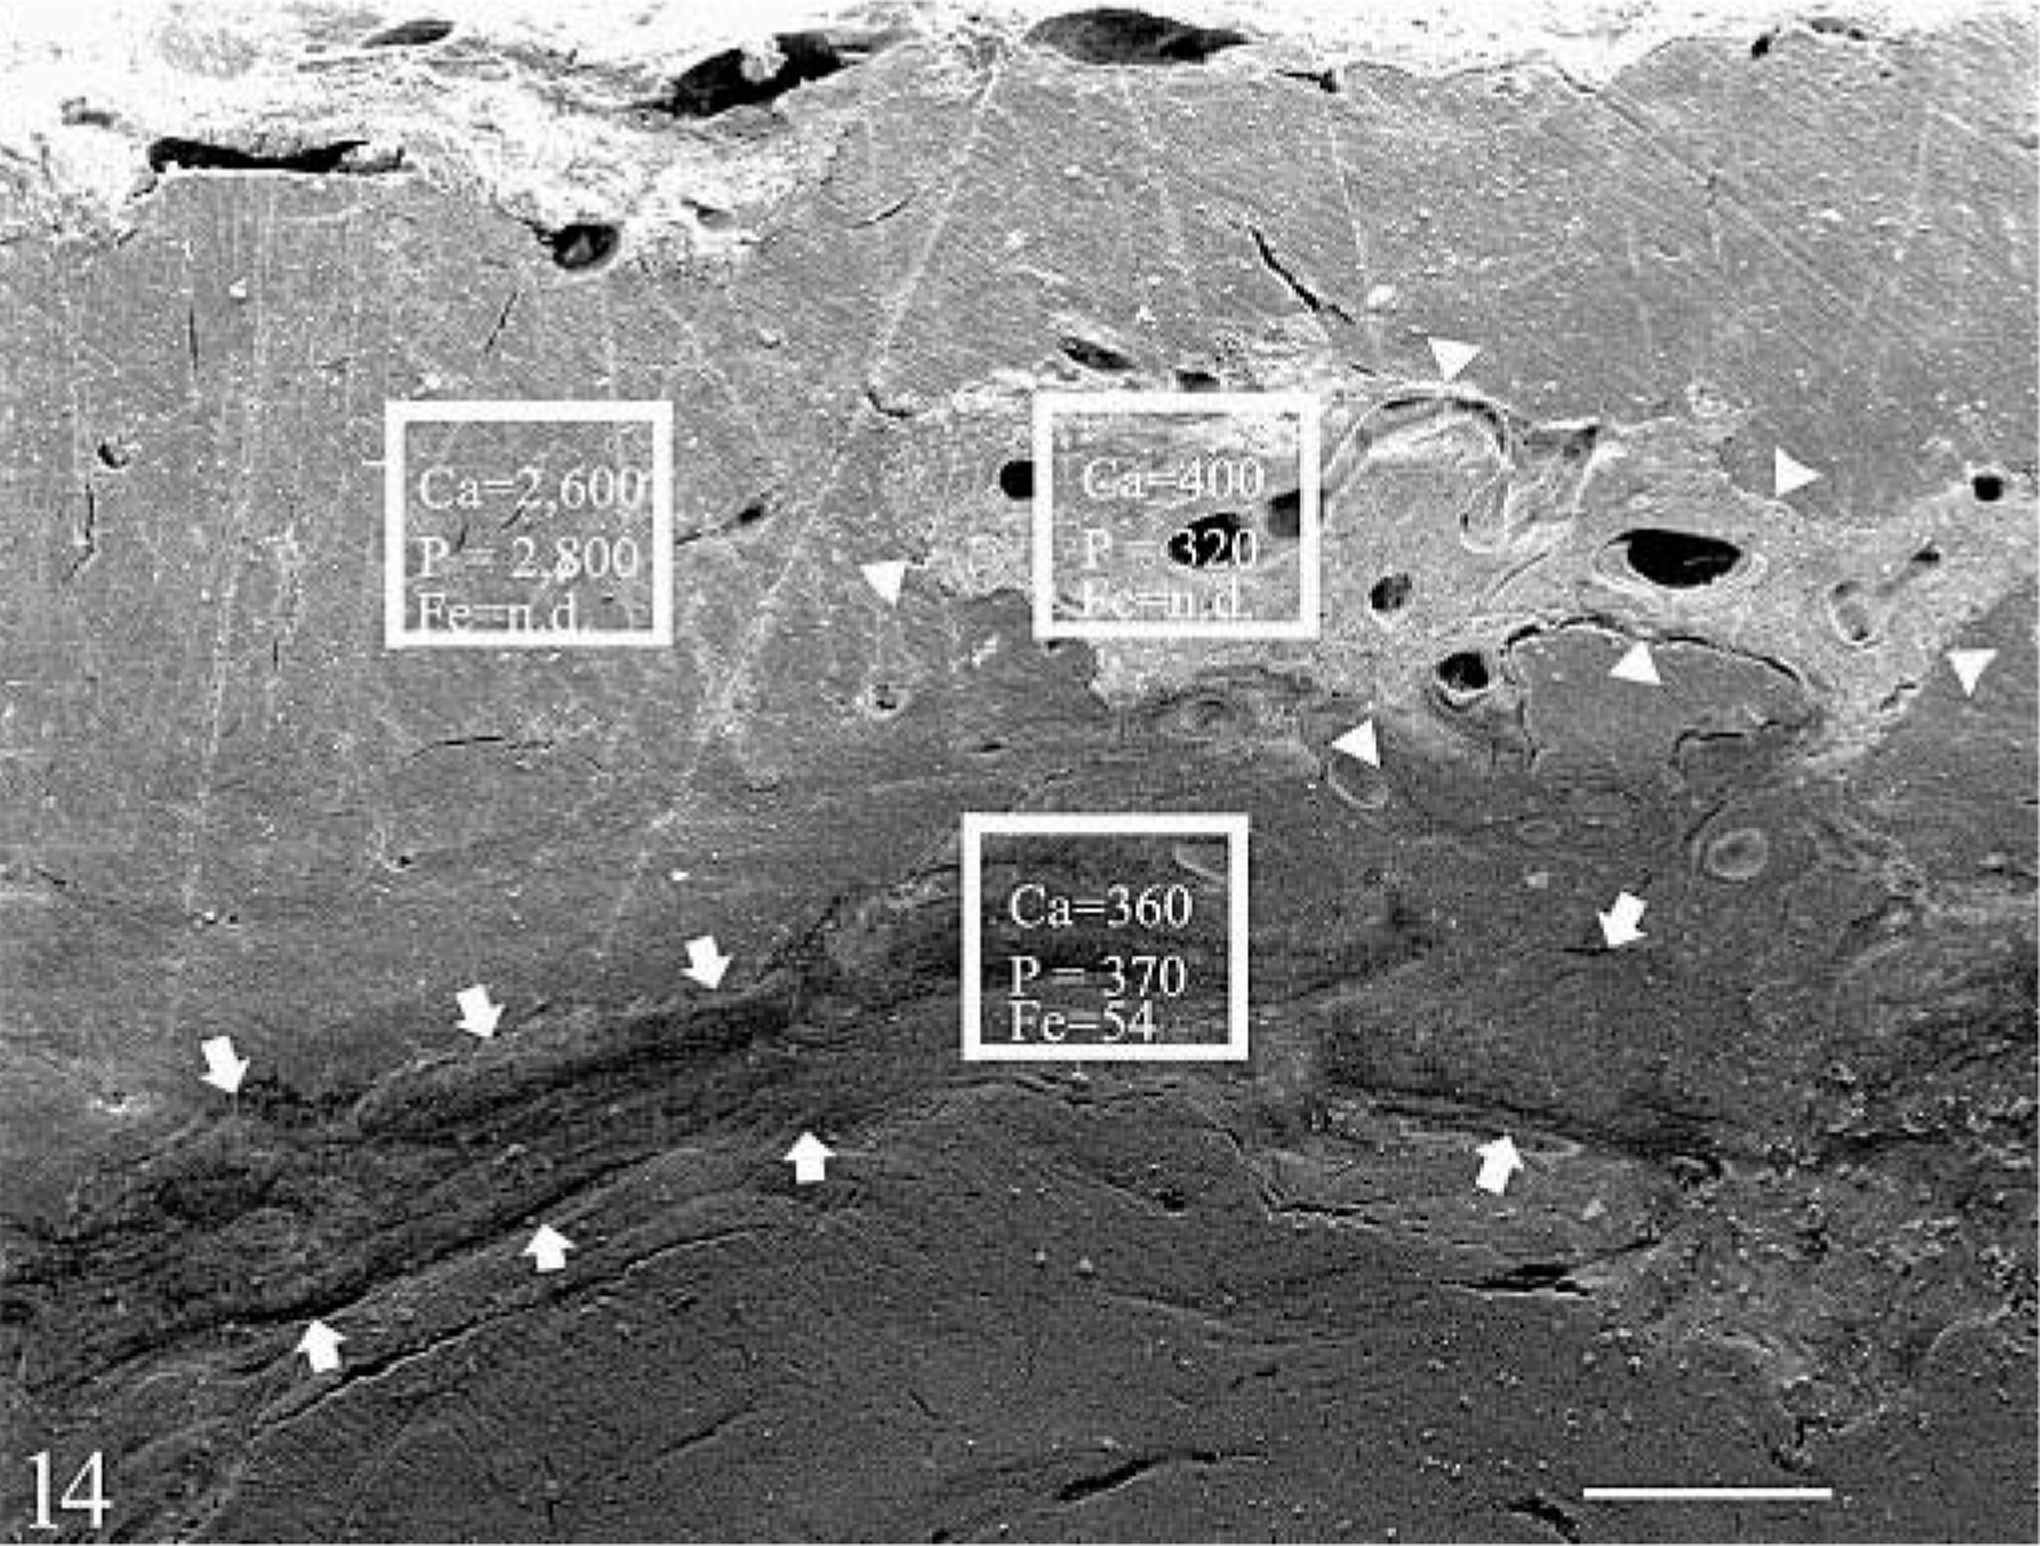
Mineral analysis
Bone percent ash was decreased (approximately 14%) in the outer third of the femoral cortex of the hemochromatosis-affected heifer No. 1 as compared with the unaffected control, heifer No. 2 (Fig. 15). Iron levels (ppm ash) in heifer No. 1 were 35 times higher in the inner cortex and 54 times higher in the outer cortex (Fig. 16). The calcium and phosphorus content of the ash was within the normal range and/or comparable to the control in both inner and outer cortex. This was also true for other elements analyzed: copper, manganese, molybdenum, zinc, and fluoride. Iron in liver of heifer Nos. 1 and 2 was 9,892 and 56 µg/g wet weight, respectively.
Percent ash/dry weight in samples from the inner two thirds and outer one third of femoral cortex from the hemochromatosis-affected heifer No. 1 (filled blocks) and unaffected control heifer No. 2 (open blocks). There was a decrease in mineral content in the outer cortex of the affected animal that corresponded to the layers of poorly mineralized bone seen radiographically.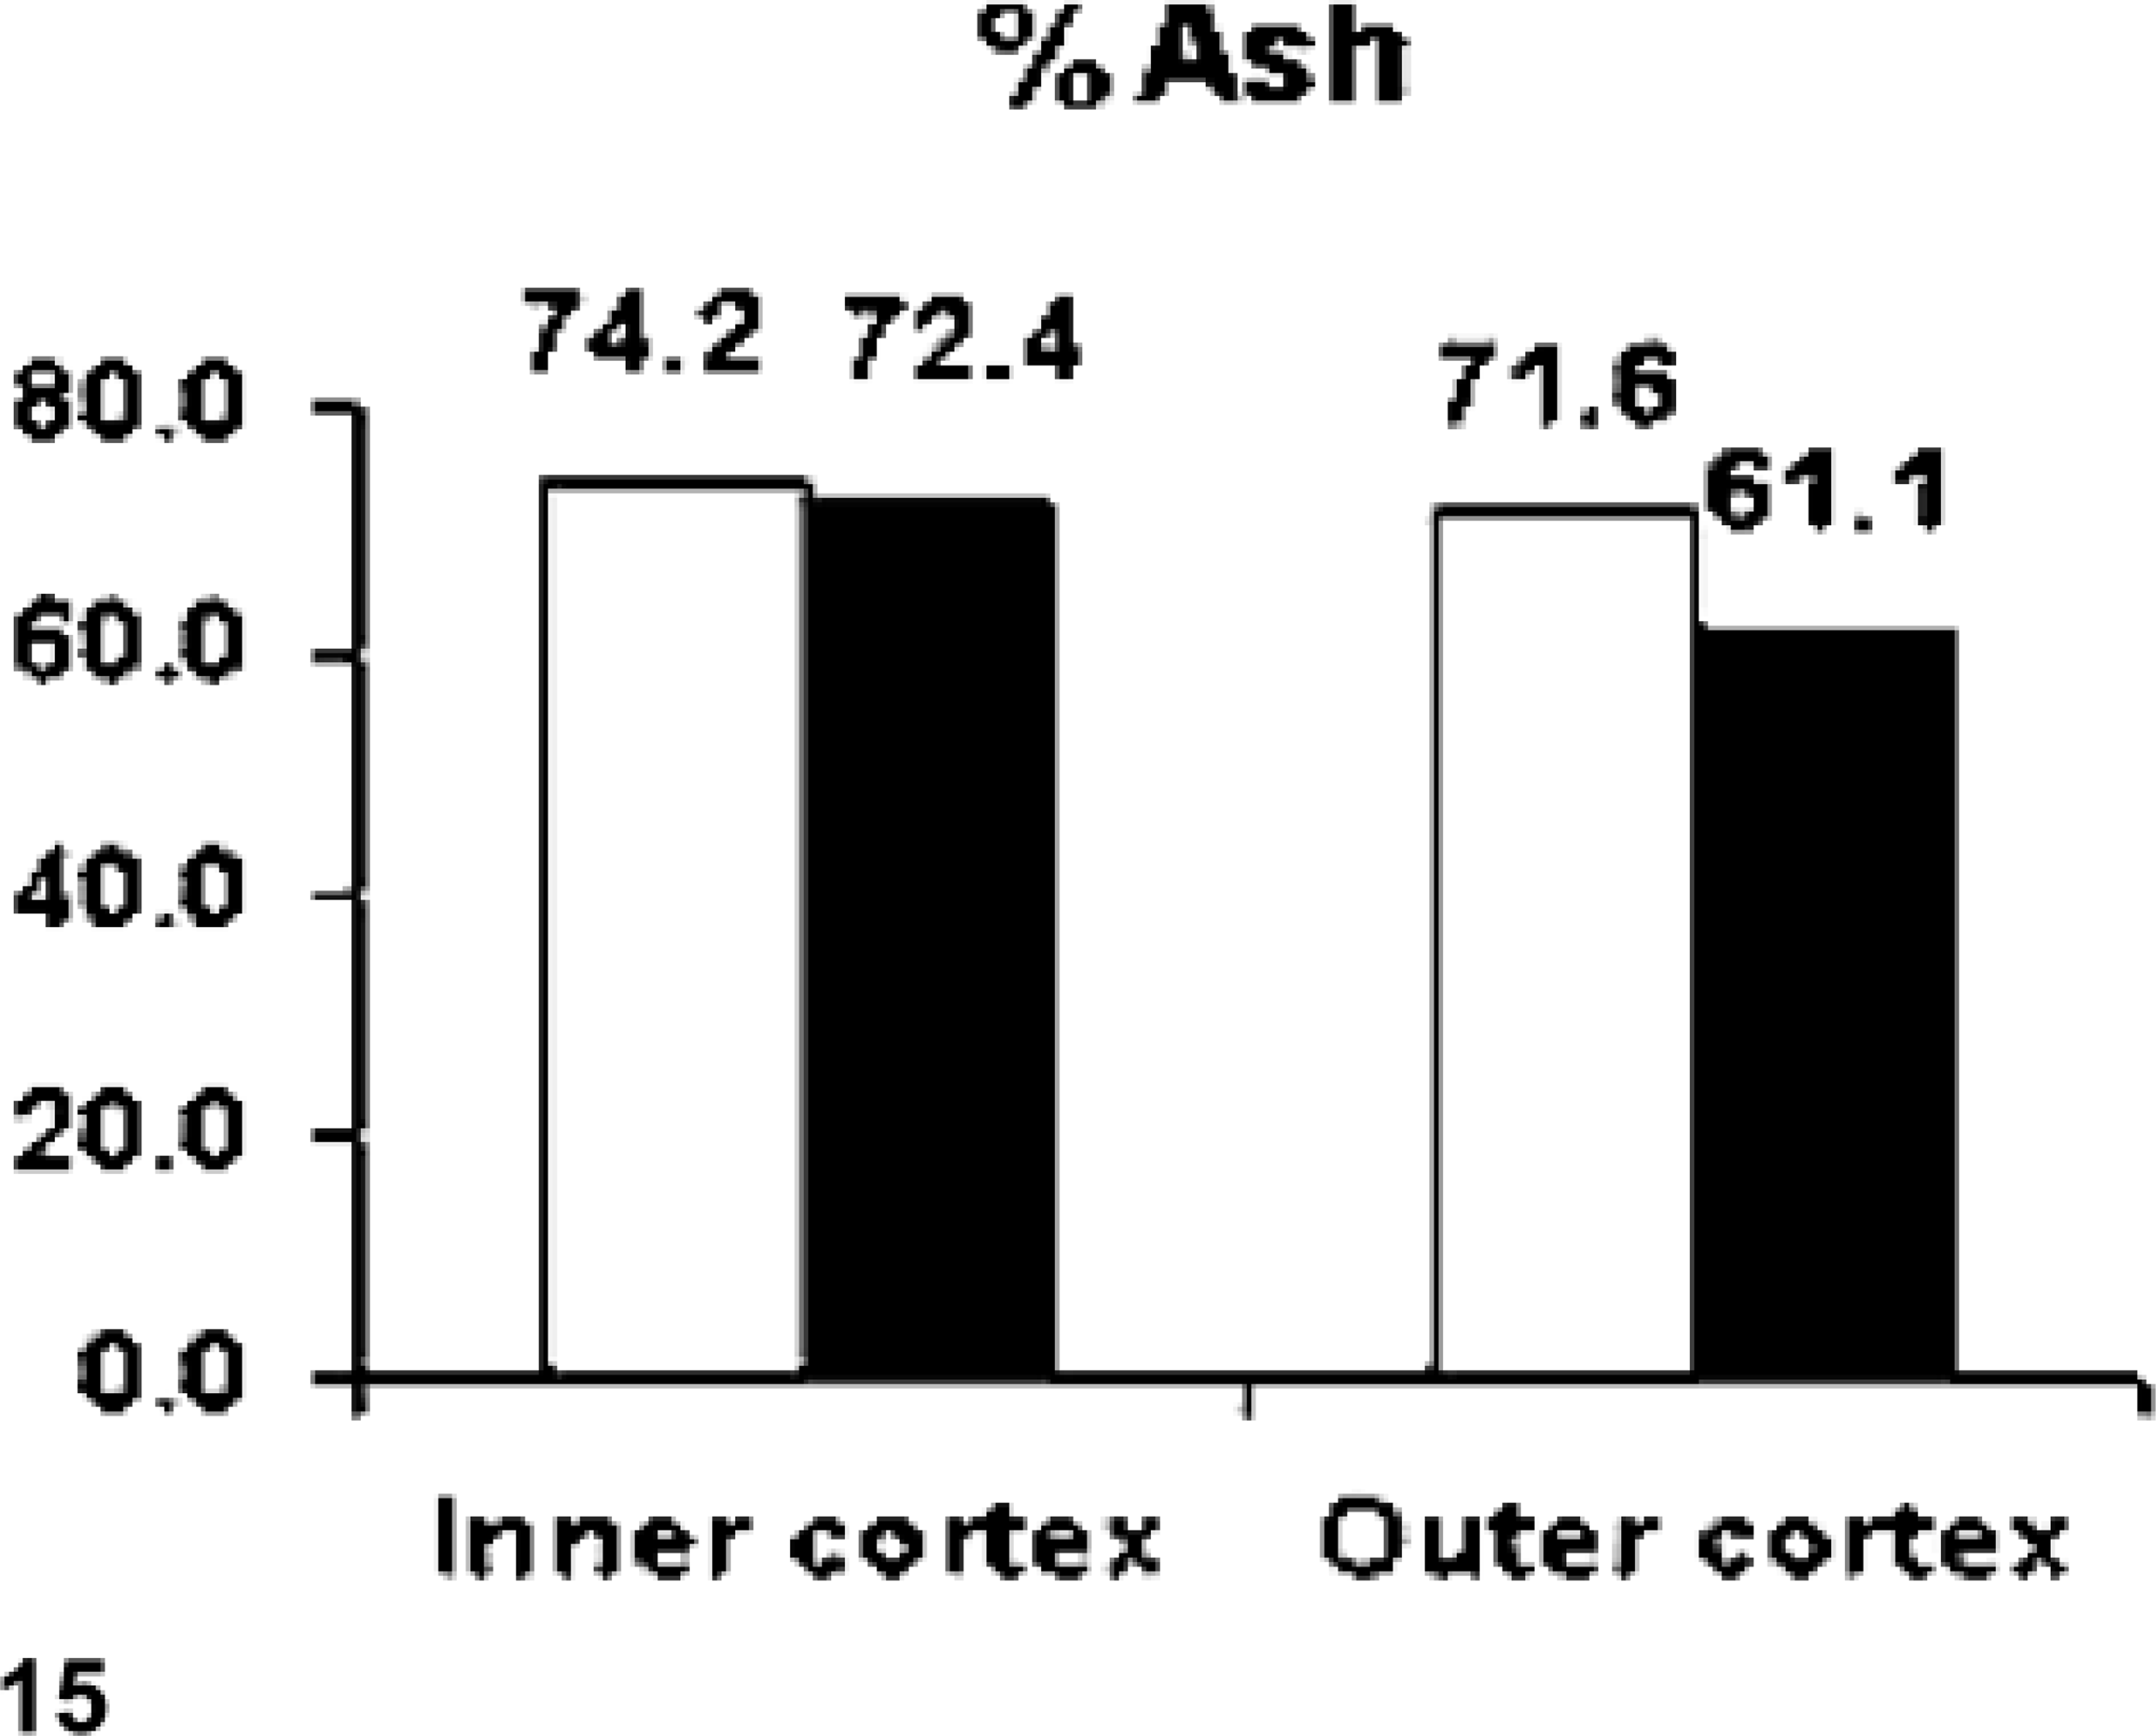
Iron content (ppm ash) in samples from the inner two thirds and outer one third of femoral cortex from the hemochromatosis-affected heifer No. 1 (filled blocks) and unaffected control heifer No. 2 (open blocks). There was markedly increased iron content in the hemochromatosis animal with the greatest difference in the outer cortex, where decreased mineralization was seen.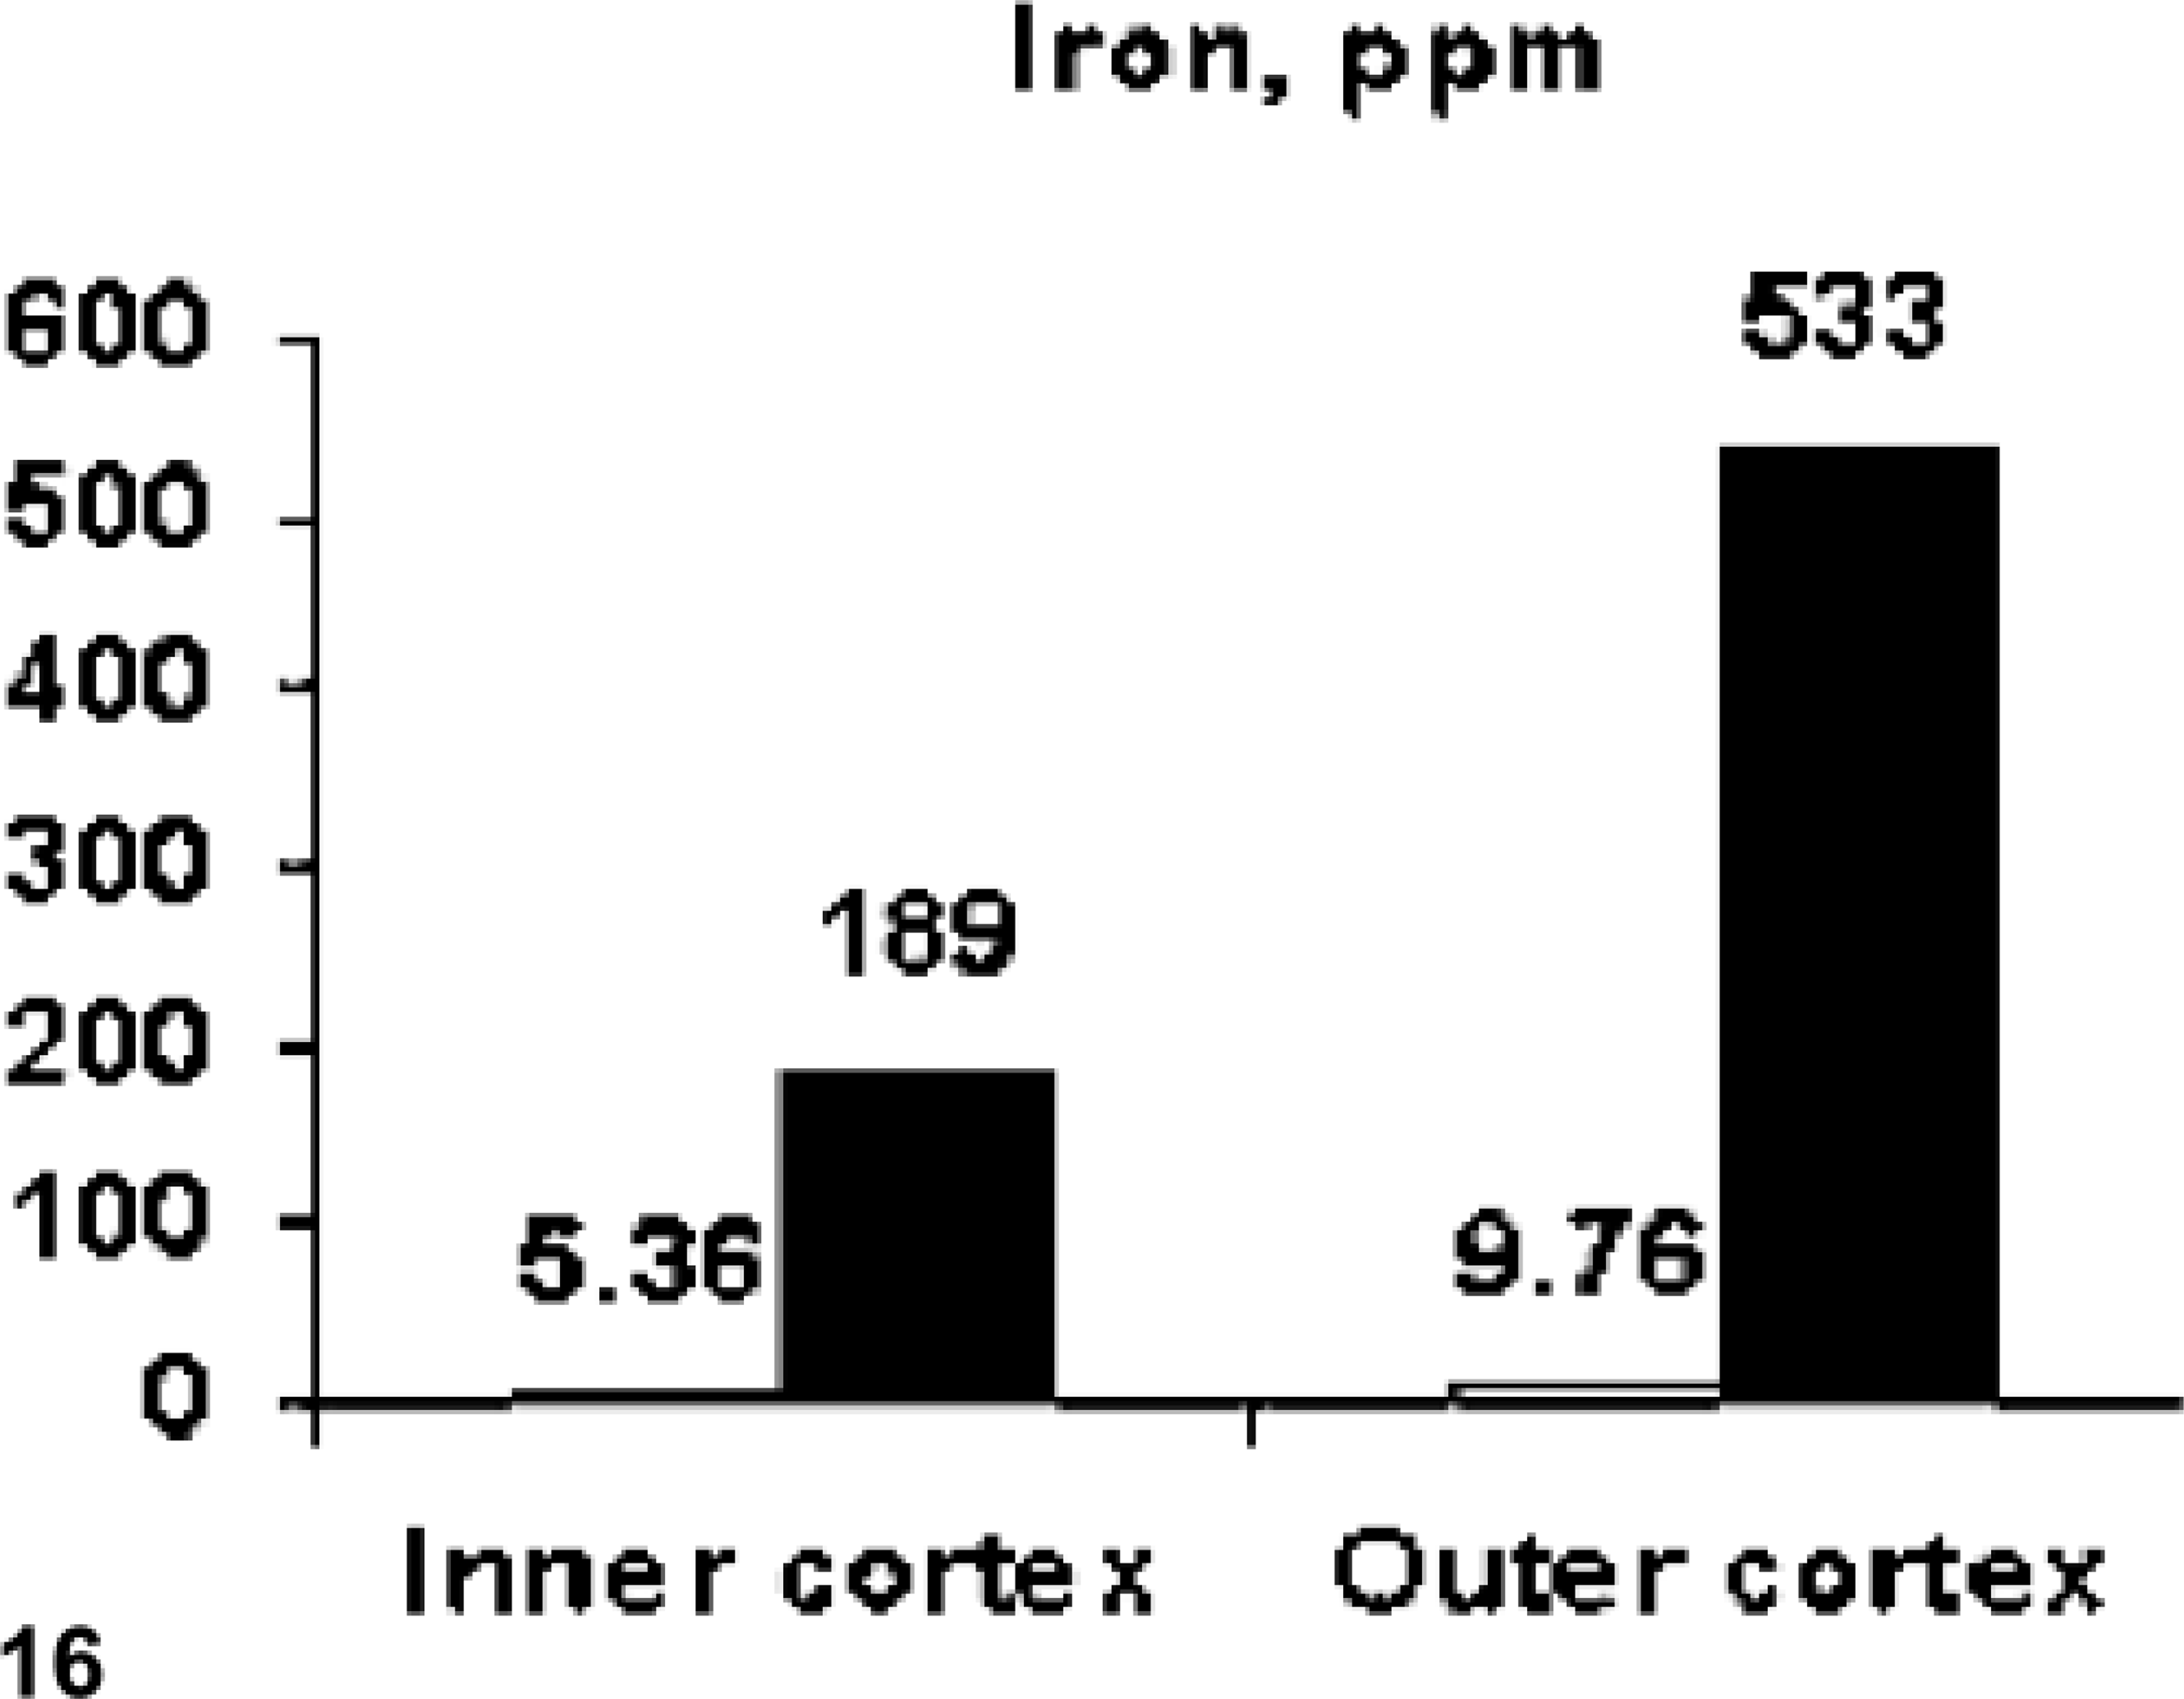
Discussion
Hemochromatosis in Salers cattle has been associated with loss of incisors and pliable bones in three of nine animals studied in detail. 16,20 A fibro-osseous periosteum with adherence of the skin to the skull has also been noted. 16 One 22-month-old animal with slightly discolored and more pliable skull bones had layers of poorly mineralized porotic bone in the outer cortex of the rib and an elevated iron content in the bone. 20 The affected Salers heifer studied in this report had 4+ iron accumulation in the liver, based on Conn's 4-point histologic grading system (0 = no stainable iron; 4+ = large iron-positive granules in virtually all hepatocytes), with no detectable hepatic fibrosis or necrosis. The animal was therefore in the early clinical stages of disease. It failed to gain as well as the control after 12 months of age and was approximately 70% of its size at 18 months of age when euthanatized. The decrease in longitudinal bone growth seen and measured histologically was no doubt responsible for the difference in bone length. Where measured in the rib, the formation rate was currently half that of the control. In the femur and tibia, the greater difference was probably exaggerated by the terminal loss of condition and immobilization when the hemochromatosis animal was non–weight bearing lame and then became recumbent because of fractures. This was probably also a factor in the greater suppression of MAR seen in the metacarpal cortex in the affected animal as compared with the control. This measure of cell-level bone formation rate was higher but still less than that of the control, in the femur. Here, there was an increased amount of osteonal labeling, perhaps associated with adaptation to the fracture in the contralateral limb.
The most striking finding in the bones was the dysplastic periosteal bone formation, which resulted in concentric layers of osteopenic, poorly mineralized bone matrix in the outer cortex. In some bones, this was associated with a relative increase in width or hyperostosis of the cortex. The rarefied bone was layers of underdeveloped plexiform bone between layers of normal bone that had been formed beneath the periosteum as outer circumferential lamellae. It stained like the overlying periosteal collagen with Masson's trichome stain, indicating differences in the organic matrix as compared with the normal layers. The fluochrome labels in the buried layers of the abnormal matrix represented ongoing mineral deposition. Labeling is present where oxytetracycline is taken up by chelatable calcium in amorphous forms of calcium phosphate before their conversion to crystalline hydroxyapatite. 21 The tan discoloration seen grossly in some bones was attributed to iron staining in these layers buried in the outer cortex. This was seen in the Perls'-stained ground sections of undecalcified bone. The presence of stainable iron in the woven bone cores of the immature matrix may represent a phenomenon in which ferric (3+) ions are stainable until they are incorporated into crystalline forms that become non-reactive. Iron staining has been reported at the mineralization front in both human hemochromatosis 6,9 and in experimental iron overload in pigs. 5 It has been shown that radioactive iron is first transiently deposited at the interface of mineralized bone with unmineralized osteoid matrix 17 and iron is adsorbed on hydroxyapatite crystals in the mineralized matrix. 2 The scanning electron microscopic studies confirmed the presence of iron in the hemochromatosis animal in areas of abnormal matrix with lower levels of calcium and phosphorus. The bone mineral analysis partially supports an association of iron accumulation with decreased mineral density. In the hemochromatosis animal, iron levels in the outer third of the cortex were over 50 times those in the control and there was 14% lower ash content in this sample. However, in the inner two thirds of the cortex where there was a 35-fold increase in iron, there was no osteopenia and little decrease in ash content relative to the control. Whether iron played a role in inhibiting formation or mineralization (or both) of these outer layers of plexiform bone needs further investigation. There was no evidence of a mineralization defect or osteomalacia in experimental iron overload in a 36-day study in young growing pigs. 5 Decreased bone formation was the most prominent histomorphometric finding in that study. Nor is osteomalacia seen in human hemochromatosis. 7,8 Osteoporosis is the primary finding and is seen in approximately one fourth 23 to one half 8 of human patients with hemochromatosis. It is characterized by decreased trabecular bone volume and decreased bone formation. 8–10,23 Even in those cases with severe hepatic cirrhosis and presumably secondarily decreased serum 25-hydroxyvitamin D and 1,25-dihydroxyvitamin D levels, no widened osteoid seams and osteomalacia was found. 7,8 The cortical bone of the radius is found to be thinner on densitometry, 4 and thinner cortices are seen on iliac crest biopsy. 9 It has been proposed that increased iron decreases osteoblast function by generating superoxide radicals and hydrogen peroxide production, but an in vitro study showed that relatively high concentrations were necessary to produce any effect on bone cells. 6
Arthritis is also a feature of human hemochromatosis 15 and affects up to 80% of patients. 19,23 Both small, e.g., metacarpophalangeal joints, and larger joints can be involved. Changes vary from chondrocalcinosis, i.e., calcium pyrophosphate deposition in cartilage, to femoral head necrosis with characteristic cartilage separation and iron deposition in synovial tissue. 1,19,23 No joint lesions were detected in the Salers animal of this study, and no iron deposits were seen with Perls' stains in the cartilage, synovium, or meniscal tissue examined. The absence of joint lesions was consistent with previous findings 16,20 and may reflect the young age of animals that have been studied.
Although the bones were shorter, the width of cortex in the hemochromatosis animal was greater in most long bones (Table 1). This was due primarily to periosteal hyperostosis and formation of layers of different radiographic density in the outer third of the cortex. This is supported by the nearly equal outer diameter of the cortex, i.e., periosteal bone growth, in the affected animal as compared with the control (89–96% of mean periosteal diameter as estimated from perimeters in data from Table 1; data not shown). In some cases, endosteal bone formation or modeling imbalance, with lack of normal endosteal expansion, contributed to cortical thickening as well. Morphologically, however, the changes were most striking in the periosteal envelope, where there was a greater amount of plexiform bone formation.
The layering of hypomineralized, dysplastic bone between more normal bone in the outer cortex is unexplained. The lack of mineralization could be considered osteomalacia but was localized to these layers of abnormal bone. This was seen in previous studies 20 and indicates that intermittent abnormal periosteal matrix apposition and mineralization is a characteristic of hemochromatosis. There was no difference in diet or management of the affected animal as compared with the half-sibling control. A decrease in weight gain after 12 months of age was noted, and this corresponds to the presence of lesions in the outer cortex, which contains the more recently formed bone. There was no change in dietary iron during this time, and both animals were on a primarily roughage diet. Possibly, there were fluctuating systemic iron levels associated with the metabolic defect or iron accumulation to threshold levels that produced intermittent interference with bone formation. This was not studied directly, and there is no evidence of this from other studies. Alternatively, the effect on bone formation is a direct genetic defect and not secondary to iron accumulation. In either case, there was most extensive involvement of the periosteum. It is recognized that the periosteal envelope is particularly reactive and the principal site of change in specific conditions such as fluorosis and hypertrophic osteoarthropathy. 13,14 In hemochromatosis, the greater involvement of the periosteum may be because there is more plexiform bone formation in this envelope.
Plexiform bone formation in the periosteum is characteristic of rapidly growing animals. 18 The defect in the hemochromatosis animal appears to be the lack of filling-in the brickwork pattern of woven bone with adequately mineralized lamellar bone. This led to osteopenic layers between more normal, mineral-dense bone. It is known that mechanical forces play a role in directing bone formation, 18 and the radial angulation of the plexiform bone in the mandible suggests that this was a factor in its formation. The layering of more- and less-rigid bone would represent shear planes through which cleavage could be initiated in pathologic fractures. This would account for the large split fragments of cortex in the humeral butterfly fracture and the intracortical splitting and separation seen in the femoral fracture and the green stick fracture in the rib.
Incisor loss has been noted in previous studies of hemochromatosis 16,20 and was present in the affected animal studied here. Radiographs confirmed the osteopenia and resorption in the roots of incisors. Histologically, resorption of cementum and dentin in the roots was found in premolars as well. This was present only in the hemochromatosis animal and not in the age-matched control. The findings suggest that instability associated with the osteopenia is the inciting factor in the premature tooth resorption.
These studies indicate that the skeletal changes in hemochromatosis of Salers cattle are due to abnormal bone development. The changes have a unique pattern that can be helpful diagnostically and can lead to severe pathologic fractures clinically.
Footnotes
Acknowledgements
We thank Ms. Cathy Bedwell for mineral analysis of bone and Dr. Merl Raisbeck for chemical analysis of liver.