
Abstract
We studied the effects of Narthecium ossifragum on goat kidneys. Twenty-five Norwegian dairy goats, 5 weeks to 4 months of age, were orally dosed with an aqueous extract from N. ossifragum. In experiment 1, we studied microscopic and functional changes in 12 animals that were euthanatized 2, 3, 4, 5, and 6 days after treatment. In experiment 2, we included ultrastructural studies on serial renal biopsies and urine analysis from five extract-treated animals and two controls. In addition, urine samples were collected from four dosed and two control goats. Ultrasonography revealed perirenal and retroperitoneal fluids. Microscopic changes were observed after 6 hours. The findings, most obvious in the inner cortex and the outer medulla, consisted of cytoplasmic vacuolization, interstitial edema, and focal necrosis of tubular epithelial cells. Ultrastructurally, the tubules had loss of microvilli, irregular cytoplasmic vacuolization, mitochondrial swelling with loss of cristae, and irregular but continuous basement membranes even with necrosis. In the glomeruli, there were occasional endothelial damage and shortening and swelling of the foot processes. Peritubular capillaries had breaks in the vessel walls and irregular endothelial cell edema, and the interstitium had marked edema. The functional lesions included elevated serum urea, creatinine, and magnesium concentrations, a slight decrease in serum calcium concentration, elevated urine protein and urine protein-creatinine ratio, and increased activities of urine alkaline phosphatase and gamma glutamyl transferase. Our findings indicate a fast-acting toxic principle inducing damage by both direct toxic and secondary ischemic effects.
Introduction
Narthecium ossifragum, a perennial herb of the lily family, causes alveld, a hepatogenous photosensitization disorder in sheep. The plant has also been associated with osteomalacia in cattle, therefore the species name ossifragum. 18
Several cases of severe bovine diseases related to ingestion of this plant were reported in Ireland in 1989, 22 and in 1992, similar such cases of disease were reported in cattle on pastures in Norway. 9 , 10 Clinical signs were depression, anorexia, melaena or fresh blood in the feces, and often diarrhea, leading to death in many cases. Serum urea and creatinine concentrations were elevated. Postmortem examination revealed renal tubular necrosis. Clinical signs combined with pathologic findings indicated intoxication. N. ossifragum was found in all pastures examined for toxic plants and mushrooms, and it was suggested to be the cause of this disease.
Studies 11–13 , 22 have confirmed experimentally that N. ossifragum extract causes similar effects in cattle, sheep, and goats; the active principle has been identified as 3-methoxy-2(5H)-furanone (3M2F). 19
In Japan, the plant Narthecium asiaticum causes intoxication in cattle, with clinical, biochemical, and pathologic changes similar to those described for N. ossifragum–intoxicated cattle. 28 3M2F is also isolated from this plant. 15
The present study reports the development of renal dysfunction and renal microscopic and ultrastructural changes in biopsies from goats experimentally intoxicated with 3M2F.
Materials and Methods
Plant extract
An aqueous extract was produced from N. ossifragum flower stems that were harvested during the flowering period in different geographic locations. The plant material was frozen at −20 C on the day it was collected and kept frozen until the extract was made. The extraction was carried out as follows: liquid nitrogen was added to the flower stems, and the brittle tissue was chopped finely in a Robot coupe R 301 Ultra (Robot Coupe, S.A., Montceau en Bourgogne, France). The chopped material was suspended in purified water (2 liters per kilogram plant material wet matter) and shaken in bottles on a universal flask-shaking machine (Edmund Bühler S; 25, Tübingen, Germany) for 2 hours. The mixture was centrifuged in 250-ml cups for 15 minutes at 10,000 rpm on a Sorvall SS-4 centrifuge (Du Pont Company, Wilmington, DE). The supernatant was vacuum filtered through number 1 Whatman filter. The product of a second similar extraction of the plant residue in 1 liter of water per kilogram plant material was combined with that from the first extraction to constitute the aqueous extract, thus giving 2.3 ml extract per gram plant material.
At the time experiment 1 was carried out, an analytic method for the estimation of 3M2F in the extract was not developed, and the concentration of 3M2F could not be measured. In experiment 2, the extract was produced in the same way as in experiment 1, and the concentration of 3M2F was measured to 454 μg/ml by the method of Langseth et al. (1999). 19
Animals
Experiment 1
Twelve Norwegian dairy goats (Nos. 1–12), 8 males and 4 females, 3–4 month old, 12.5- to 22.5-kg body weight (mean 17.2 kg), were randomly divided into two groups: 10 goats in the experimental group (Nos. 1–10) and two in the control group (Nos. 11 and 12). All the goats were from the same herd and were maintained on the same diet in the same environment for 2 months before dosing. They were fed sour milk, concentrate (Formel Favør 30, Felleskjøpet), and hay ad libitum. The project was approved by the ethical committee at the Norwegian School of Veterinary Science.
On day 0, the goats in the experimental group (Nos. 1–10) were dosed with an aqueous extract from 30 g N. ossifragum per kilogram body weight using stomach tube. This was considered to be a realistic dose for ruminants on pasture. 11 The extract was given in two doses within 2 hours to avoid too large volumes. The goats were observed several times every day for any changes in appetite or behavior and for signs of disease.
Blood samples were taken from all animals 7 days before dosing (day 0) and every day until the goats were euthanatized. Serum samples were analyzed for urea, creatinine, calcium, and magnesium concentrations on a Technicon Axon (Technicon, Dublin, Eire) at 37 C. All analyses were performed by standard methods at the Central Laboratory, Norwegian School of Veterinary Science (Internordic control by Labquality, Helsinki, Finland).
Two goats were euthanatized on day 2 (Nos. 1 and 2), two goats on day 3 (Nos. 3 and 4), three (including one control animal) on day 4 (Nos. 5, 6, and 11), two on day 5 (Nos. 7 and 8), and three (including one control animal) on day 6 (Nos. 9, 10, and 12). The animals were euthanatized by captive bolt stunning and immediate exsanguination. A complete necropsy was performed on all animals. Heart, lung, liver, kidney, small intestine, and large intestine tissues were fixed in 4% neutral buffered formaldehyde and processed routinely for light microscopy. Sections were cut at 5 μm and stained with hematoxylin and eosin, periodic acid–Schiff, and Van Gieson.
Experiment 2
Thirteen Norwegian dairy goats (Nos. 13–25) from the same herd, 11 males and two females, 5–7 week old, 6- to 11-kg body weight (mean 8.5 kg), were included. Four goats were kept as controls throughout the experiment (Nos. 22–25). Two of these were anesthetized, and renal biopsies were taken on the same days as extract-treated animals (Nos. 23 and 24). The other two controls were only anesthetized (Nos. 22 and 25). The diet, the dosing procedure, and the clinical observation were identical to those of experiment 1, and the concentration of 3M2F was calculated to 454 μg/ml. Blood samples were taken and analyzed as in experiment 1. Urinary samples were obtained by cystocentesis on the day before administration of dose, on the day of administration of dose, and subsequently for 3 days. The urine samples were analyzed for the concentrations of urinary protein and creatinine and activities of alkaline phosphatase (ALP) and gammaglutamyl transferase (GGT) by standard methods at the same laboratory as described in experiment 1. The urinary protein-creatinine ratio was calculated. This parameter is closely correlated with 24-hour urinary protein excretion. 21
Biopsy procedures
Only seven (Nos. 13–17, 23, 24) of the 13 animals were biopsied to avoid contamination of the urine samples with blood. Kidney biopsies were taken 1 day before administration of N. ossifragum extract (baseline biopsies) and 6, 24, 48, and 72 hours after administration in five extract-treated goats (Nos. 13–17) and in two control goats (Nos. 23 and 24). Two biopsy punctures were done on each animal at each time. Before biopsies, the goats were anesthetized by an intramuscular injection of a combination of xylazine (0.4 mg/kg) and ketamine (8 mg/kg). On the 1st day, the animals were clipped on the ventral and lateral abdomen. Every time the biopsies were taken, the goats were given 0.51 Ringers acetate solution i.v. during and after the biopsy procedure. Ultrasound-guided percutaneous renal biopsies were taken using a nondisposable full-cut biopsy instrument (Bard® Biopty-Cut®) with a disposable 14-gauge needle. Renal ultrasonography (ATL HDI 3000) was performed on all goats. The animals were kept in lateral recumbency during biopsy. Both kidneys were sampled, and biopsies were taken from different regions of the kidney each time.
From each animal, one biopsy specimen was fixed in 4% neutral buffered formaldehyde and processed routinely for light microscopy. Sections were prepared as described in experiment 1. One biopsy specimen was fixed in 2% glutaraldehyde in 0.1 M cacodylate buffer with 0.1 M sucrose, pH 7.4. The biopsies were then postfixed in 2% osmium tetroxide in 0.1 M cacodylate buffer, dehydrated in graded ethanols, and embedded in epon LX112. Semithin sections were stained with toluidine blue, and ultrathin sections were stained with uranyl acetate and lead citrate and examined in a Philips FEI 120 electron microscope.
One goat was euthanatized on day 3 (No. 15) because of animal welfare reasons. The rest were euthanatized on day 7 by captive bolt stunning and exsanguinations. A complete necropsy was performed on all animals.
Results
Results for experiments 1 and 2 are described together.
Clinical findings
All the animals in experiment 1 had normal appetites and were in good condition throughout the experiment. In experiment 2, the animals showed varying degrees of reduced appetite, depression, and illness. No difference in response was observed between sexes. One control animal (No. 23) had fever and inappetence on days 2 and 3 and was given (900,000 IE) penicillin i.m. and (100 mg/20 mg) sulfadoxin-trimethoprim i.v. for 3 days.
Ultrasonographic examination
Throughout the trial, kidneys were normal sized, had normal cortical echogenicity, and retained corticomedullary differentiation. Abnormal perirenal fluid accumulation was seen in six (Nos. 14, 16, 17, 19–21) out of nine goats. The first signs of perirenal fluid accumulation on ultrasound were on day 2 in three goats (Nos. 14, 17, and 21) and on day 3 in another three goats (Nos. 16, 19, and 20) (Fig. 1). In one animal (No. 21), fluid collection in the perirenal space extended into the adjacent retroperitoneal space (Fig. 2). Goat No. 23 showed signs of peritonitis on days 2 and 3.
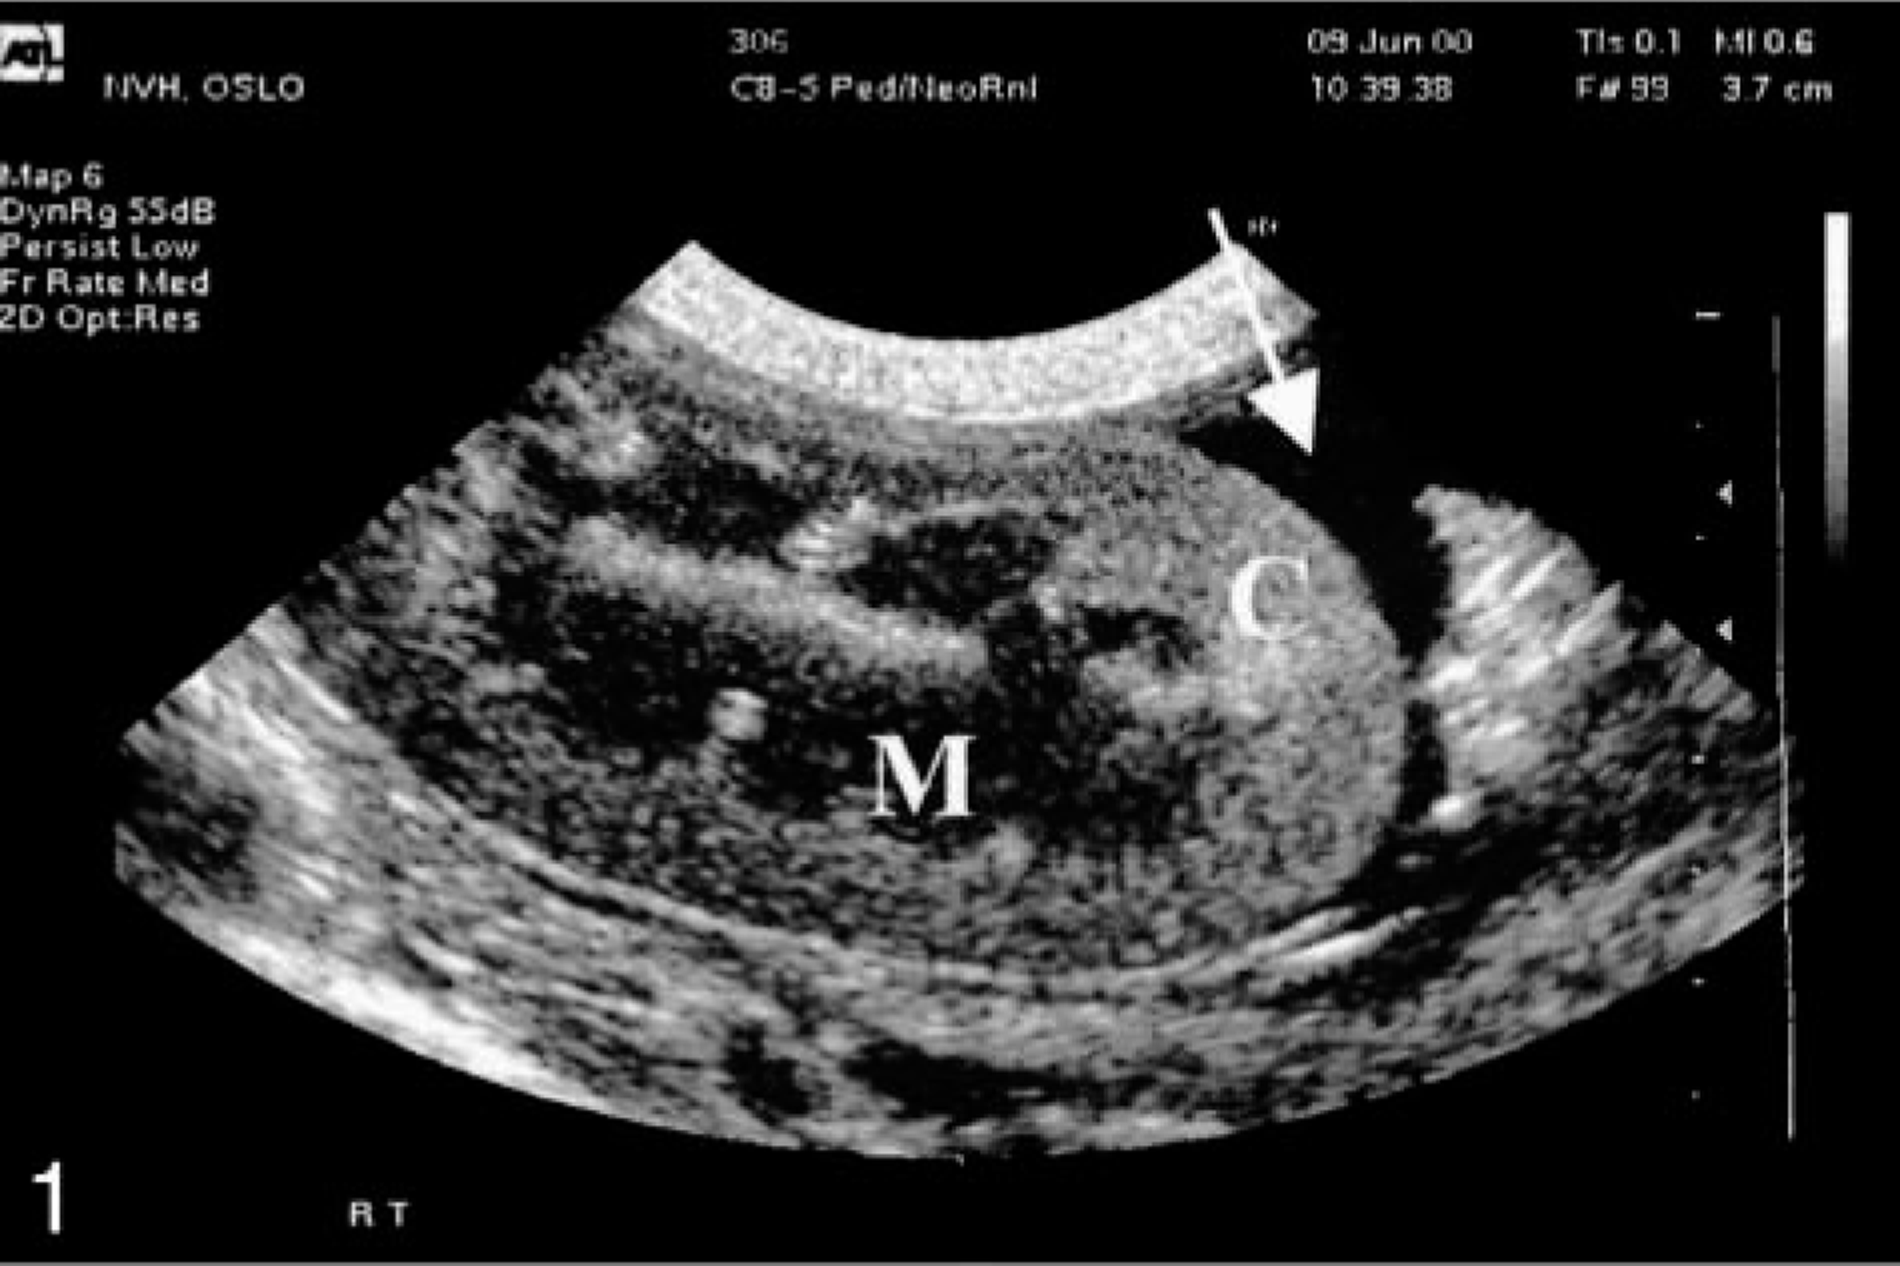
Kidney; goat No. 21. Ultrasonographic illustration of a kidney 3 days after dosing with the aqueous extract from N. ossifragum. Note perirenal fluid accumulation (arrow). C, cortex; M, medulla.
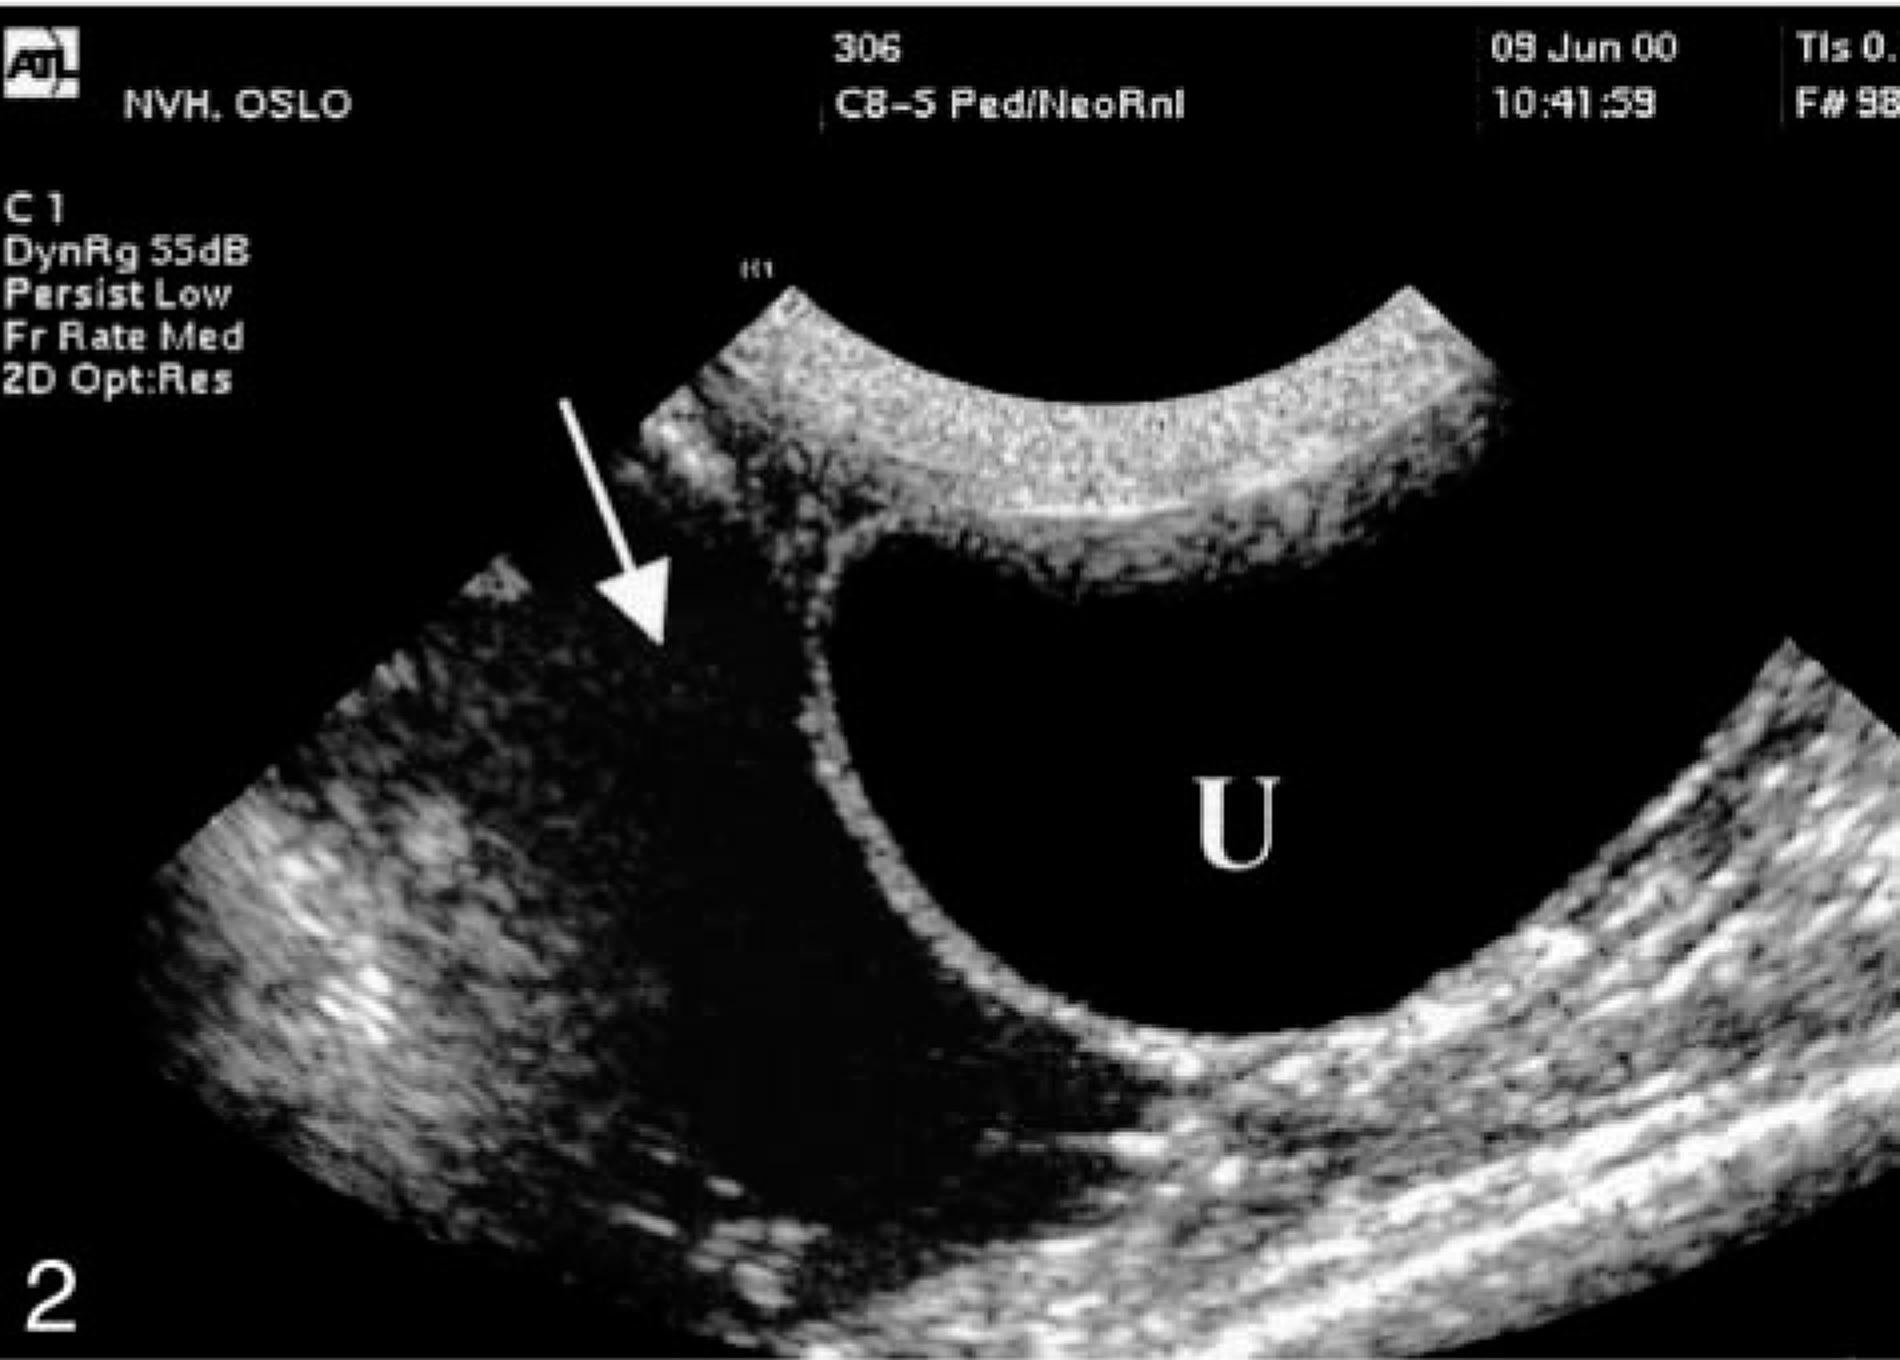
Kidney; goat No. 21. Ultrasonographic renal examination 3 days after extract dosing shows that the fluid accumulation has extended into the retroperitoneal space (arrow). U, urinary bladder.
Gross pathology
In both experiments, all animals appeared to be in normal condition. The treated goats' kidneys in experiment 1 were pale and some had a moderately dilated pelvis, and the cut surface was wet and glistening. The goats in experiment 2 (including the animal euthanatized on day 3) had pale kidneys with perirenal edema and dilated pelvis with accumulation of edema fluid. The seven goats in the biopsy group had hemorrhages in the perirenal tissue and had blood-filled channels and necrotic areas in the kidneys, related to the biopsy procedure. Some goats had small focal hemorrhages in the urinary bladders. One goat (No. 13) had a perforating vulnus in the rumen, surrounded by a focal fibrinopurulent peritonitis. There was no leakage of ruminal content into the abdominal cavity. In goat Nos. 23 and 24, focal purulent peritonitis and adhesions between the gastrointestinal tract and the abdominal wall were found. No gross changes were seen in the other organs examined.
Histopathology
The histologic specimens from the necropsies in experiment 1 were similar to those described in experiment 2 in detail. More leukocytes, mainly mononuclear cells, were seen in the kidneys of goats from experiment 1.
Representative biopsies were obtained from all animals in experiment 2. The first biopsy, 6 hours after dosing, had microscopic changes. The most obvious changes were in the proximal tubules in the inner cortex and the outer medulla and consisted of cytoplasmic vacuolization of tubular epithelial cells. After 24 hours, the vacuolization was more pronounced, with swelling and detachment of epithelial cells. Focal areas had tubular necrosis. After 48 hours, interstitial edema, more extensive necrosis of tubular epithelial cells, and dilated tubules with accumulation of eosinophilic homogenous material in tubular lumina were seen. Varying degrees of dystrophic mineralization was observed in necrotic areas. After 72 hours, all the lesions were more severe, and the necrotic areas were larger (Fig. 3). Tubule dilation and amounts of eosinophilic material in the tubular lumina were increased from day 3 after dosing.
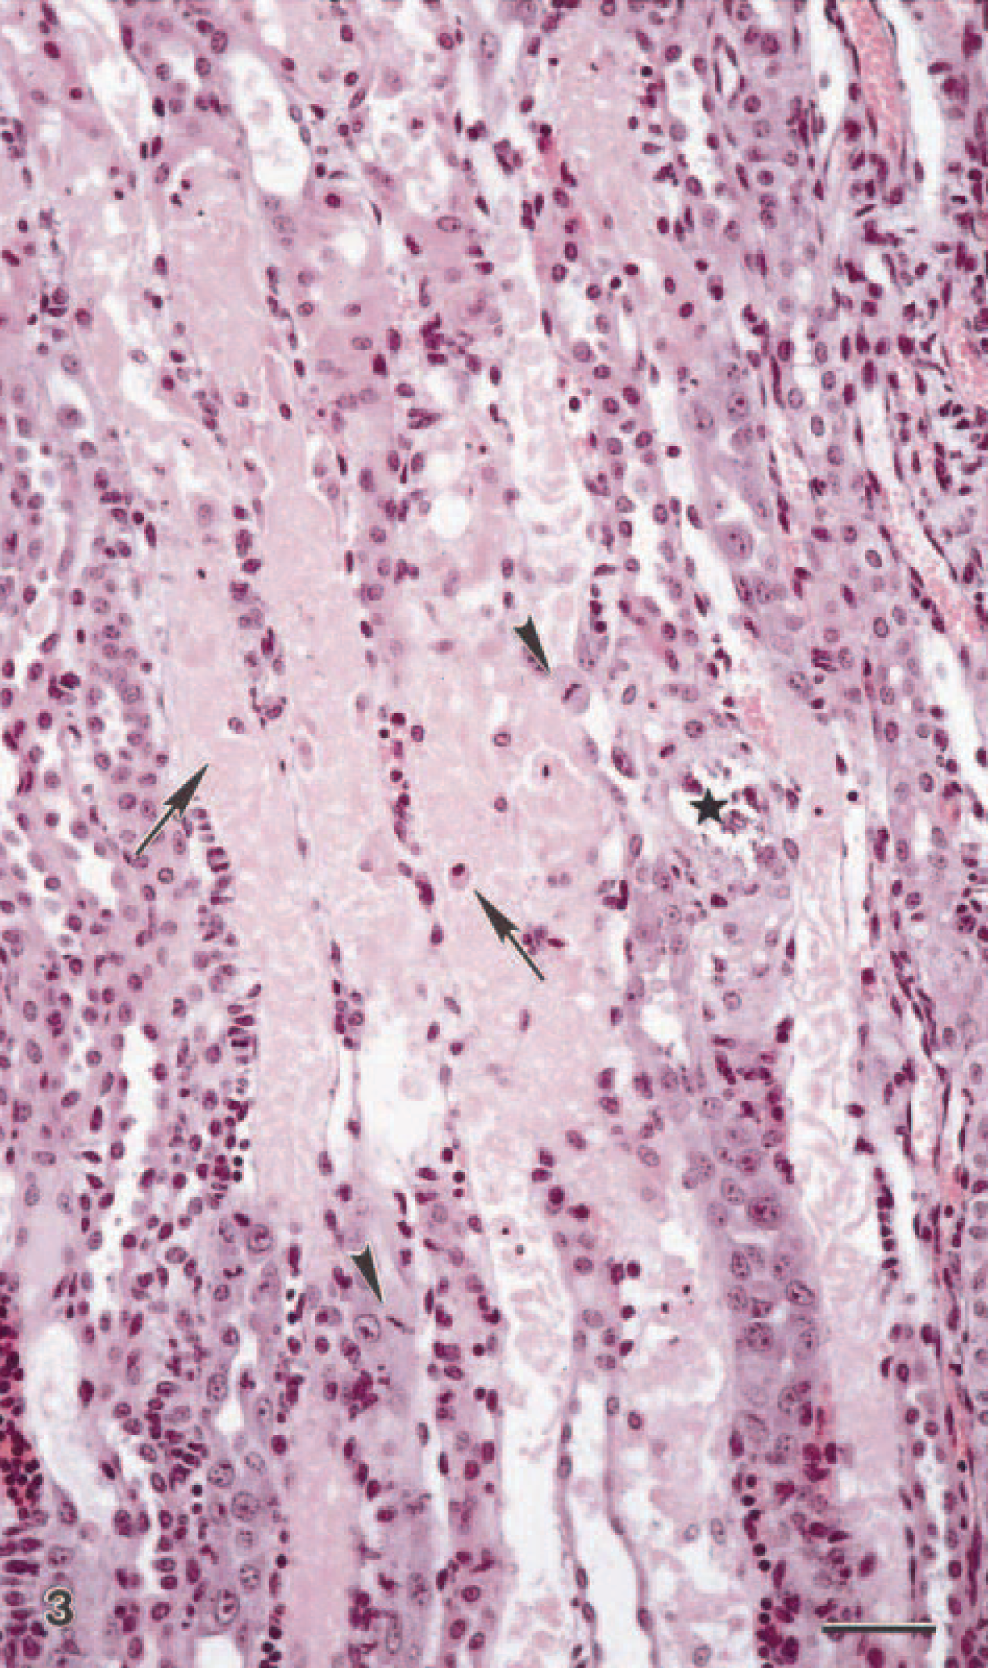
Kidney; goat No. 3. Light micrograph of kidney from a goat 72 hours after extract dosing. Necrosis of tubular epithelial cells (arrows) in straight portions of the proximal tubules and focal mineralization (∗). Note areas with mild hypertrophy of tubular epithelial cells. Mitotic activity (arrowheads). HE. Bar = 48 μm.
In contrast to experiment 1, minimal signs of inflammation were seen in experiment 2. Regenerative changes, seen as proliferation and hypertrophy of tubular epithelial cells with hyperchromatic nuclei and basophilic cytoplasm, and increased mitotic activity were observed from day 3. Interstitial fibroblast proliferation was observed from day 4. Microscopic lesions were not seen in tissues of heart, lung, liver, and intestines.
Electron microscopy
Glomeruli
Typically for goats, the untreated baseline biopsies had mesangial regions that were pronounced with many mesangial cells. 23 , 27 Dense deposits were not observed. The capillary walls showed well-preserved fenestrated endothelium (Fig. 4, inset) closely attached to the basement membrane. The foot processes varied in height and shape but were mostly taller as demonstrated in Fig. 4, inset. No accumulation of leukocytes or platelet aggregates was observed.
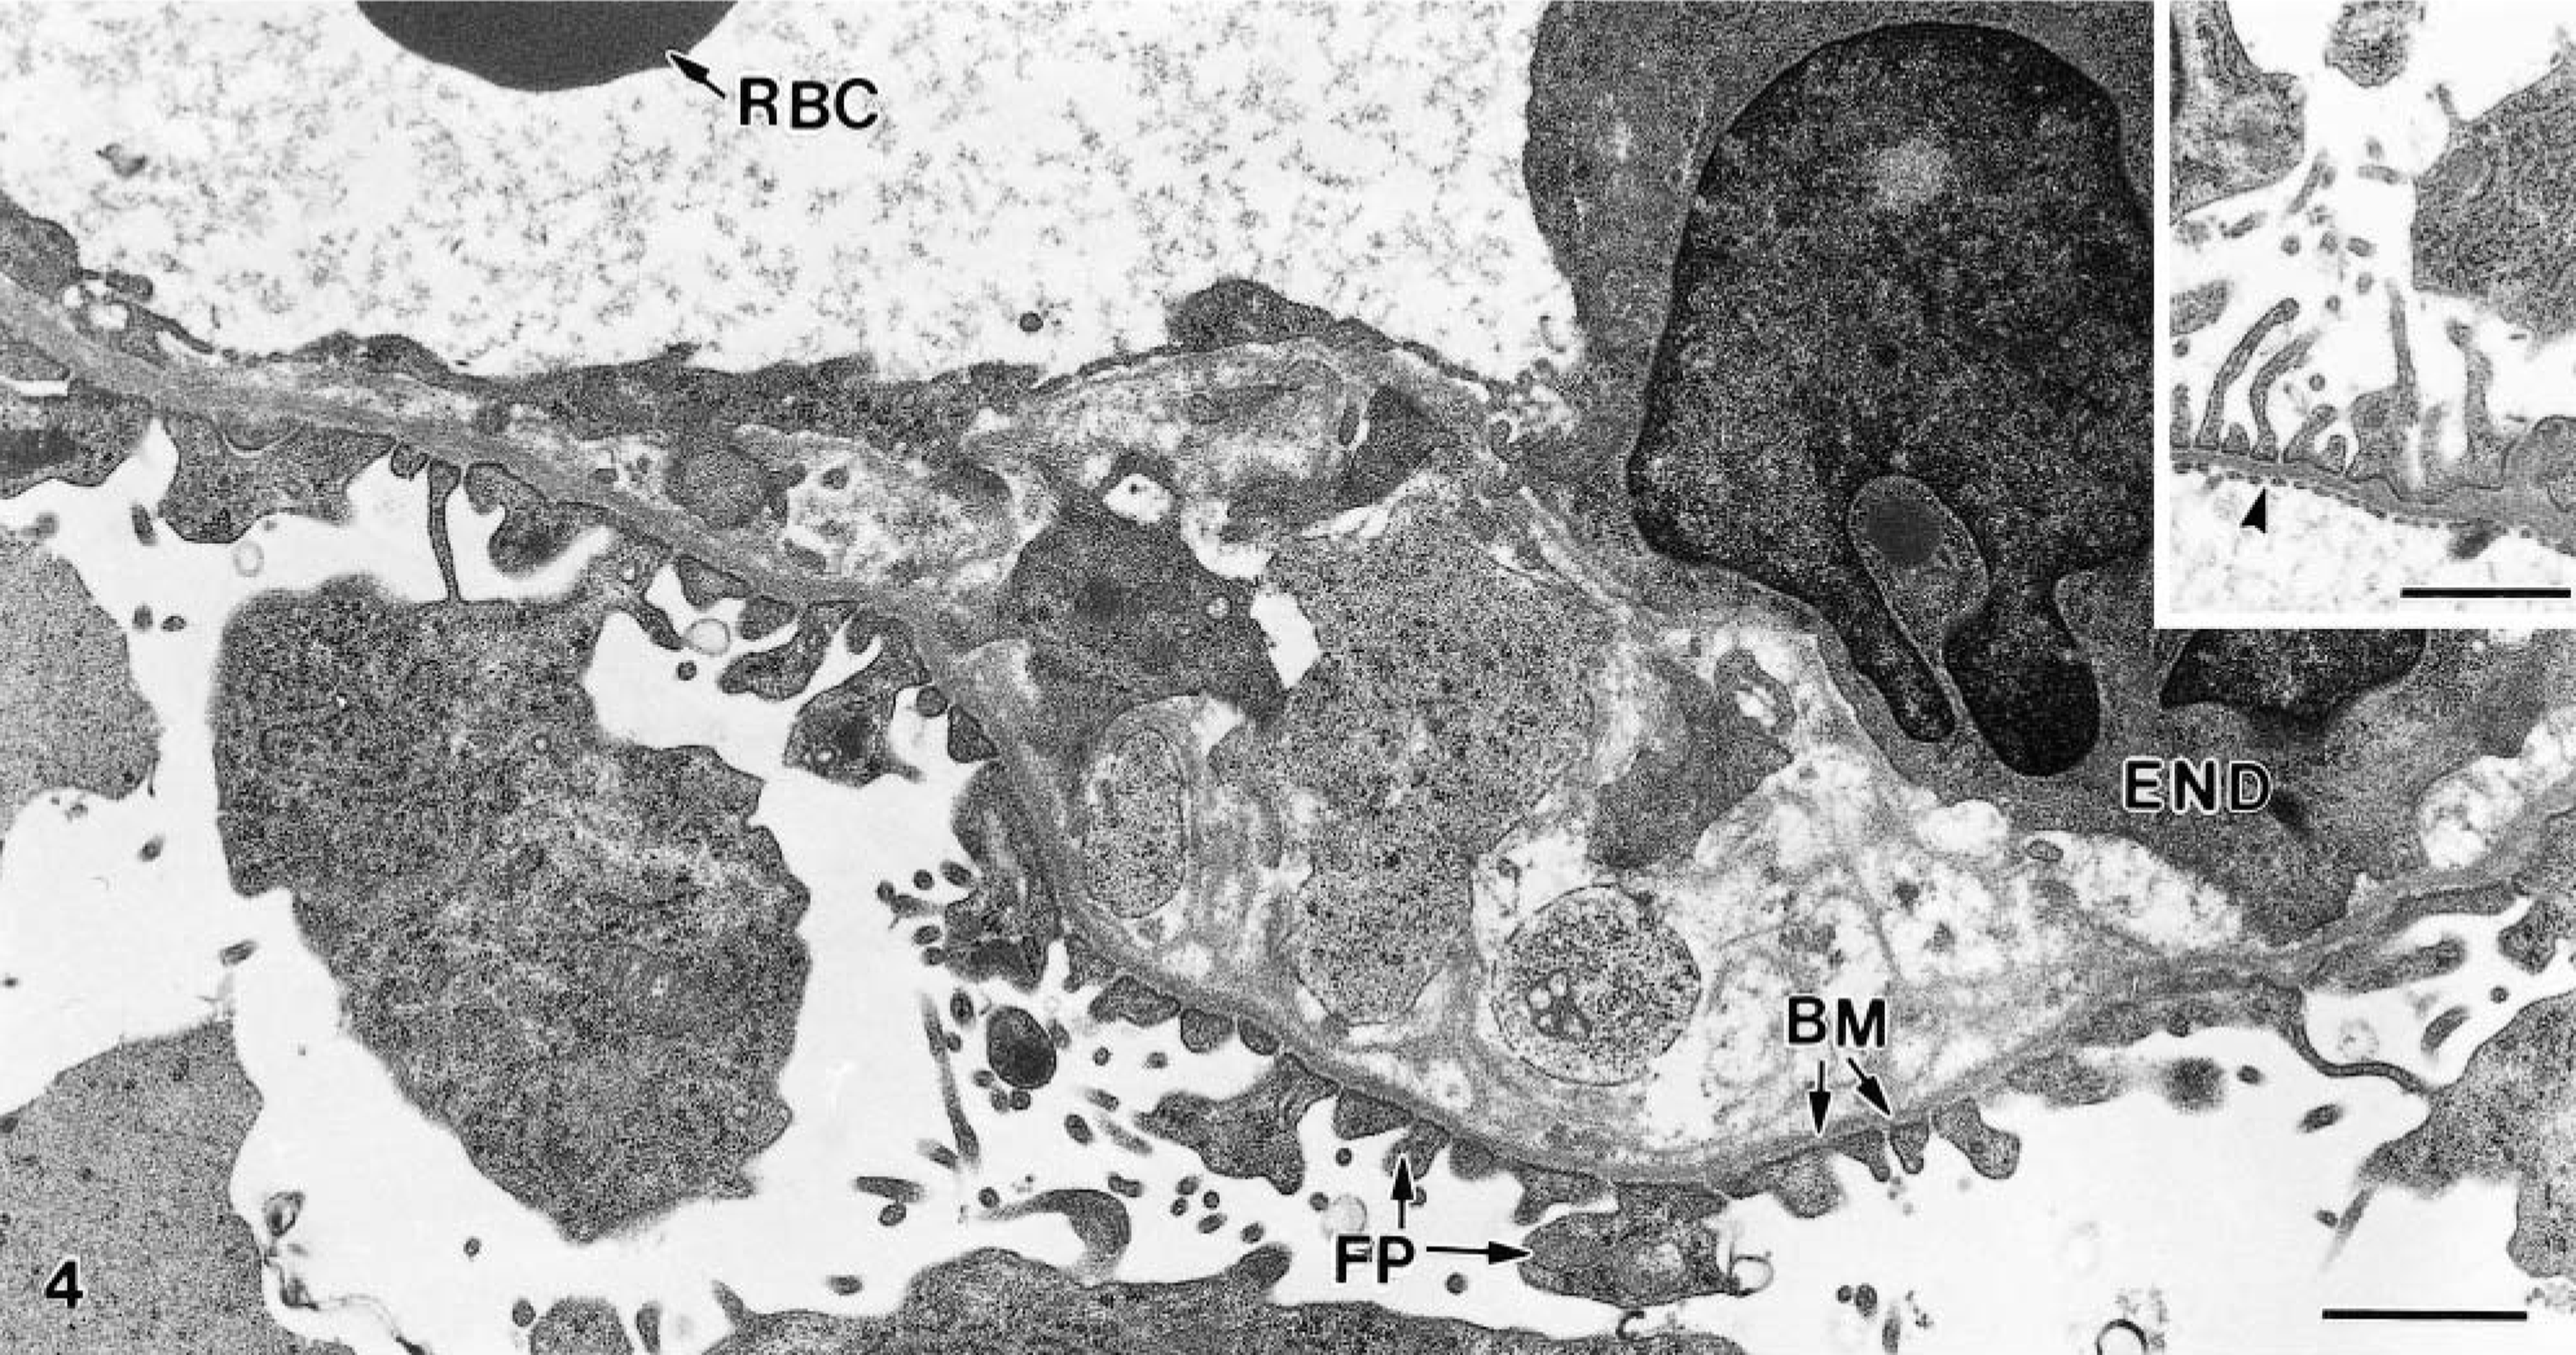
Kidney; goat No. 14. Electron micrograph of glomerulus 3 days after extract treatment. The endothelial cell (END) is separated from the basement membrane (BM). FP, foot processes; RBC, red blood cell. Note shortening and swelling of the foot processes. Bar = 1.0 μm. Inset: Baseline biopsy showing fenestrated endothelium (arrowhead) and normal foot processes. Bar = 1.0 μm.
The biopsies from the control animals were essentially similar to the baseline biopsies. In extract-treated animals, glomerular changes were found. In some of the capillaries, the endothelium was separated from the basement membrane, or the membrane was split (Fig. 4). There was also occasional vacuolization of endothelial cells, with loss of fenestration. The foot processes varied in height and shape but were mainly shorter and plumper than in the baseline biopsies, and they were also irregularly distributed (Fig. 4). The mesangial regions were similar to those in the baseline material and did not contain dense deposits. Platelet aggregates were not present, and only occasional leukocytes were seen.
Tubules
The baseline biopsies and the biopsies from the control animals showed well-preserved tubules with normal, slight vacuolization of the cells (Fig. 5, inset). The proximal tubules had mostly well-preserved microvilli; in the S1 segment, the basolateral invaginations were extensive. The basement membrane appeared overall regular and continuous.
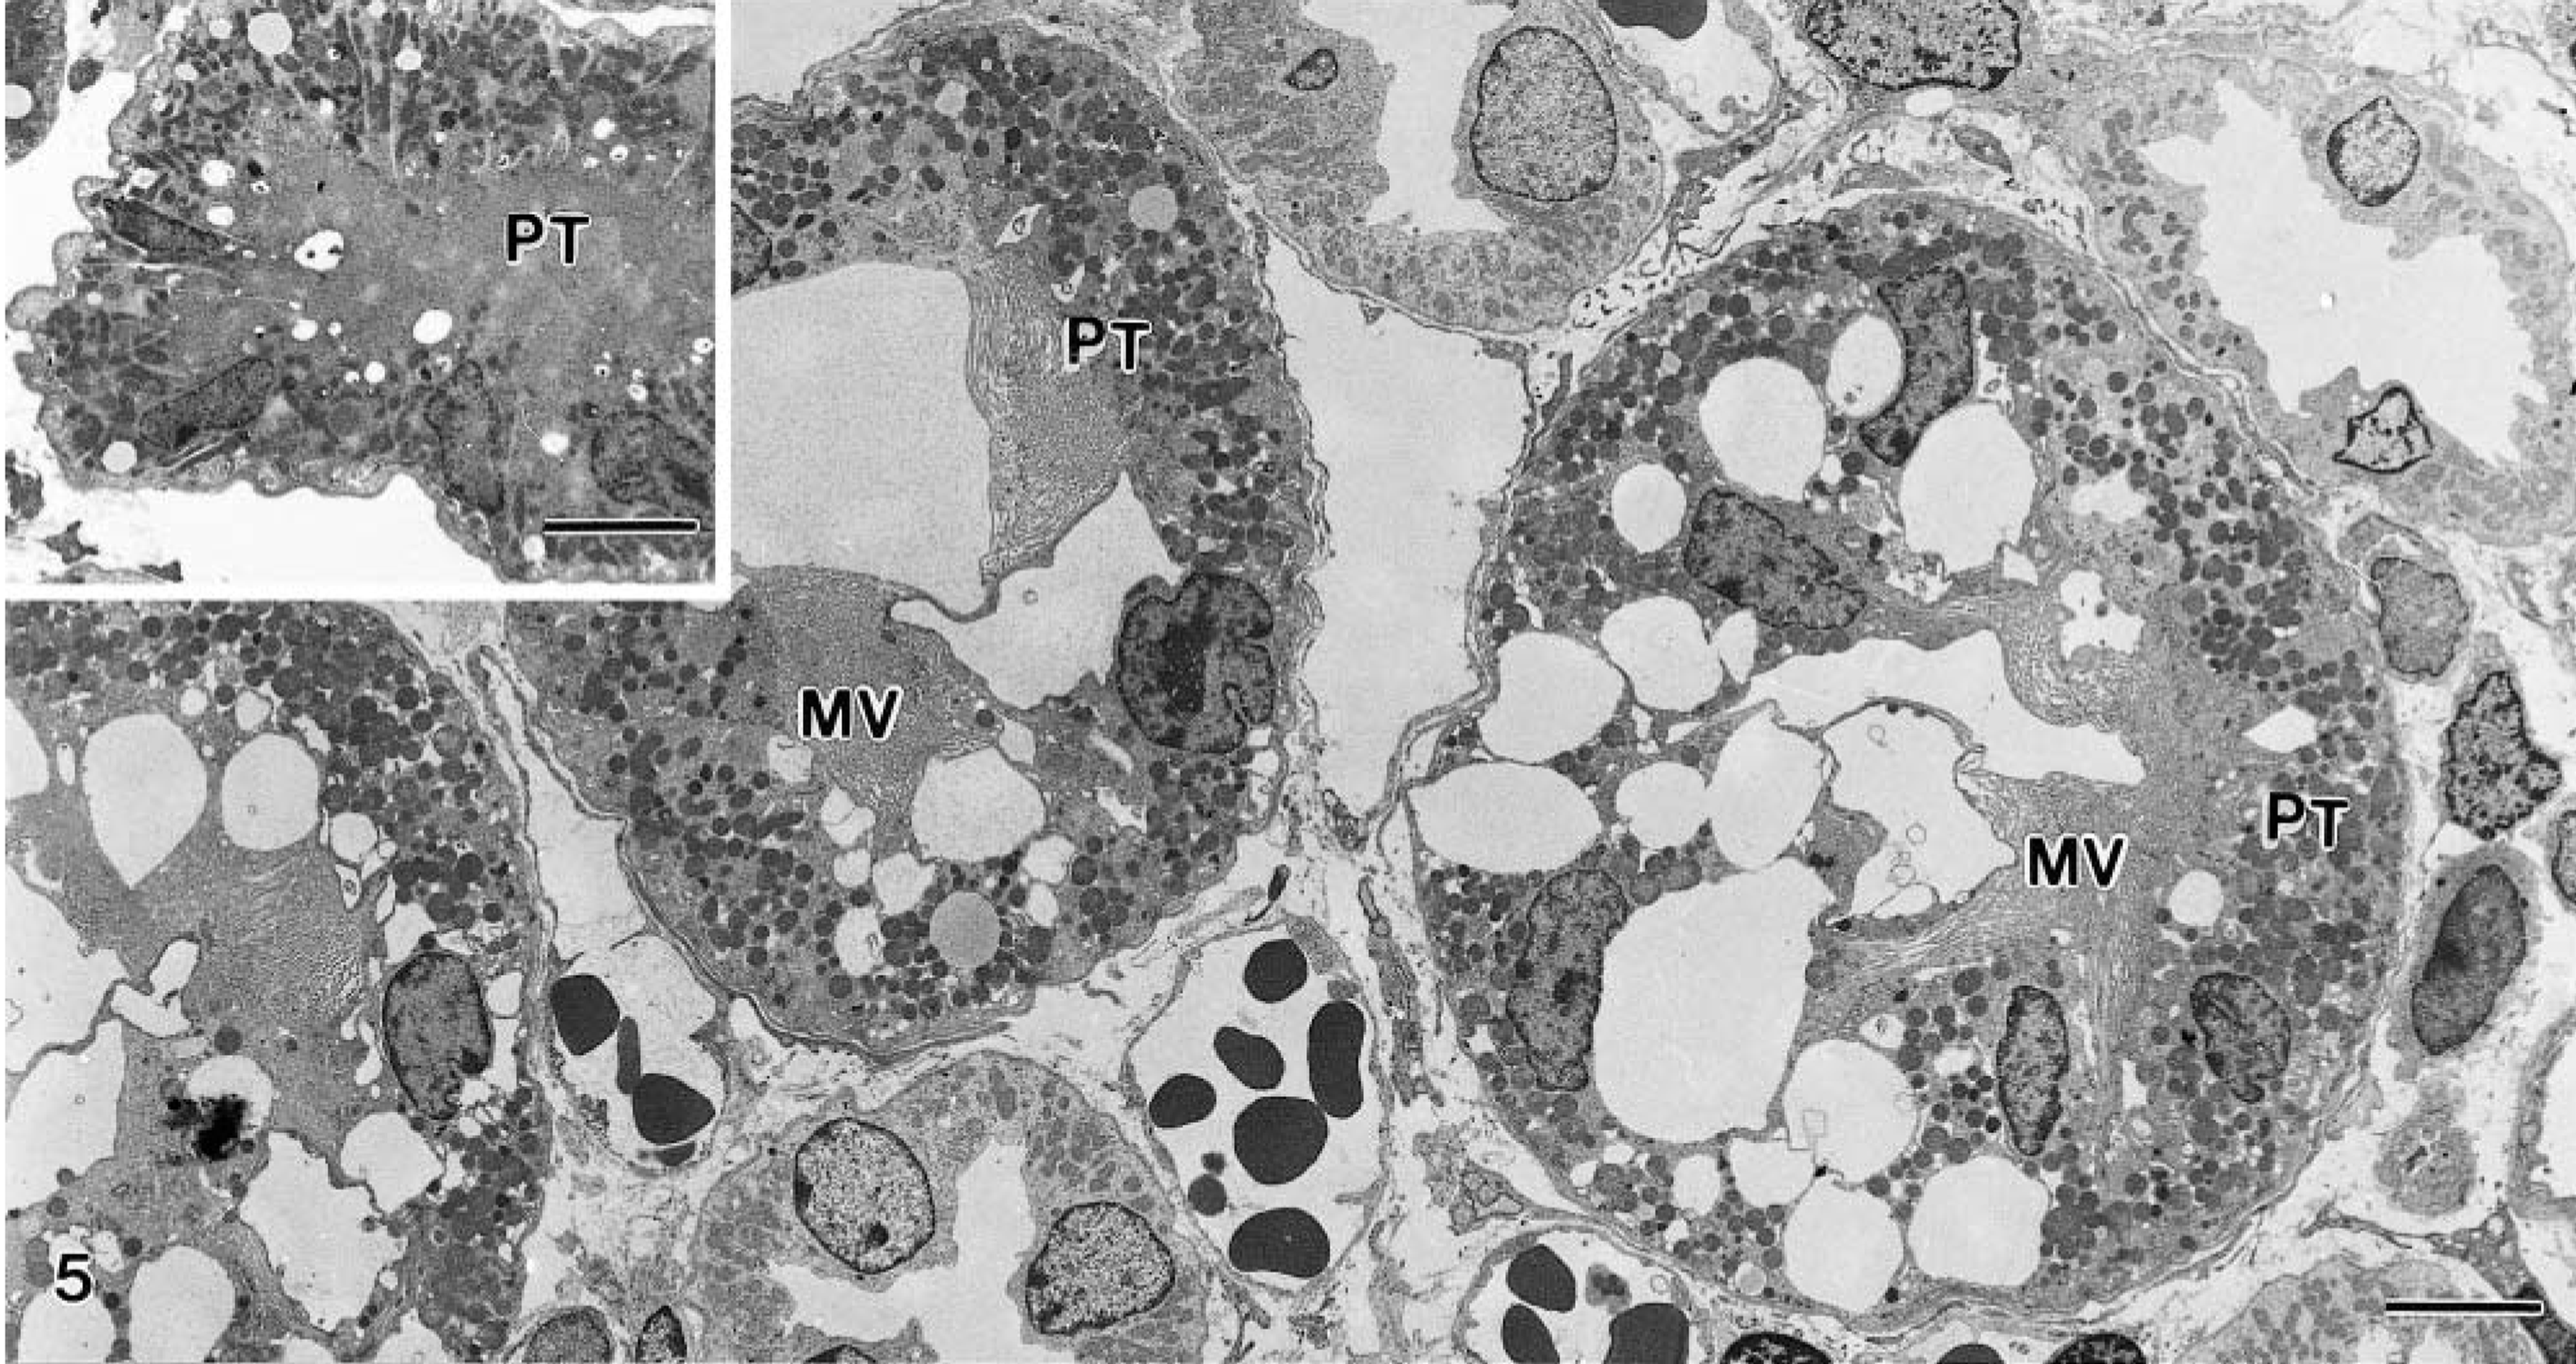
Kidney; goat No. 15. Electron micrograph of tubules in the juxtamedullary area 6 hours after dosing, showing large, irregular vacuoles in tubular epithelial cells. PT, proximal tubules; MV, microvilli. Bar = 5.0 μm. Inset: Baseline biopsy showing normal vacuolization of proximal tubule. Bar = 5.0 μm.
The extract-treated animals showed prominent lesions 6 hours after the treatment. The tubular lesions were focal with changes in single cells or small groups of cells. The proximal tubule cells had membrane-bound cytoplasmic vacuoles, mostly empty and often occupying a large proportion of the cell cytoplasm (Fig. 5). Occasional lipid droplets were seen. Most of the mitochondria appeared preserved, but a slight swelling was seen in some of the cells. The microvilli were often present but some loss was noted (Fig. 5). The intercellular junctions appeared preserved.
The ultrastructural changes increased by time with respect to both the number of cells and the degree of changes involved. The cytoplasm lost electron density and became swollen, and the nuclei were also swollen and showed margination of the chromatin (Fig. 6). The vacuolization was pronounced, and the mitochondria became increasingly swollen with loss of cristae (Fig. 6). The microvilli disappeared, and there was shedding of cytoplasmic fragments and cells into the tubular lumen. Cells with increased density and closely packed mitochondria, probably representing apoptotic cells, were also noted but were rare. The basement membrane often appeared folded but was apparently continuous even when cell necrosis had developed. Necrotic cells were seen on day 2 (Fig. 6), with increasing numbers the next day.
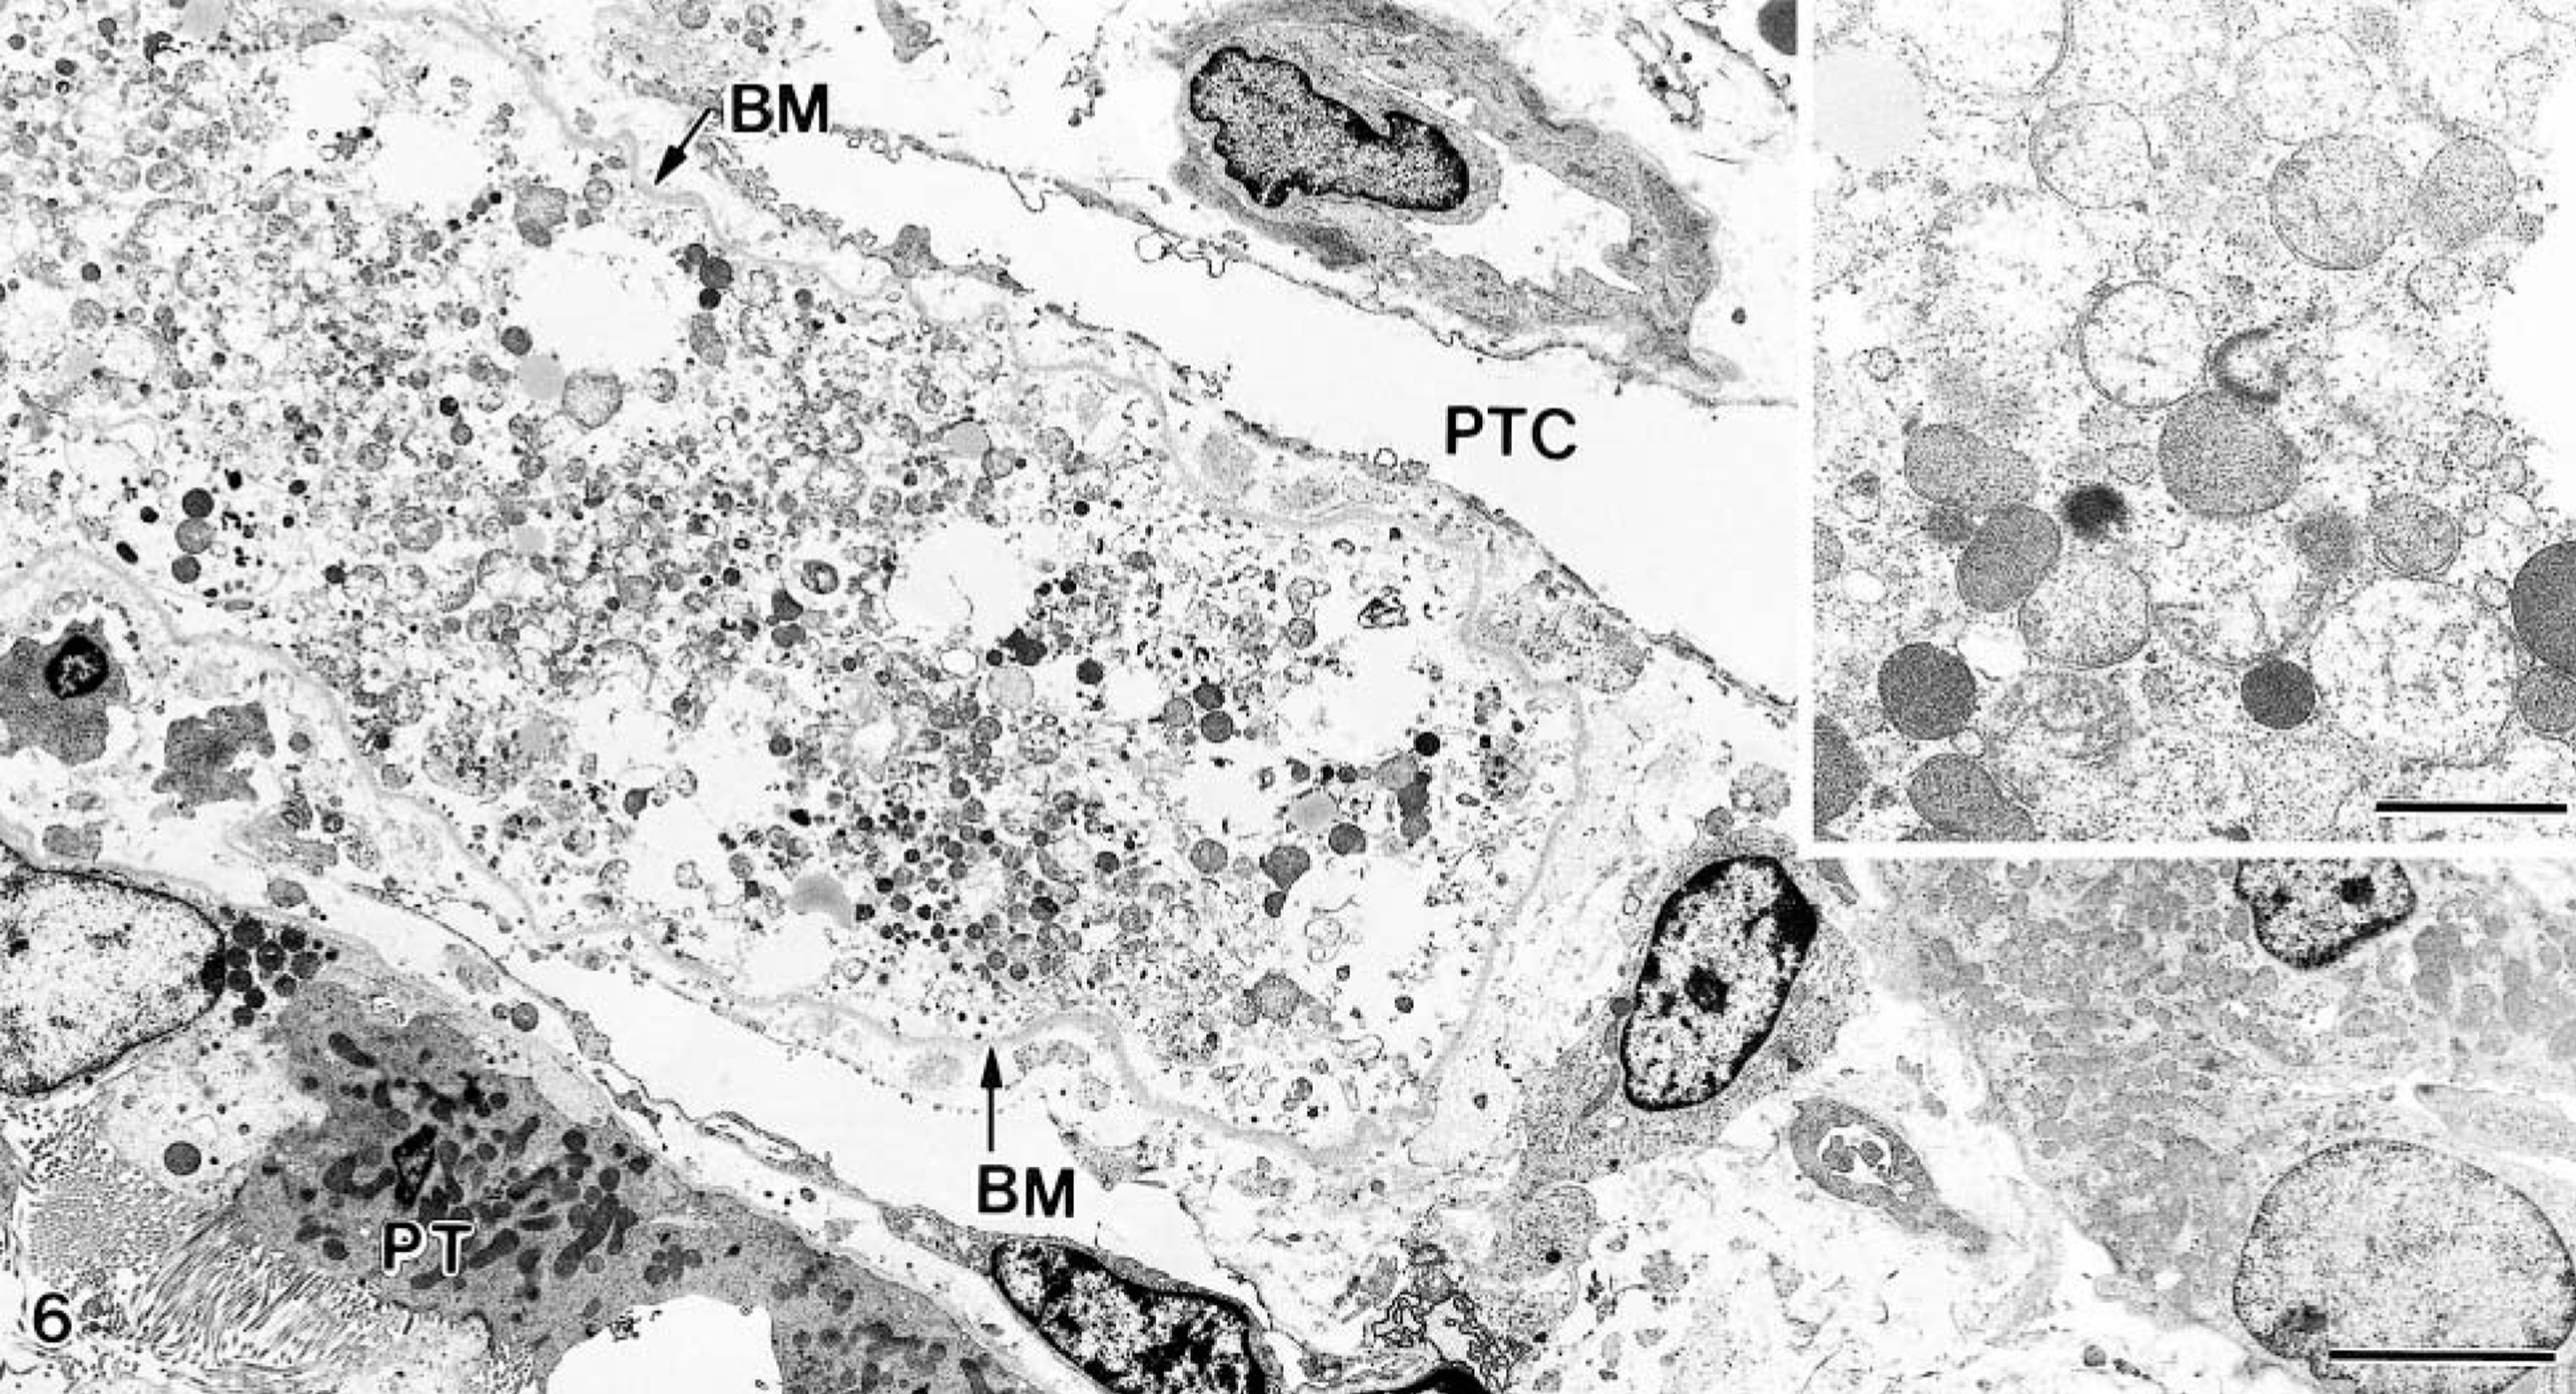
Kidney; goat No. 13. Electron micrograph from 48-hour specimen, showing tubular necrosis and marked interstitial edema. Note that the basement membrane (BM) is folded but continuous. PT, proximal tubule; PTC, peritubular capillary. Bar = 5.0 μm. Inset: Close-up of mitochondria in various stages of swelling. Bar = 1.0 μm.
Interstitium
Compared with the baseline biopsies, samples from extract-treated animals showed edema, which increased with time. There was, however, no infiltration of mononuclear cells or polymorphonuclear leukocytes, even after 72 hours. The capillaries and venules showed occasional junctional gaps and breaks in the endothelial lining and basement membrane with extravasation of cells (Fig. 7). There was no accumulation of leukocytes, and microthrombi were not observed.
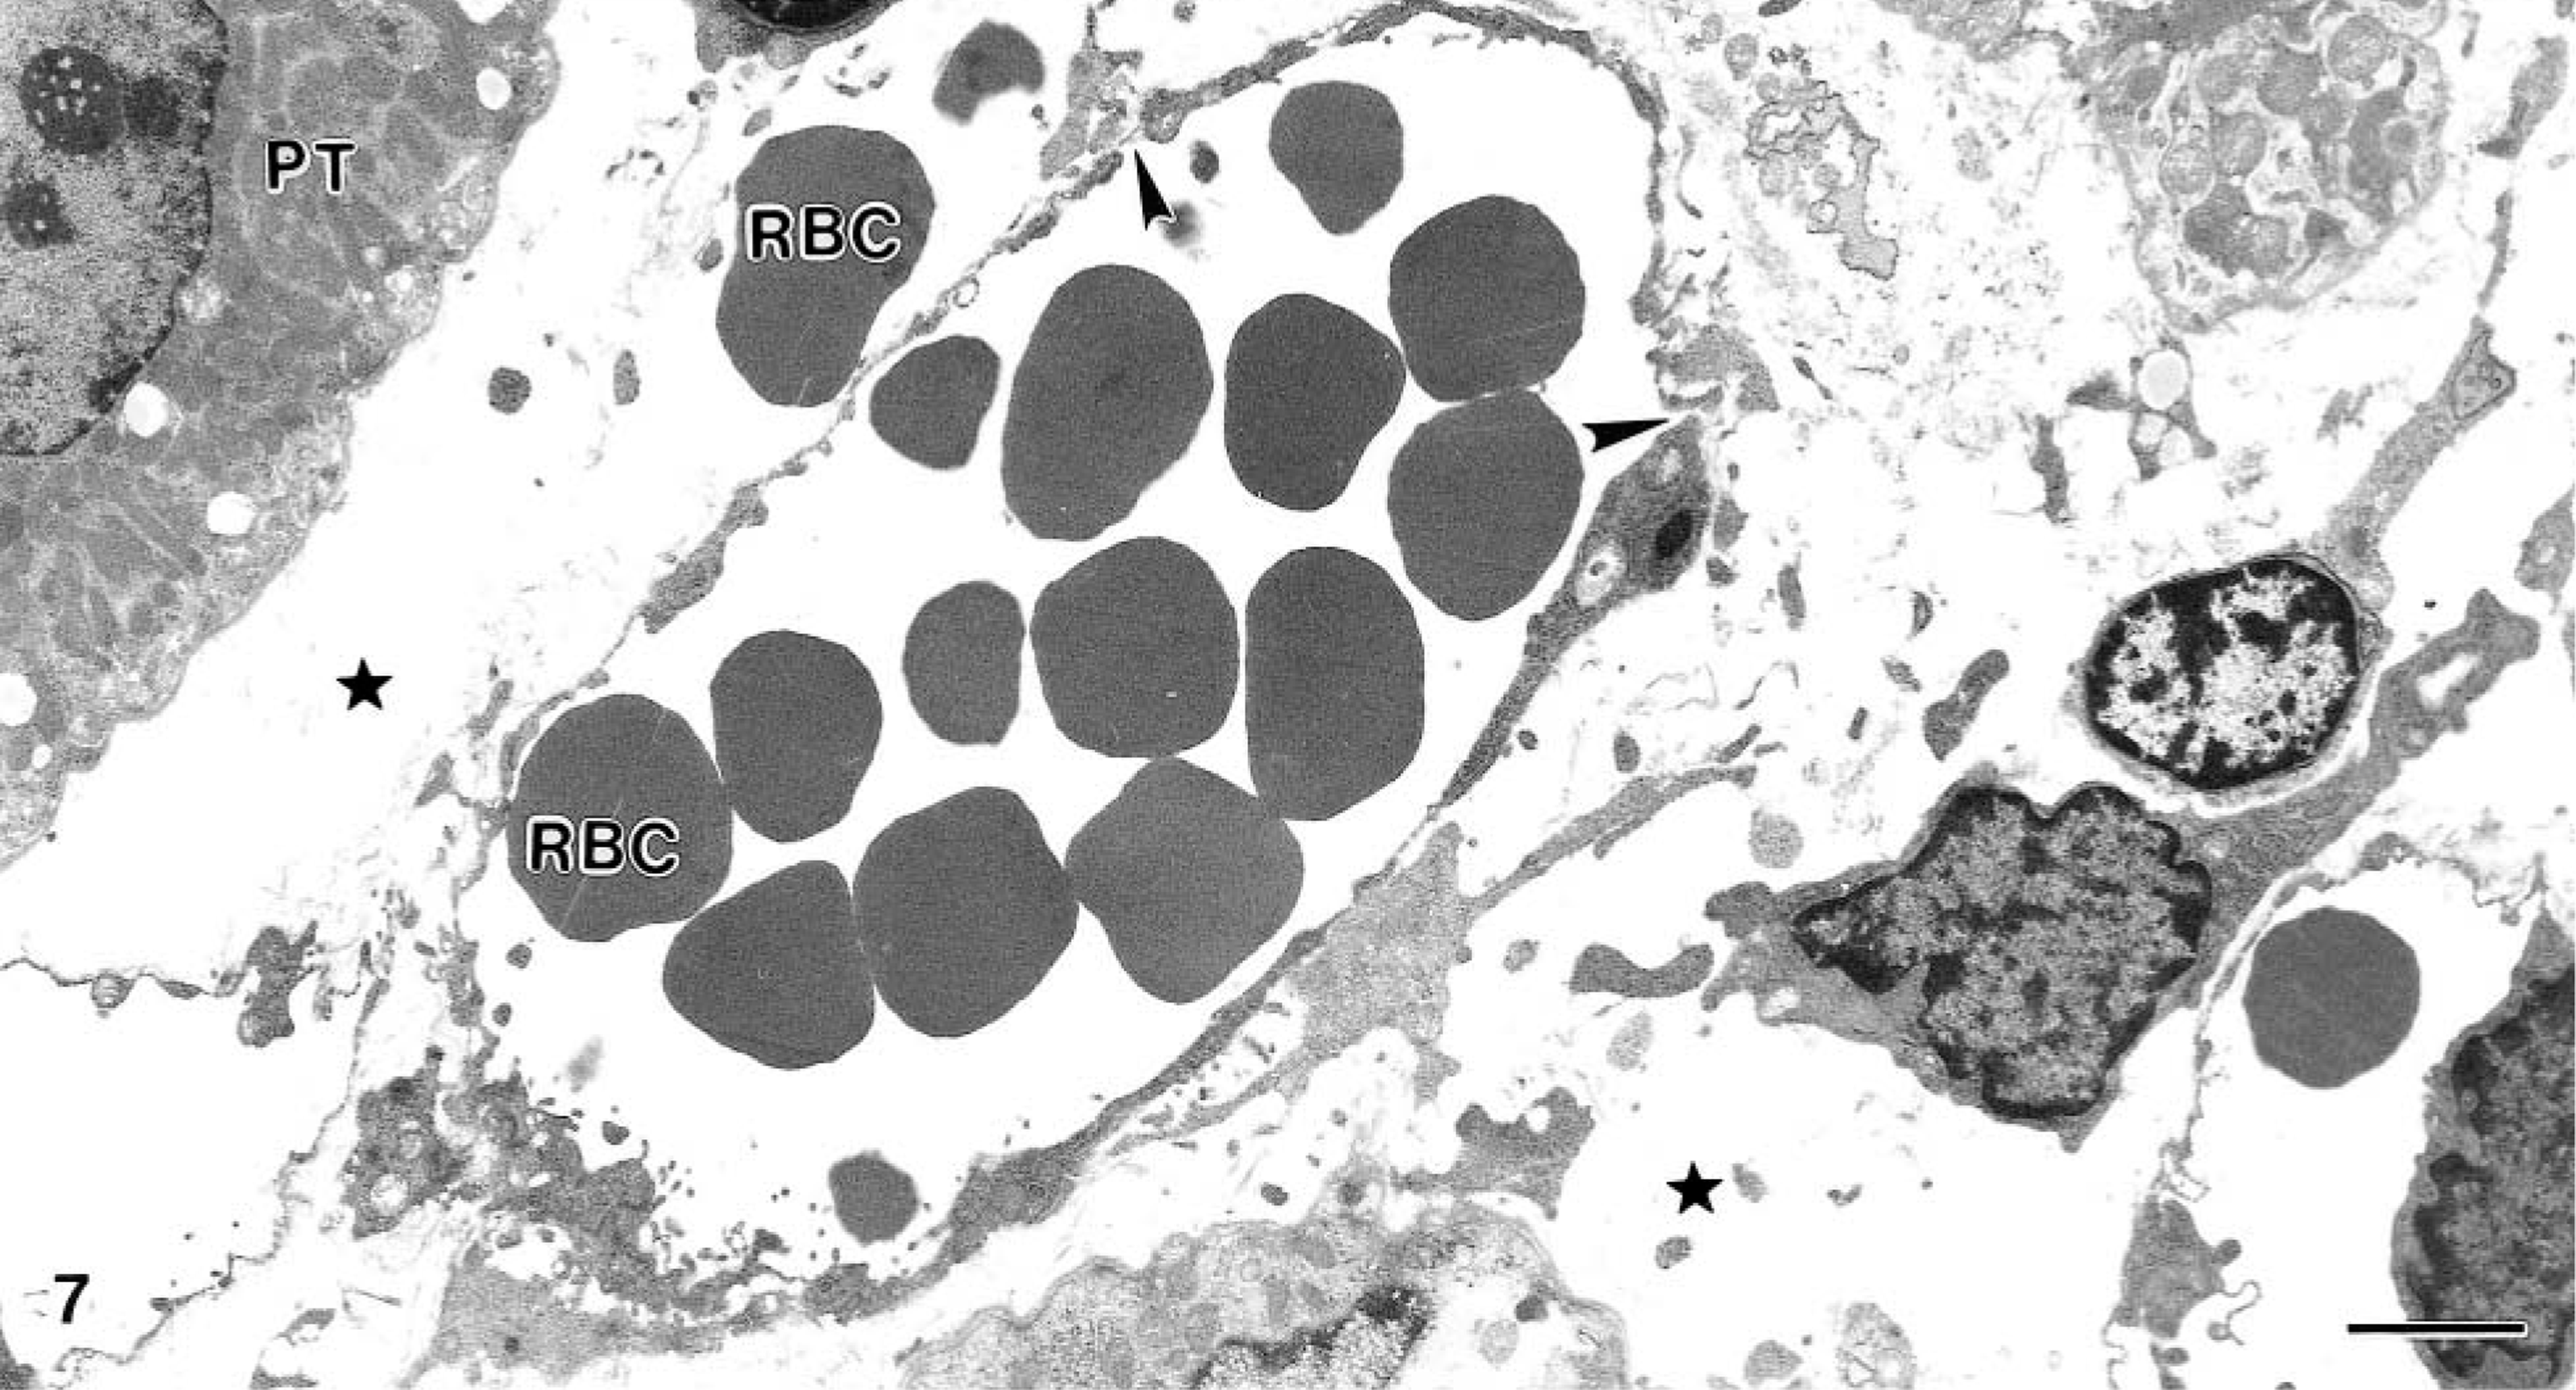
Kidney; goat No. 14. Electron micrograph from 72-hour specimen, showing dilated capillary with red blood cells. Note defects in the capillary wall (arrowheads) and a red blood cell (RBC) outside the vessel. Marked edema indicated by star. Bar = 2.0 μm.
Serum chemistry analyses
One of the control animals in experiment 1 had a slight increase (8 mmol/liter) in serum urea on day 6 (No. 12), but the creatinine levels were within the normal range. The remaining controls in experiment 1 and the control animals in experiment 2 (Nos. 22–25) had serum urea and creatinine levels within the normal ranges (3.4–9.1 mmol/liter and 56–92 μmol/liter, respectively). In both experiments, the dosed animals showed increased serum creatinine and urea concentrations on days 2 and 3 (Figs. 8, 9). In experiment 1, both creatinine and urea maximally increased by day 5, whereas in experiment 2, the maximal levels occurred on day 6, except for two animals that had increasing levels even on day 7 (Nos. 16 and 17). The serum magnesium concentrations of the control animals were in the normal range. In extract-treated animals, serum magnesium was increased on day 1 in experiment 1 and reached a maximum on days 4 and 5 (Fig. 10). The serum calcium concentrations in dosed animals were within normal range at all times, but on days 4 and 5, the calcium level was slightly lower than in the control animals. Because serum concentrations of urea, creatinine, magnesium, and calcium were similar in both experiments, only experiment 1 is illustrated in figures.
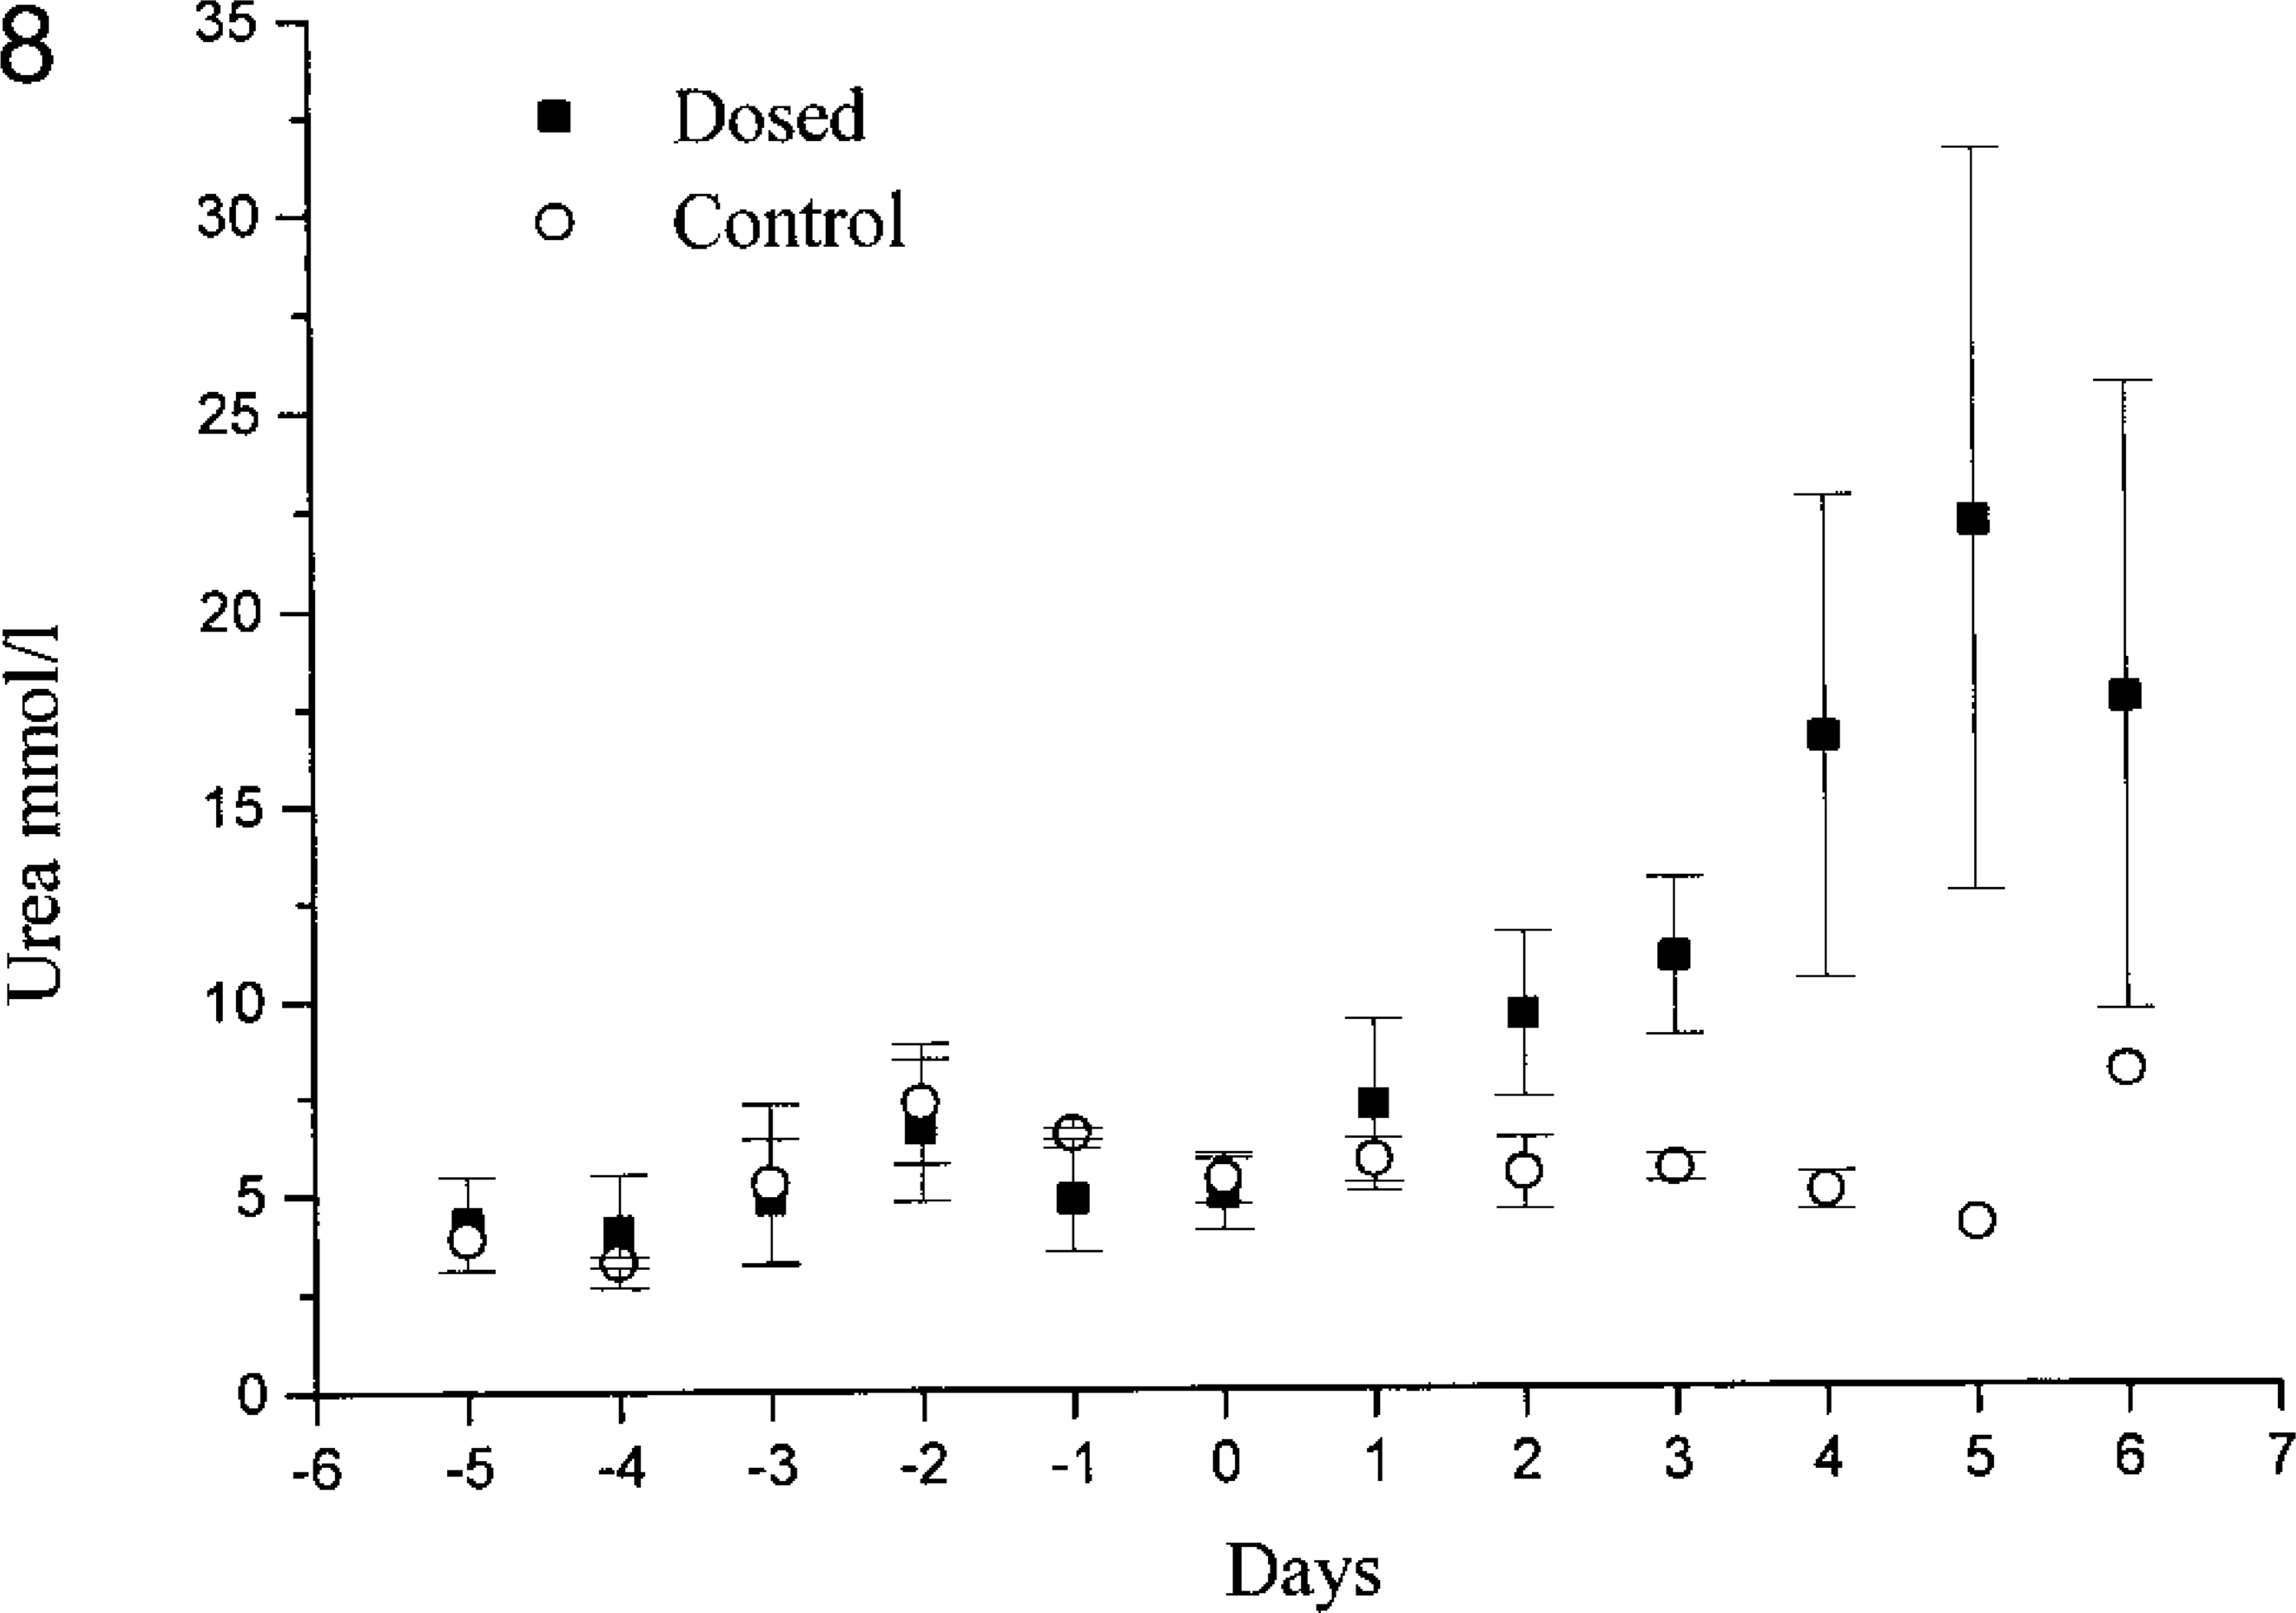
Serum urea concentrations in control goats and goats dosed with the aqueous extract from N. ossifragum on day 0 (experiment 1).
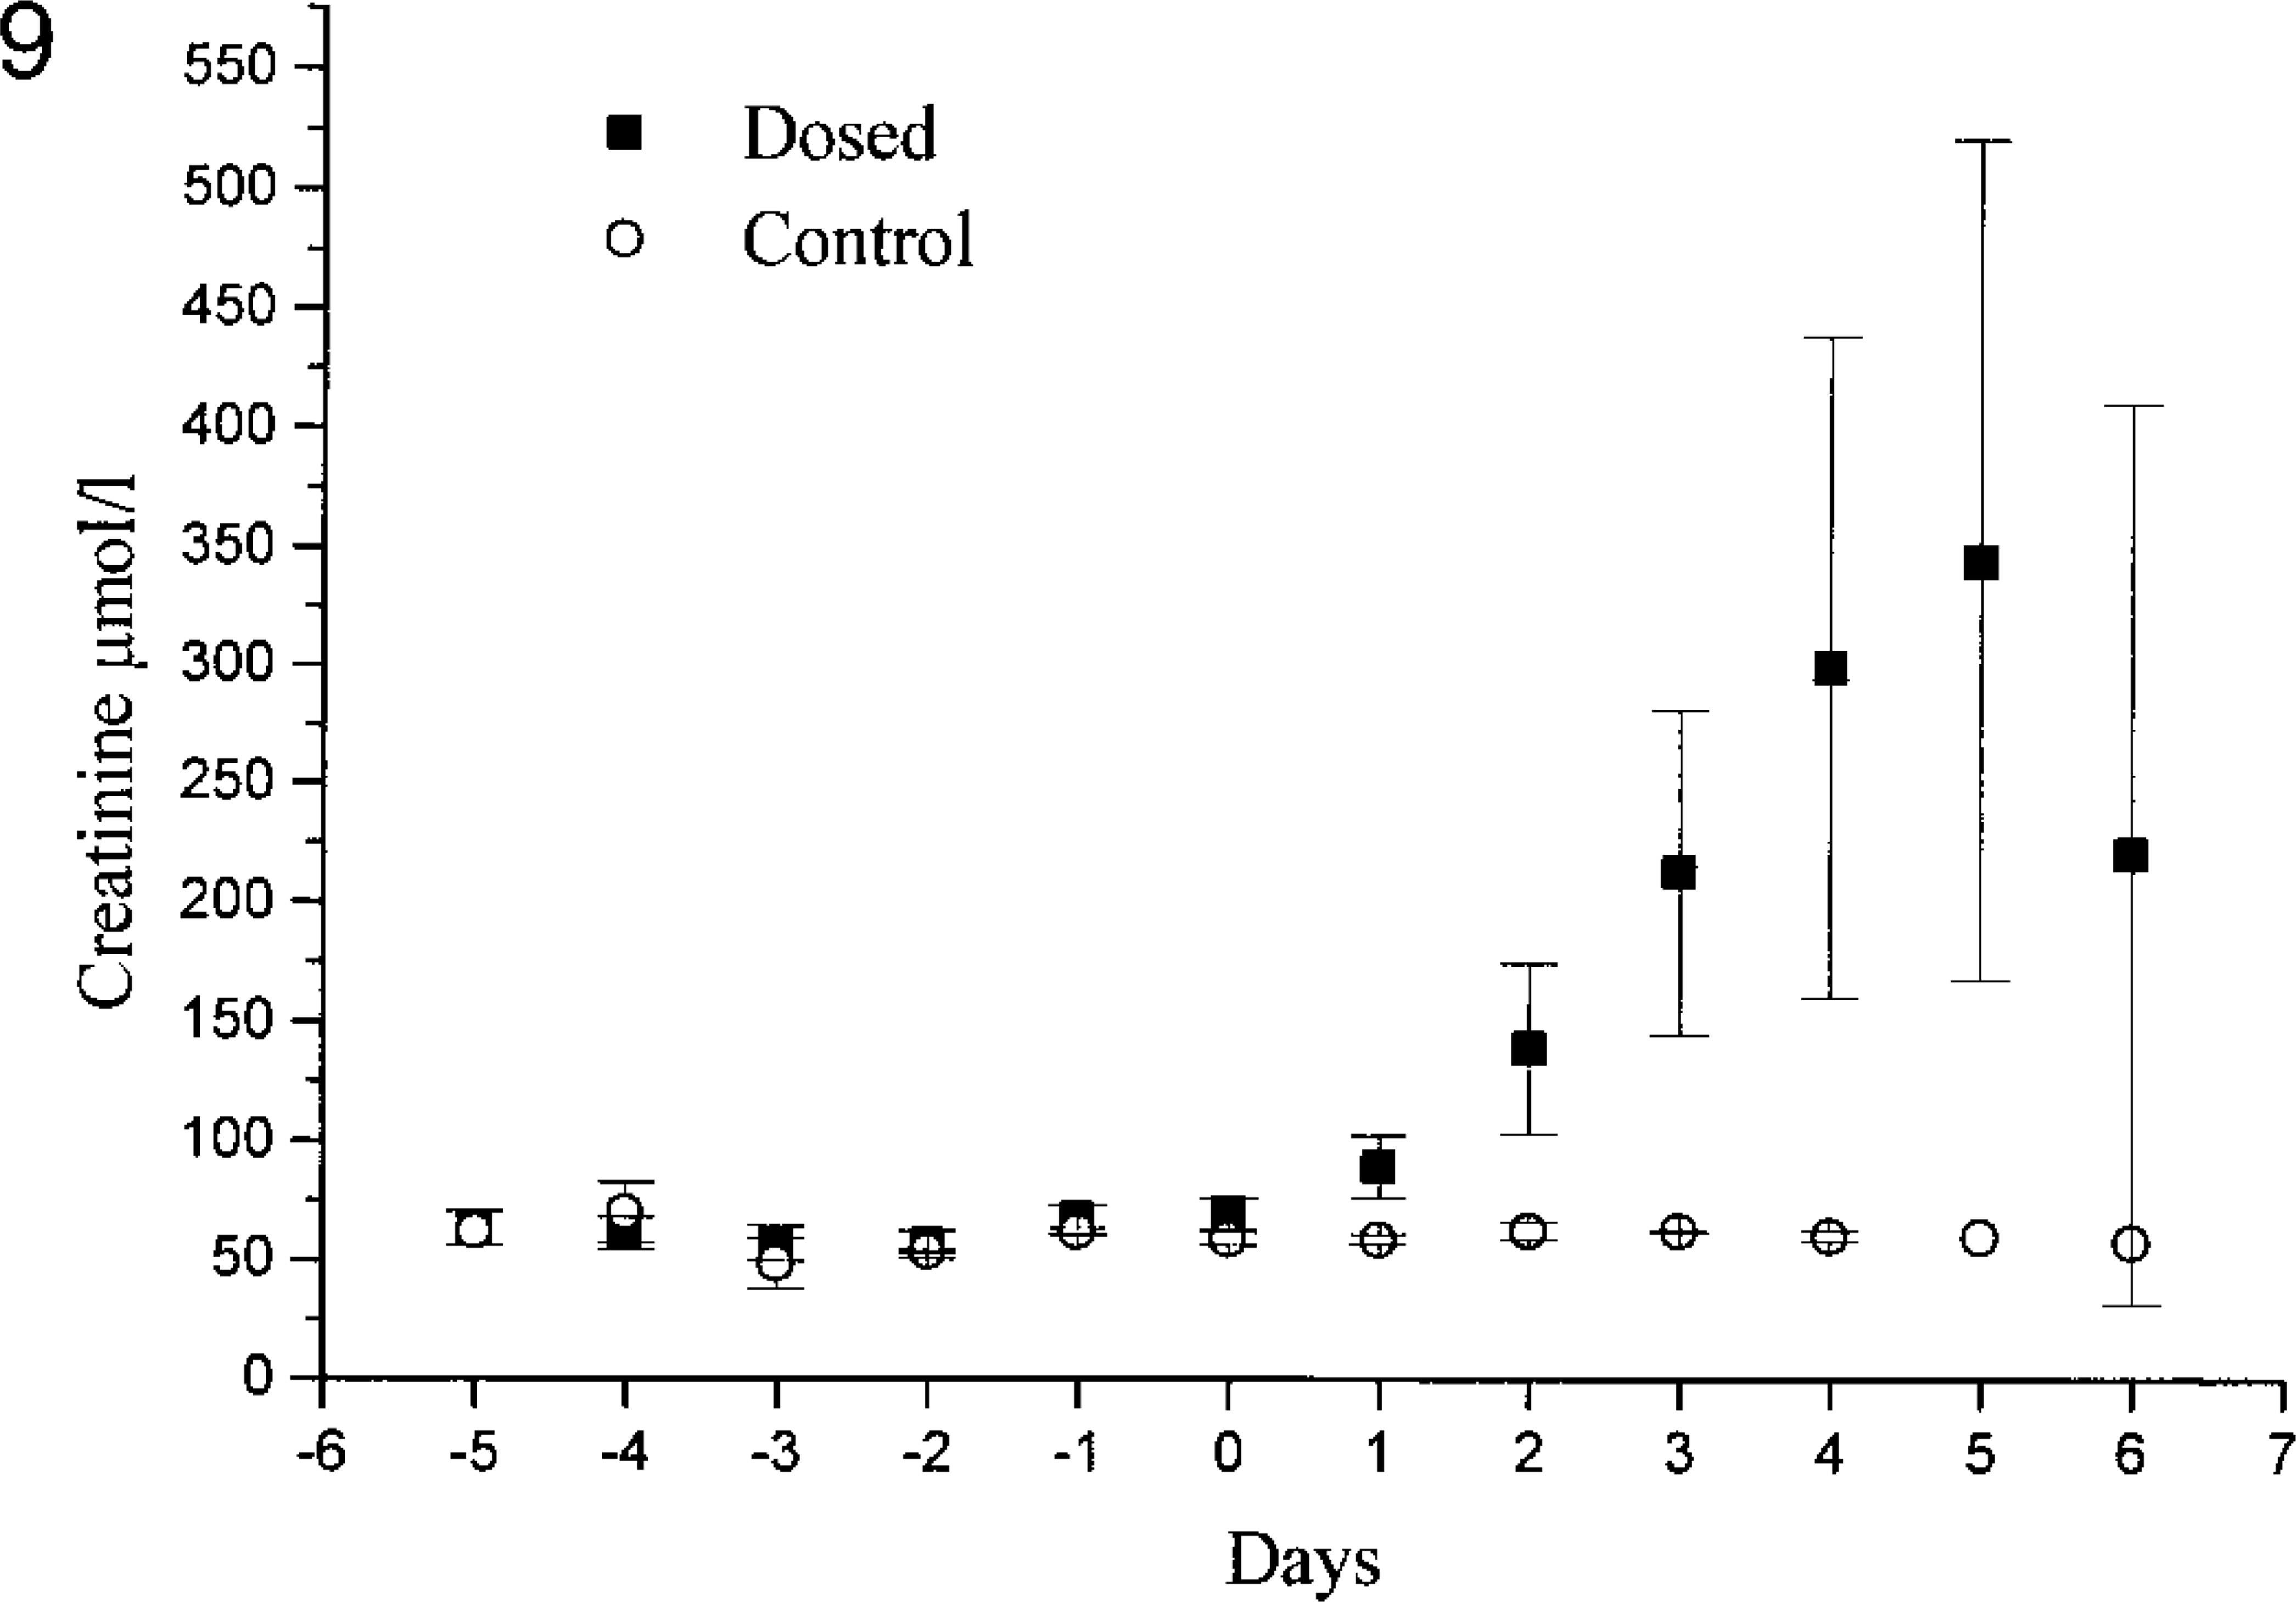
Serum creatinine concentrations in control goats and goats dosed with the aqueous extract from N. ossifragum on day 0 (experiment 1). Note that the serum creatinine levels are increased already on day 1 but seem to decrease again on day 6.
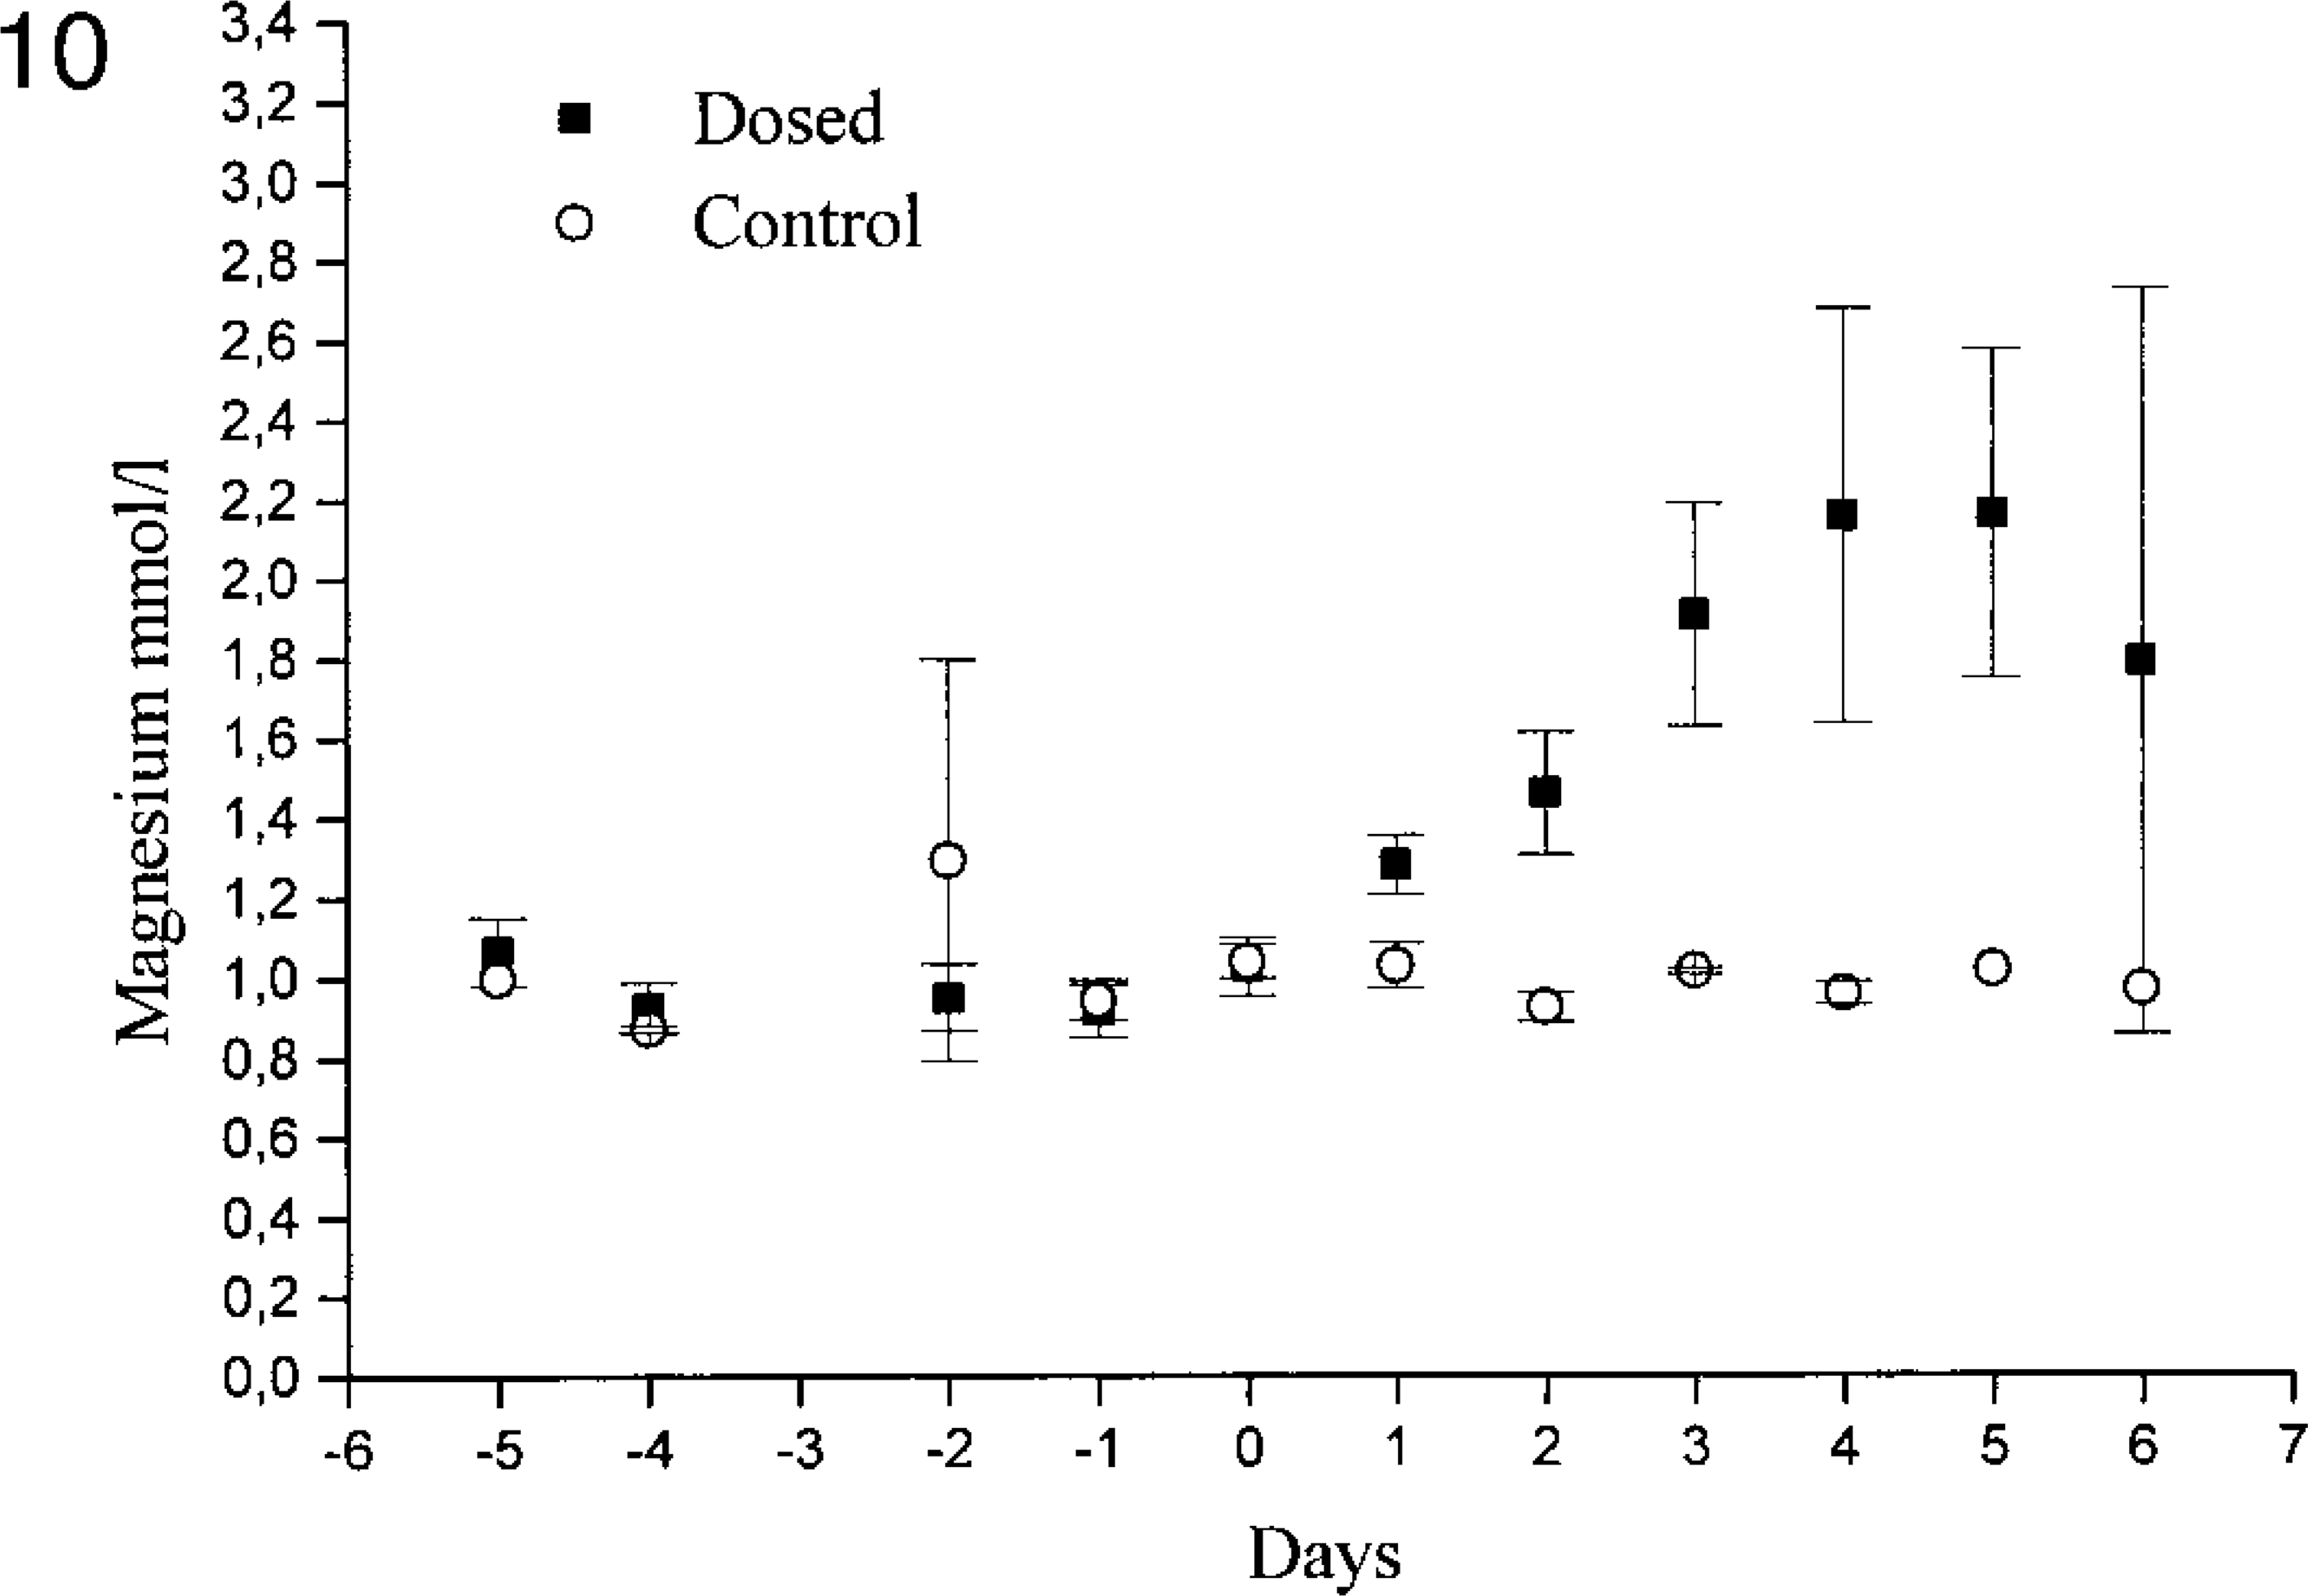
Serum magnesium concentrations in controls and extract-treated animals (experiment 1).
Urine analysis
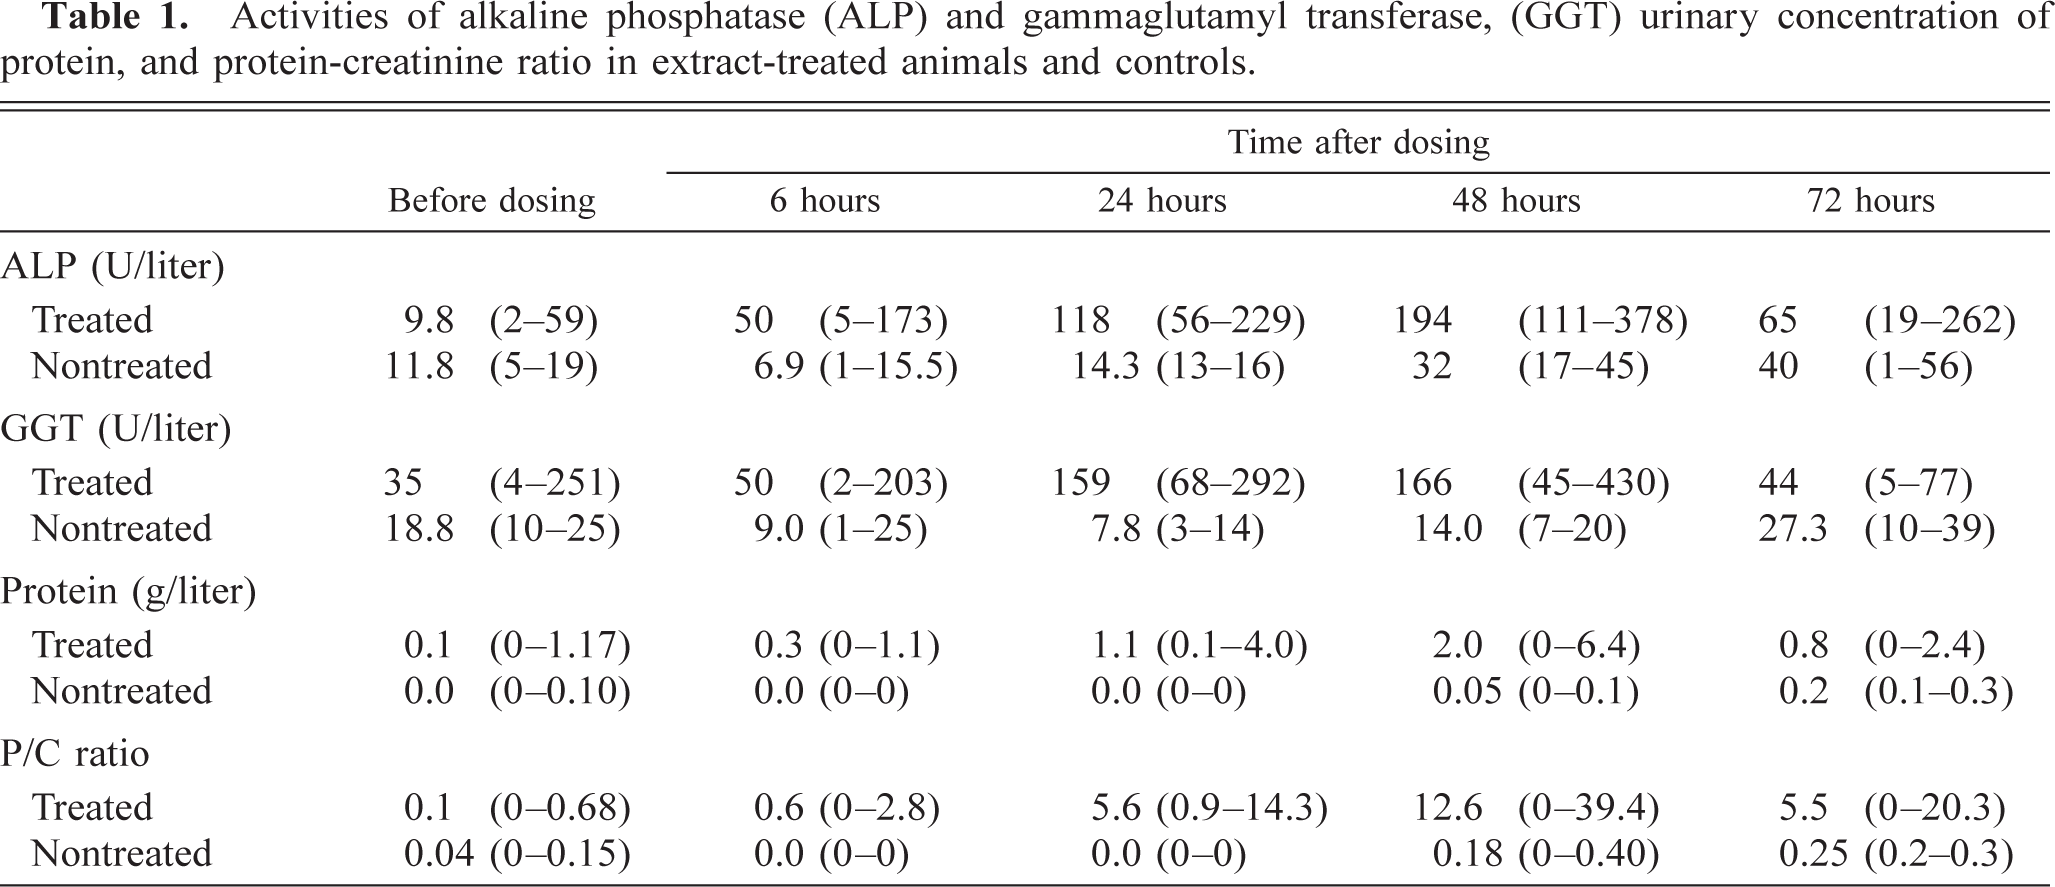
In control animals, all urinary parameters measured were within the normal range (Table 1). Concentrations of urinary protein and ALP and GGT activities were increased in two of the extract-treated animals (Nos. 15 and 16) 6 hours after dosing, and the mean level reached a maximum on day 2 (Table 1). Urinary creatinine concentration was slightly decreased in most animals, and urinary protein-creatinine ratio increased from day 1 and reached a maximum on day 2.
Activities of alkaline phosphatase (ALP) and gammaglutamyl transferase, (GGT) urinary concentration of protein, and protein-creatinine ratio in extract-treated animals and controls.
Discussion
In our study, administration of N. ossifragum extract to goats was associated with clinical signs and lesions typical of renal failure secondary to renal tubular necrosis.
Ultrasonographic examination showed perirenal fluid accumulation. The main microscopic finding was necrosis of tubular epithelial cells in the outer renal medulla and inner cortex. Ultrastructural examination revealed glomerular capillary endothelial lesions and altered foot processes. Vacuolization of the tubular cells occurred very early and increased with time. Swelling of mitochondria with loss of cristae and loss of microvilli with shedding of cytoplasmic fragments into the tubular lumen occurred early. Correspondingly, ALP and GGT concentrations increased in the urine, and serum urea and creatinine concentrations increased. The results show that the morphologic changes and the first signs of renal dysfunction occurred within 6 hours of dosing with the active principle 3M2F, indicating that the toxin was fast acting.
The ultrastructural changes in the glomeruli were mild but striking. To our knowledge, capillary endothelial damage combined with flattening of the foot processes has not previously been described in relation to toxic damage. The mechanisms involved in the development of the changes in morphologic and functional parameters are certainly complex. There were several factors that may have played a role, such as decrease in glomerular capillary permeability, back-leakage of glomerular filtrate through tubular cell walls with increased permeability, tubular obstruction, and vascular constriction. 4
The glomerular changes with capillary endothelial damage observed in our study may indicate changes in vascular permeability. We did not find evidence of thrombotic processes, and the cause of the endothelial damage was not clear. Tubular obstruction may be caused by release of cytoplasmic fragments mixed with intratubular proteins. This can lead to increased intratubular pressure, which again may result in sufficient back pressure to alter the transglomerular hydrostatic pressure. The flattening of the foot processes may have been a consequence of this. The endothelial changes in the wall of peritubular capillaries may explain the edema of the interstitial tissue observed after only 6 hours.
One possible mechanism for the tubular lesions was a direct toxic effect on the cell function. 1 Damage to the brush border and leakage of ALP and GGT into urine could have been a result of toxin binding to the brush border. These two enzymes are associated with the brush border of the renal tubules, and the urinary concentration of ALP in particular has been used as an early marker of toxic tubular insult. 6 , 8 , 24 The decreasing concentrations of the enzymes at the end of the observation period would seem to be in keeping with the observations of signs of early regeneration on day 3.
Lethal cell injury may be related to necrosis or apoptosis. We found little evidence of apoptotic cells, and we suggest that apoptosis played a minor role in the pathogenic process of renal damage due to N. ossifragum. It is, however, known that cytotoxic agents can induce apoptosis. 20 Our findings on preserved basement membranes surrounding even necrotic cells have been reported to be characteristic for direct toxic-induced changes. 23
Other possible mechanisms may involve reactive intermediates or oxidative stress (or both). 1 Biologically reactive intermediates are electron-deficient compounds (electrophiles) that bind to cellular electron-rich compounds (nucleophiles), such as proteins and lipids. 17 Mixed-function oxidases catalyze the formation of these toxic metabolites. Reactive intermediates bind covalently to critical cellular macromolecules and interfere with normal biologic activity. Oxidative stress is induced by increased production of reactive oxygen species (ROS), such as superoxide anion, hydrogen peroxide, and hydroxyl radicals. 17 ROS can induce lipid peroxidation, inactivate cellular enzymes, depolymerize polysaccharides, and induce deoxyribonucleic acid breaks and chromosome breakage. Swelling of the mitochondria observed in our study could have been a result of inhibited mitochondrial respiration.
Many of the common nephrotoxic substances appear to act by means of alterations in the renal perfusion, 26 and some of our findings were in agreement with such a mechanism. The dominant tubular lesions were in the outer medulla and inner cortex. The tubules in this area consist mainly of S3 segments of the proximal tubule. 29 This area and the medullary rays are parenchymal zones with limited oxygen supply 4 , 26 and thus easily get damaged if a nephrotoxic substance diminishes the renal perfusion.
Approximately 50–60% of filtered magnesium is reabsorbed in the loop of Henle, specifically in the thick ascending limb. 25 Hence, the marked increase in serum magnesium can be the result of a reduced filtration rate or back leakage of filtered magnesium through damaged tubular epithelium.
The kidney is an important organ for maintaining the calcium homeostasis. Ca2+ is reabsorbed by paracellular diffusion and transcellular active transport. 3 There has been evidence for mitochondrial accumulation of Ca2+ in ischemic acute renal failure and that this calcium uptake impairs renal mitochondrial phosphorylation and adenosine triphosphate synthesis. 7 Mitochondrial uptake of calcium may explain the tendency toward lowering of serum calcium levels and may have played a role in the damages observed in the epithelial cells.
Clinically, all the animals in experiment 1 tolerated the treatment well. In experiment 2, however, the goats were depressed and had reduced appetite. This difference between the animal groups in the two experiments may be related to the trauma of biopsy procedure, involving anesthesia in experiment 2. However, biopsied and nonbiopsied animals in experiment 2 behaved similarly. In addition, the biopsied control animals in experiment 2 did not have elevated serum urea and creatinine concentrations. These two facts indicated that the biopsy procedure alone did not explain the clinical differences between the two experiments. The ultrasound-guided biopsy technique is relatively simple, but complications with perirenal hematoma and considerable morbidity have been reported. 16 In our study, the hemorrhage was of short duration and very limited but would still have affected the condition of the animals. The lower age, and hence lower body weight of the animals in experiment 2, may also have influenced the clinical state of the animals in this group. Another possible explanation for the clinical difference between the two groups may have been different concentrations of the toxin 3M2F, although the plant extracts were produced in the same way. In contrast to experiment 1 the dose of the active principle 3M2F was well defined in experiment 2. An analytic method for determining this concentration was not developed at the time experiment 1 was performed. We did not observe differences between sexes in responses to the toxic insult. The goats were not sexually mature, and we suggest that possible differences between males and females are negligible at this age.
On the basis of previous studies, the dose chosen in our study was estimated to be sufficiently high to induce kidney damage but low enough to allow recovery of the animals. 11–14 The use of live animals in experiment 2 was important for optimal tissue preservation for the ultrastructural studies and for the observation of the tissue changes over time.
A number of toxic principles are reported to cause kidney damage. The plant Isotropis forrestii has been reported to cause renal damage in sheep in Australia. 6 The main finding in this condition was diffuse necrosis of proximal tubular epithelial cells, starting in straight portions. In an experimental study on I. forrestii intoxication, there was no evidence of basement membrane disruption, and it was suggested that the cause was a direct toxic insult rather than damage caused by secondary ischemia. 6
Several cases of renal toxicity associated with ingestion of Asiatic lily species and their hybrids have been reported. 5 The most common cause is the Easter lily (Lilium longiflorum). The reported microscopic renal lesions are acute tubular necrosis, most prominent in the proximal convoluted tubules. The compound or metabolite responsible for the toxic effects is presently unknown.
Dogs and cats (and occasionally cattle) are commonly poisoned by ethylene glycol. 1 , 23 Ethylene glycol is oxidized by alcohol dehydrogenase in the liver to toxic metabolites, which are associated with osmotic nephrosis and development of severe renal edema. If the animals survive the acute toxic insult, calcium oxalate crystals deposit in the tubular lumina, tubular cells, and interstitium. The tubular lesions are most severe in the proximal tubules.
In gentamicin-induced nephrotoxicosis in lambs, patchy tubular necrosis throughout the cortex, but most prominent in the juxtamedullary area, has been described. 8 Gentamicin binds to specific receptors in the brush border. After endocytosis, gentamicin accumulates in lysosomes and inhibits enzymes responsible for degradation of phospholipid-rich cell membranes. The lysosomes become enlarged and contain myeloid bodies (electron-dense lamellar structures containing undegraded phospholipids). Gentamicin-induced reduction in glomerular filtration rate is believed to be due in part to cationic-anionic binding of gentamicin to the glomerular endothelium. This binding results in a reduction in size and number of endothelial fenestrae and thereby a decrease in filtration pressure. 17 In spite of extensive research, there is still some uncertainty concerning the mechanisms of gentamicin nephrotoxicity. Accumulating evidence indicates that gentamicin may enhance the generation of reactive oxygen metabolites. 2 , 30
Mercury is a well-known nephrotoxic principle. The pars recta of the proximal tubules is the segment of the nephron most vulnerable to the toxic effects of mercury. 31 Several studies have suggested that induction of oxidative stress may be involved either directly or by predisposing tubular cells to oxidative stress. Some of the heavy metals (mercury, lead) are highly reactive with free sulfhydryl groups of cytosolic proteins, and in addition they inhibit oxidative phosphorylation in mitochondria.
The renal lesions we found in goats intoxicated with N. ossifragum show several similarities with the lesions described for gentamicin and mercury intoxication. As suggested for these two types of intoxication, the mechanisms for N. ossifragum intoxication could also be oxidative stress.
In conclusion, we have shown that the extract of N. ossifragum caused morphologic changes in kidney and functional disturbances. The nephrotoxic principle in N. ossifragum was shown to be fast acting, and early ultrastructural changes were observed in glomeruli, tubules, and vascular endothelium. The findings indicated that the kidney damage may be related to both direct toxic and secondary ischemic effects.
Footnotes
Acknowledgements
We thank Onelma Blomhoff and Aileen Murdoch Larsen at the electron microscopy unit of the Department of Pathology, National Hospital of Norway and Else Engeland at the electron microscopy unit at the Norwegian School of Veterinary Science for excellent preparation of the specimens for ultrastructural studies. The assistance of Jens Røhnebæk with animal management is also gratefully acknowledged.