
Abstract
Genotype-dependent differences in Marek's disease (MD) susceptibility were identified using 14-day-old line N and 61 (resistant) and 15I and 72 (susceptible) inbred chickens infected with HPRS-16 MD virus (MDV). All line 72 chickens developed progressive MD. Line 15I had fluctuating MD-specific clinical signs and individuals recovered. A novel histologic scoring system enabled indices to be calculated for lymphocyte infiltration into nonlymphoid organs. All genotypes had increased mean lesion scores (MLSs) and mean total lesion scores after MDV infection. These differed quantitatively and qualitatively between the genotypes. Lines 61 and 72 had a similar MLS distribution in the cytolytic phase, although scores were greater in line 72. At the time lymphomas were visible in line 72, histologic lesions in line 61 were regressing. AV37+ cells were present in similar numbers in all genotypes in the cytolytic phase, suggesting that neoplastically transformed cells were present in all genotypes regardless of MD susceptibility. After the cytolytic phase, AV37+ cell numbers increased in lines 72 and 15I but decreased in lines 61 and N. In the cytolytic and latent phases, in all genotypes, most infiltrating cells were CD4+. After this time, line 72 and 15I lesions increased in size and most cells were CD4+; line 61 and N lesions decreased in size and most cells were CD8+. In all genotypes, AV37 immunostaining was weak in lesions with many CD8+ cells, suggesting that AV37 antigen expression or AV37+ cells were controlled by CD8+ cells. The rank order, determined by clinical signs and pathology, for MD susceptibility (highest to lowest) was 72 > 15I > 61 > N.
Biological tumor regression is a well-recognized, but generally rare and poorly understood, phenomenon. 13 Increased tumor incidence in immunosuppressed hosts, 40 antibodies against tumor antigens, 49 and reactive cytotoxic lymphocyte (CTL) clones isolated from peripheral blood or tumor-infiltrating lymphocytes, 5 54 all provide evidence of a role for the immune system in tumor regression. Identifying the mechanisms involved has proved difficult because of lack of natural in vivo model systems, where host genetic and etiologic factors can be controlled. One exception to this is the naturally occurring avian retrovirus, Rous sarcoma virus (RSV). RSV induces tumors in chickens because it carries the v-src oncogene and after infection major histocompatibility (MHC) haplotype-determined sarcoma progression or regression occurs. The latter is CD8+ cell dependent and v-src seems to be the sole immunogen. 20 21 51
Herpesviruses have been associated with neoplasia in general, and lymphomas in particular, in humans and other species. Marek's disease (MD), an established model of herpesvirus-induced lymphoma, 9 60 is caused by an oncogenic α-herpesvirus (Marek's disease virus [MDV]) of chickens. We have studied this complex disease 9 46 in order to determine whether genotype-dependent tumor regression or progression occurs.
The chicken genotype has long been associated with resistance and susceptibility to MD and all genotypes are susceptible to lifelong MDV infection. 62 The MHC class I genes influence resistance to MD; chickens expressing the B21 allele (e.g., line N) are MD-resistant, although the mechanism is not known. 20 Additional, as yet unidentified, host genes also influence MD resistance and susceptibility. Line 61 and line 72 both express the same MHC class I allele (B2) but the former is MD resistant and the latter is MD susceptible. MD lymphoma regression in F1 progeny of a line 15 × 7 cross 53 has been described despite both parental lines being regarded as MD susceptible. 11 15
The life cycle of MDV is typical of the Herpesviridae with both cytolytic and latent stages. MD can be divided into cytolytic, latent, and tumor phases, 9 and, potentially, immunity can develop in any phase. MD lymphoma regression has been reported and suggested to be affected by virus and host genotype and specific immunity. 24 38 53 Payne and Biggs 30 classified lymphoproliferation in nerves taken from MDV-infected, outbred chickens as type A, lymphoproliferative infiltration and demyelination; type B, interneuritic edema with a light inflammatory infiltration of small lymphocytes and plasma cells and demyelination; or type C, light infiltration of small lymphocytes and plasma cells. Nerve lesions progress from type A to type B the longer individual chickens survive after the onset of MD-specific clinical signs, 24 38 whereas type C lesions are a mild form of type B lesions. 38 Evidence for specific antilymphoma immunity in MD has been obtained in systems involving vaccination of chickens with avirulent MD cell line cells. 12 32 42 However, antilymphoma immunity in MD, and the identity of potential immunogens, remains controversial. 50 To date, no studies using a specific MDV pathotype or defined host genotypes have been used to examine lymphoma regression in MD.
We infected four genotypes of chickens (lines 61, 72, 15I, and N) with a well-defined virulent pathotype of MDV (HPRS-16) and quantified resistance or susceptibility to MD lymphoma relative to the phase of MD (cytolytic, latent, tumor). The phenotypes of cells involved in lymphoid infiltrates in each genotype are described, with particular reference to those cells expressing a putative marker of neoplastic transformation recognized by the monoclonal antibody AV37. 47
Materials and Methods
Chickens and virus
Four inbred lines of chickens were used: line N (MD resistant) possesses the B21 MHC haplotype; line 61 (MD resistant) and line 72 (MD susceptible) both possess the B2 MHC haplotype; line 15I (MD susceptible) possesses the B15 MHC haplotype. All chickens were obtained from specific-pathogen-free flocks and were free of maternal antibodies against MDV. The chickens were housed in isolated conditions in filtered-air positive-pressure ventilated rooms, at the Institute for Animal Health. All were infected at 14 days of age by intra-abdominal (IA) injection of 1,000 plaque-forming units of serotype 1 MDV strain HPRS-16, grown in chick kidney cells (CKC), and suspended in 200 µl of Dulbecco modified Eagle medium (DMEM). Control chickens were given an IA injection of the same number of MDV-free CKC in DMEM (200 µl). All chickens were examined daily from 1 day postinfection (DPI) for clinical signs of disease in general (hunched posture, fluffed and ruffled feathers, anorexia, and adipsia) and MD (paresis, paralysis and proprioceptive deficits of limbs, crop dilation, gaping, cachexia, and head tilts). Chickens were killed when their clinical signs reached a terminal endpoint in accordance with UK Home Office guidelines.
Experiment 1
Experiment 1 defined MD in the four genotypes of chickens after infection with HPRS-16. Thirty line 15I, 5 line N, 5 line 61, and 10 line 72 chickens were infected with HPRS-16. All were examined daily and clinical signs were recorded. Any chicken with MD-specific clinical signs was separated from the others to prevent harassment by cage-mates. All line 72 and 15I chickens were examined postmortem. All tissues with gross lymphomas, nerves from chickens with paresis, paralysis, or proprioceptive deficits, and both brachial and sciatic nerves from the line 15I chickens surviving at the end of the experiment (155 DPI) were examined by histopathology.
Experiment 2
Experiment 2 examined the distribution and size of lymphoid infiltration in nonlymphoid organs from the four genotypes after HPRS-16 infection. Sixty chickens from each genotype were infected and 20 from each genotype were injected with uninfected CKC. Uninfected and infected chickens were housed separately. Where possible, five infected and two uninfected chickens from each genotype were selected using random numbers generated by Excel software (Microsoft Corporation, Seattle, WA, USA). The chickens were sampled at 3, 5, 7, 14, 21, 28, 35, 42, 63, and 100 DPI. When chickens had clinical signs consistent with the terminal endpoint, these were included in the sampling and additional chickens were chosen at random to make up the required numbers (i.e., at least five infected chickens per sampling day). At postmortem examination, all tissues were examined for gross pathology. Gross pathology was defined as any abnormality; this ranged from small opaque white blemishes (particularly on heart or liver) to gross, obvious lymphomas. Samples of skin, gonads, nerves (both brachial and both sciatic plexuses), proventriculus, heart and liver, and any other nonlymphoid organs that had gross pathology were taken for histologic examination.
Tissue blocks (<5 × 5 × 3 mm) were fixed in buffered formaldehyde-saline and processed for examination using hematoxylin and eosin (HE). A scoring system was developed (0–5), based on the amount of lymphoid infiltration, for each organ (Fig. 1). An example of each score for each organ was chosen and a photomicrograph was taken and used as a standard reference. Because some organs, particularly nerves, had different amounts of lymphoid infiltration in different areas, the areas with the most infiltration were recorded. The very few nerves with type B or C pathology could not be scored in the 0–5 system and were not included in the averages. All samples taken on a given day were examined on the same occasion. Slides were examined at random (i.e., scored blind) and each section was scored after comparison with the reference photomicrographs. The results for each organ were sorted according to the line of chicken so that mean lesion scores (MLSs) for each organ could be calculated. The combined scores obtained for all organs in each chicken were used to calculate the mean total lesion score (MTLS) for each line of chicken.
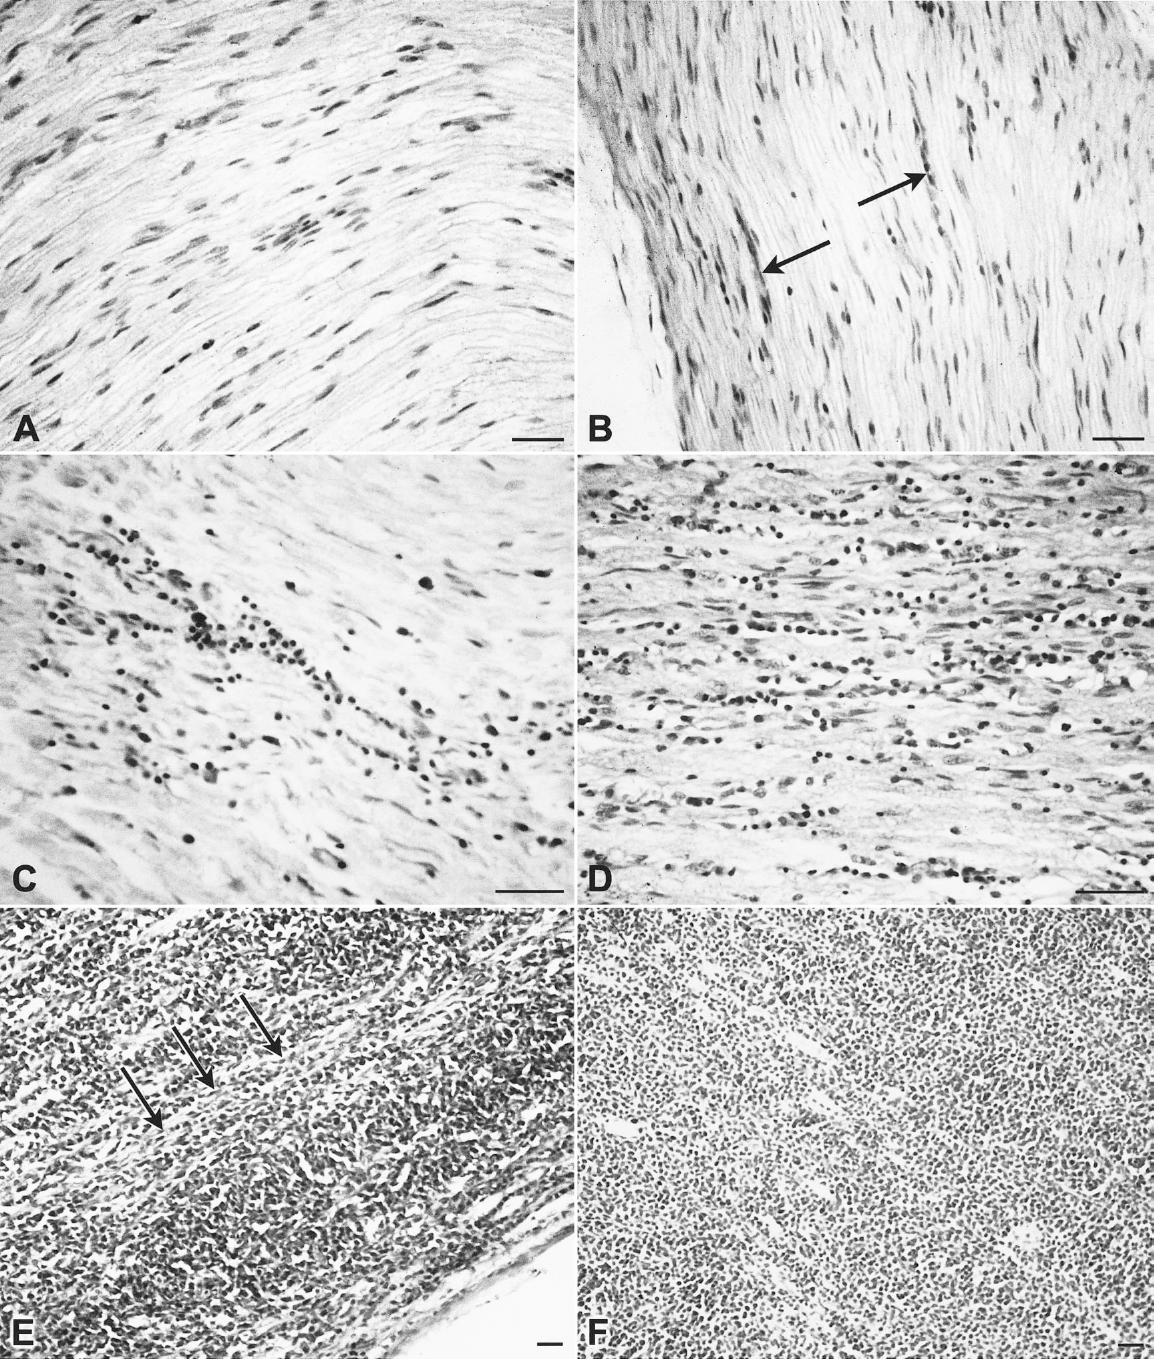
Examples of the histopathologic scoring system. All sections are of sciatic or
brachial nerve fixed in buffered formaldehyde-saline and processed for
examination using hematoxylin and eosin.
Tissue blocks (<1 cm3) were processed for immunohistochemical examination by placing them on a drop of optimal cutting temperature (OCT) embedding medium (BDH Laboratory Supplies, Poole, UK) on a square of Whatman (Maidstone, UK) filter paper (5 cm2) and cooling in nitrogen vapor before immersion in liquid nitrogen and transferring to a −70 C freezer for storage. On each sampling day, for both MDV-infected and uninfected chickens of each genotype, sections (6–8 µm) of the same organ were cut using a Cryocut cryostat (Reichert-Jung, Arnsberg, Germany), placed on the same glass slide, and stored in a dessicator before acetone fixation (10 minutes, then air dried) and immunostaining (e.g., all liver samples from line 15I chickens, at 7 DPI, were on the same slide). Thus, sections from the same organs, but different individuals within a genotype, were subjected to identical processing and staining conditions. This was important because infected tissues could be directly compared with uninfected tissues within each genotype.
Monoclonal antibodies
Monoclonal antibodies (MAbs) were diluted using phosphate-buffered saline containing 2 mg/ml bovine serum albumin, fraction V (Sigma, Poole, UK), pH 7.4 (PBA). One hundred microliters of each MAb (or pair of MAbs) was used per slide and sections were incubated at room temperature for 1 hour in a humidified chamber. MAbs used were CT4 and CT8 23 (recognizing chicken homologues of CD4 and CD8α, respectively; Southern Biotechnology Associates Inc., Birmingham, AL, USA), AV20 48 (recognizing a monomorphic determinant of the chicken B-cell surface antigen Bu-1), AV37 (a putative marker of neoplastic transformation expressed by cell-line cells transformed by MDV and other oncogenic viruses), 47 or the appropriate isotype-matched control MAb, RSVG-MAb29 or RSVG-MAb30 (both recognizing bovine respiratory syncitial virus G [RSVG] protein; a gift from Dr. G. Taylor, IAH Compton, Berkshire, UK).
Immunohistology
All washes used PBA. For single immunostaining, the acetone-fixed sections were washed three times and incubated with the MAb of interest or an isotype-matched control MAb. They were then washed three times, incubated with a 1:100 dilution of rabbit anti-mouse antiserum conjugated to horseradish peroxidase (HRP; Southern Biotechnology Associates Inc.), and washed a further three times before identifying the peroxidase activity developed using freshly prepared and filtered 0.5 mg/ml 3,3′-diaminobenzidine-tetrahydrochloride (Sigma) in 0.05 M Tris (hydroxymethyl-methylamine), pH 7.6 (BDH). Hydrogen peroxide was added to a concentration of 0.01% just before use. Finally, slides were incubated at 37 C for 10 minutes and washed twice in PBA, once in distilled water, counterstained with Meyer's hematoxylin, washed in tap water and mounted in Aquamount (BDH).
For isotype-specific, two-color immunostaining, all sections, washes, MAb preparations, and volumes used were as described for single-color immunostaining. Slides were double-stained with AV37 and either (the isotype mismatched MAb) AV20, CT4, or CT8 (100 µl), washed twice, and incubated with two appropriate isotype-specific rabbit anti-mouse conjugated antibodies (Southern Biotechnology Associates Inc.). The secondary MAbs were conjugated to either HRP or alkaline phosphatase (ALP) and used at 1:100 with the exception of anti-immunoglobulin G1 (IgG1) HRP (1:25). Slides were then washed and incubated at 37 C for 30 minutes in freshly prepared, filtered, ALP substrate. The slides were washed again, then incubated in freshly prepared, filtered, HRP substrate at 37 C for 10 minutes. Finally, slides were washed, counterstained, and mounted as described above.
Confirmation of MDV infection
The following was carried out on samples from any chicken that had no MDV pathology. Sections were cut from all formalin-fixed tissue samples taken from each chicken and processed as described above except the processing was stopped before HE staining. Each tissue section was then scraped from the histology slide, using a new scalpel blade each time, into a 0.5-ml microfuge tube (Eppendorf-Netheler-Hinz GmbH, Hamburg, Germany). The DNA was extracted and interferon γ (IFNγ)-specific and MDV-specific polymerase chain reactions (PCRs) were performed as described by Burgess and Davison. 7
Statistical analysis
Values for the mean and standard error of the mean were used for statistical analyses. Data were analyzed by analysis of variance. When more than two lines were compared, comparisons between individual lines were made using the pooled standard error in a Student's t-test. Tissues were not analyzed on the basis of sex. All data were processed using Excel software.
Results
PCR
All PCRs were positive for MDV regardless of the clinical or pathologic signs of the chicken from which samples were taken.
Experiment 1
Clinical signs
MD-specific clinical signs were never observed in lines N and 61. Up to, and including, 7 DPI, line 61 chickens did have ruffled feathers and scurfy skin. One line 72 chicken died from an undetermined cause at 2 DPI. Excluding this individual, the mean time to first MD-specific clinical signs in line 72 chickens was 66.0 DPI (range, 48–99 DPI) and the mean time to mortality was 70.3 DPI (range, 48–110 DPI; Table 1). Only one out of nine line 72 chickens showed any signs of recovery after separation from its cage mates and generally MD-specific clinical signs rapidly and progressively became more severe (Fig. 2). A greater proportion of line 72 chickens died peracutely than line 15I chickens (4 of 8 compared with 3 of 30). Twenty-six line 15I chickens developed MD, the mean time to first clinical signs was 95.1 DPI (range, 42–149 DPI), and the mean time to mortality was 113.9 DPI (range, 42–154 DPI). Four line 15I chickens never developed MD-specific clinical signs. Fourteen out of 30 line 15I chickens showed signs of recovery, particularly after separation. Five line 15I chickens were killed despite showing clinical improvement. Chickens that did show clinical improvement had neurologic signs only. Two line 15I chickens that had shown paralysis went on to full clinical recovery but remained cachexic. In 14 of 30 line 15I chickens the MD-specific clinical signs fluctuated.
Manifestation of Marek's disease (MD) in four genotypes of chickens.∗
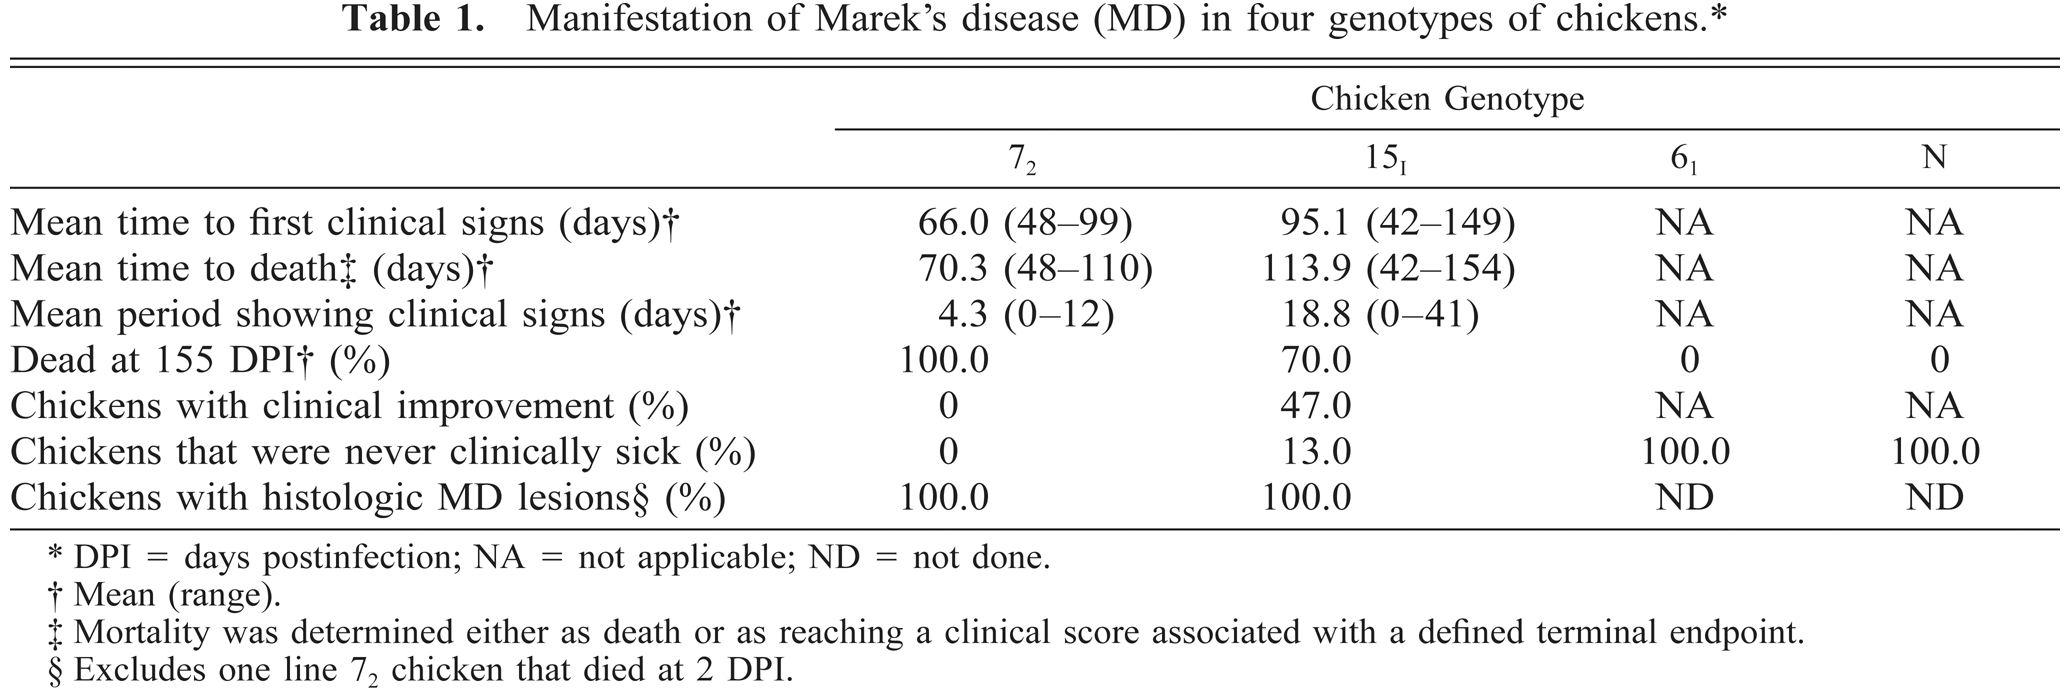
DPI = days postinfection; NA = not applicable; ND = not done.
Mean (range).
Mortality was determined either as death or as reaching a clinical score associated with a defined terminal endpoint.
Excludes one line 72 chicken that died at 2 DPI.
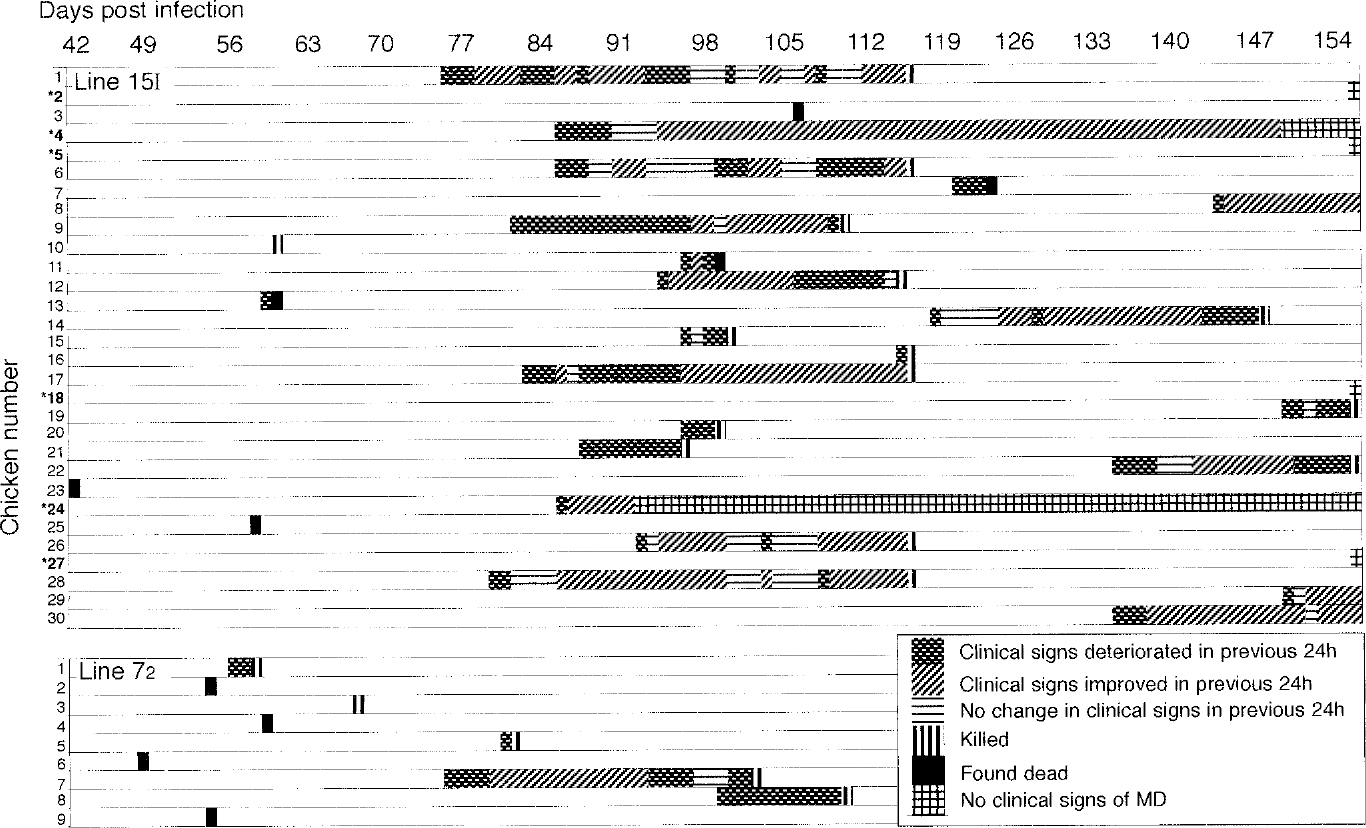
The clinical progression of MD in line 72 and line 15I chickens. Data are shown from 42 to 155 DPI. Birds were examined daily and their clinical signs were compared with those of the previous day. The key is shown on the figure. ∗Bold numbers = line 15I chickens that had type B or C neuropathology.
Gross pathology
The most common gross lesions in line 15I chickens were neural. Although multiple nerves were affected in 11 of 30 line 15I chickens, gross lymphomas in multiple tissues occurred in only 2 of 30 line 15I chickens, compared with 5 of 8 line 72 chickens. Two of the line 15I chickens that were found dead had no MD-specific lesions. Of the four line 15I chickens that never showed MD-specific clinical signs, three had no detectable abnormalities and one had mild nerve enlargement in one brachial and one sciatic plexus.
Histopathology
All line 72 and 15I chickens, except for the one line 72 chicken that died at 2 DPI, had typical MD microscopic pathology of heterogeneous lymphoid infiltration. Type A neural lesions occurred in all line 72 chickens and the line 15I chickens with progressive MD. Type B or C neural lesions occurred only in line 15I chickens that were recovering from, or never showed, MD-specific clinical signs (Fig. 2: bird Nos. 2, 4, 5, 18, 24, and 27). In all other respects, the histologic appearance of lymphomas from both susceptible lines was identical.
Experiment 2
Clinical signs
During the first 3 DPI the feathers were ruffled in all lines. Four chickens (three line 72 and one line 15I) died during the first night after infection. All surviving chickens, of all genotypes, were clinically normal from 4 to 18 DPI. From 18 DPI all line 61, 72, and 15I chickens had ruffled feathers and scurfy skin. All line 72 chickens showed MD-specific clinical signs, the first at 28 DPI. The first line 15I chicken had MD-specific clinical signs at 63 DPI. By 100 DPI five of nine remaining line 15I chickens had never shown MD-specific clinical signs and those that did had fluctuating clinical signs. All line N chickens remained clinically normal from 3 DPI.
Gross pathology
The gross pathology results are summarized in Table 2. Splenomegaly was evident in five of five line 72 chickens and five of five line 15I chickens at both 3 and 5 DPI and in one of five line 15I chickens at 7 DPI. At 7 DPI splenomegaly was present in five of five line 61 chickens and five of five line N chickens. At 14 DPI two of five line 61 chickens and five of five line N chickens had splenomegaly. Gross lesions in nonlymphoid organs ranged from small white spots to obvious tumors.
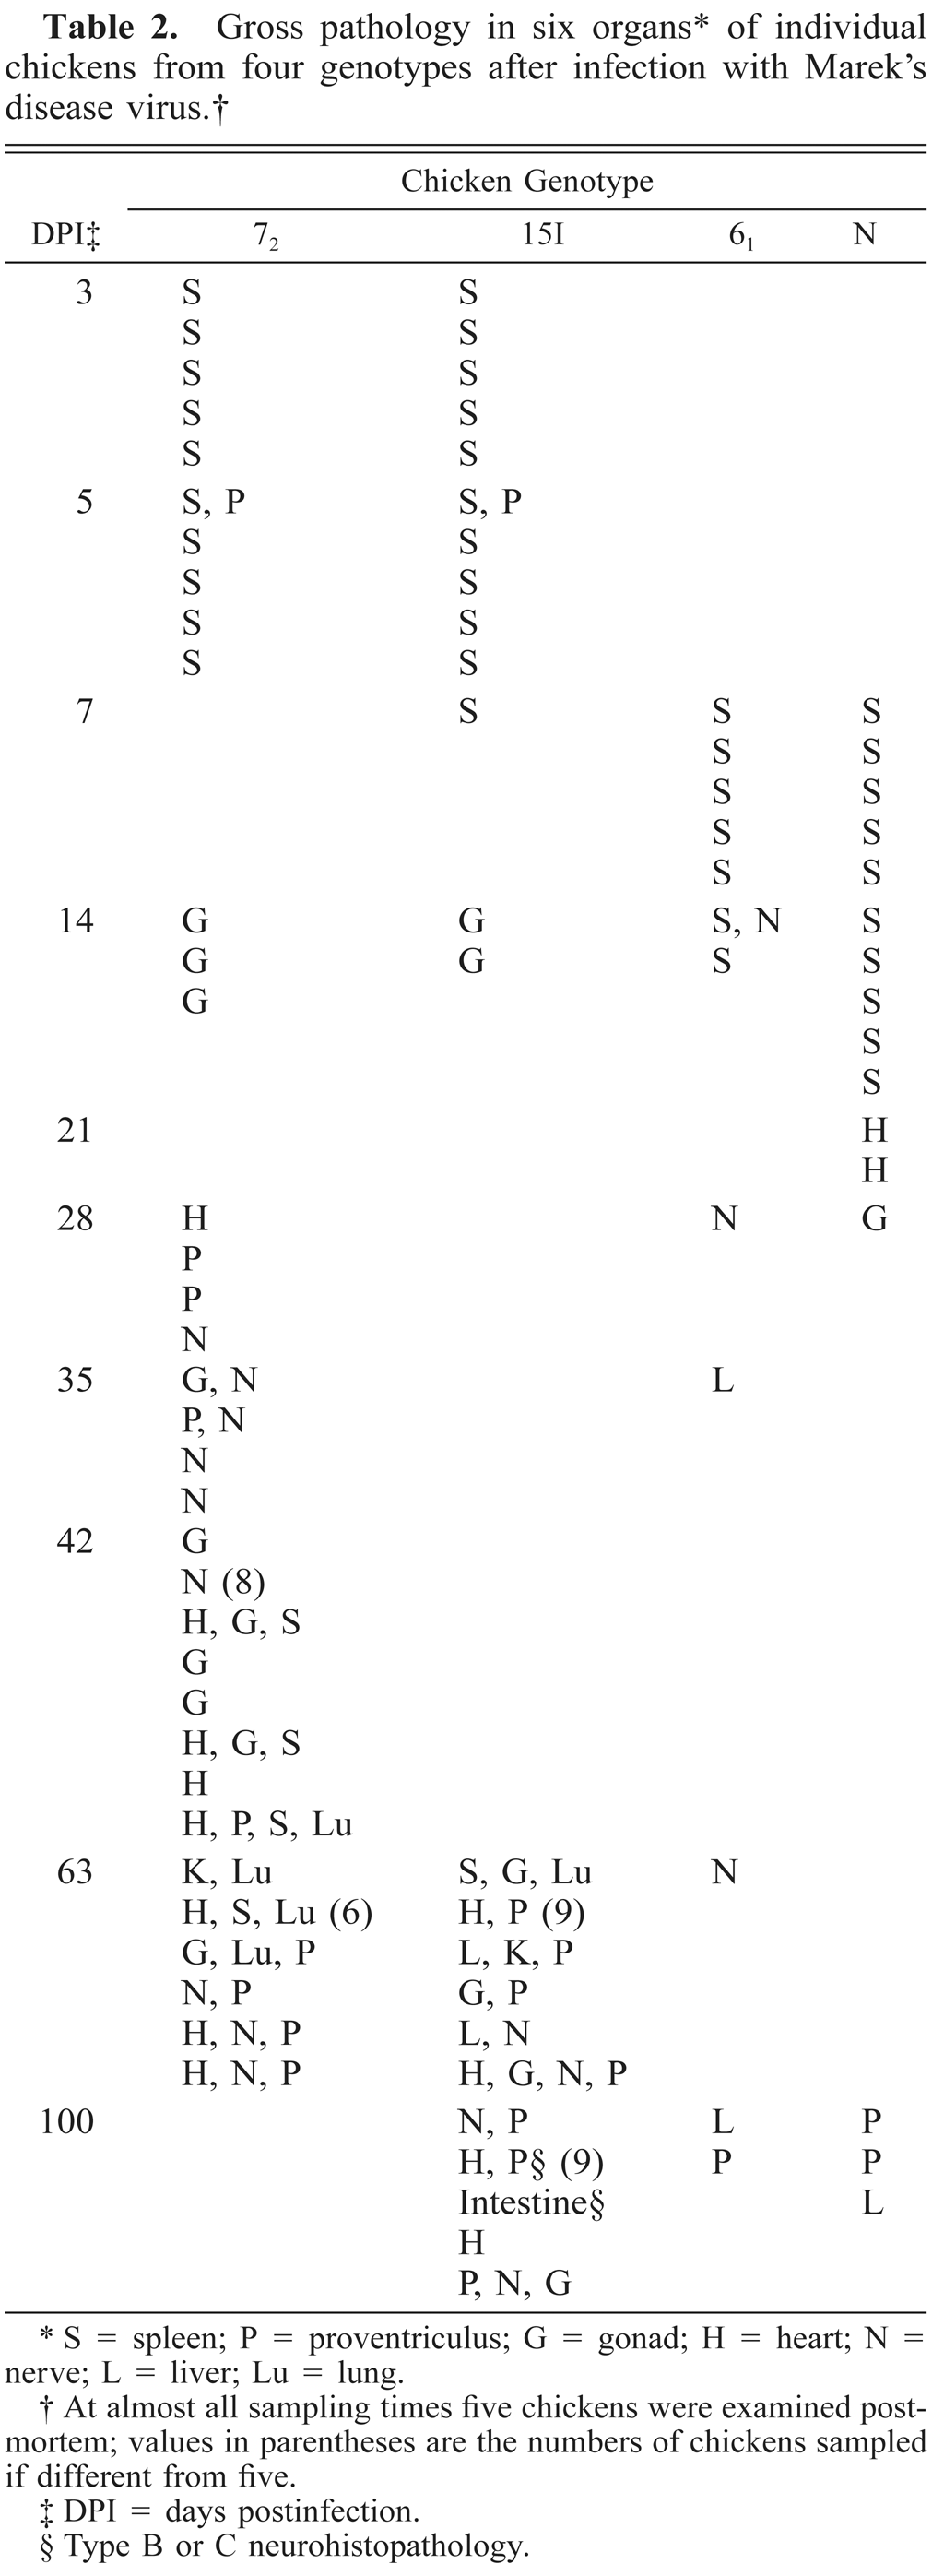
S = spleen; P = proventriculus; G = gonad; H = heart; N = nerve; L = liver; Lu = lung.
At almost all sampling times five chickens were examined postmortem; values in parentheses are the numbers of chickens sampled if different from five.
DPI = days postinfection.
Type B or C neurohistopathology.
Marek's disease (MD)-specific clinical signs, gross pathology, and histopathology in six organs of line 15I chickens at 100 days postinfection with MD virus.∗
N = nerve; Sk = skin; P = proventriculus; H = heart; L = liver; G = gonad; I = intestine; NAD = no abnormality detected.
Score from 0 (no MD-specific histopathology) to 5 (complete obliteration of organ architecture by lymphoid infiltration), as described in the text.
— = Type B or C lesion; not able to be scored.
The first gross pathology occurred at 5 DPI when enlargement of the proventriculus occurred in one of five line 72 chickens and one of five line 15I chickens. At 14 DPI mild lesions were present in the gonads in three of five line 72 chickens and two of five line 15I chickens. Obvious, but small, tumors appeared in line 72 chickens from 28 DPI but did not appear until 63 DPI in line 15I. At later time points, lymphomas in multiple organs occurred in line 72 and line 15I chickens. A minority of line 61 and line N chickens had gross pathology from 14 DPI. At 100 DPI two of five line 61 chickens and three of five line N chickens had small hepatic or proventricular tumors. Multiple organs were almost never affected in individual chickens of these lines.
Histopathology
No statistically significant difference (P > 0.10) was found in the MTLSs (Fig. 3) or MLSs (Fig. 4) between any of the genotypes of uninfected chickens at any time point, so the results from uninfected controls of the different genotypes were pooled. After infection with MDV, lymphoid infiltration was observed in all organs of all genotypes (Fig. 4).
Mean total lesion scores for four genotypes of chickens after MDV infection. The mean total lesion score is derived from the lesion scores of tissues taken from skin, gonads (testes and ovary combined), both brachial and both sciatic nerve plexuses combined, proventriculus, heart, and liver. Values shown are means ± standard error of the mean. ♦—♦ MDV infected; □— — —□ uninfected control. Statistically significant differences are denoted as follows: ∗P < 0.05; ∗∗P < 0.01; ∗∗∗P < 0.001. The control values are pooled from two uninfected chickens of each line. At most time points, five chickens were sampled. At 42, 63, and 100 DPI, more than five chickens were sampled from lines 72 and 15I.
Mean lesion scores by organ for tissues taken from skin, gonads (testes and ovary combined), both brachial and both sciatic nerve plexuses combined, proventriculus, heart, and liver. Values shown are means ± standard error of the mean. ⋄——⋄ MDV infected; □— — —□ uninfected control. Statistically significant differences are denoted as follows: ∗P < 0.05; ∗∗P < 0.01; ∗∗∗P < 0.001. The control values are pooled from two uninfected chickens of each line. At most time points, five chickens were sampled. At 42, 63, and 100 DPI, more than five chickens were sampled from lines 72 and 15I.
The MTLSs for all genotypes of MDV-infected chickens were significantly (P < 0.05) greater than those of the uninfected chickens at some time after infection (Fig. 3). In lines 72 and 15I this was evident on all sample days. In line 61 it was evident at 28, 42, and 63 DPI in line 61 chickens and at 3, 7, 14, 42, and 63 DPI in line N chickens. The MTLS of line 72 increased at a greater rate than that of line 15I (slope: line 72 = 0.28 MTLS units/DPI; line 15I = 0.10 MTLS units/DPI), and to a greater extent (mean maximum: line 72 = 16.17 ± 0.42 MTLS units; line 15I = 12.80 ± 0.78 MTLS units). The MTLS plateaued from 42 DPI in line 15I. In lines 61 and N the MTLS increased but to a lesser extent than in line 15I (mean maximum: line 61 = 7.6 ± 0.66 MTLS units at 42 DPI; line N = 8.3 ± 0.85 MTLS units at 63 DPI). In line N, the MTLS was significantly increased at 42, 63, and 100 DPI (P < 0.05), but no significant (P > 0.05) increase was found in MTLS between 42 and 100 DPI. In line 61, no significant (P > 0.05) difference was found in MTLS between 42 and 63 DPI but it decreased (P < 0.05) at 100 DPI.
Type B and C lesions were only observed in the nerves of three of nine line 15I chickens sampled at 100 DPI; two of these had gross pathology in other organs (Tables 2, 3). Within these type B and C lesions, densely packed accumulations of small lymphocytoid cells with pyknotic nuclei occurred around vascular areas of the nerve (Fig. 5). Any neural lesions in the remaining line 15I chickens and in lines 61, 72, and N were of type A. When MLSs from each organ were analyzed, the contribution of each to the MTLS varied between the genotypes. In lines 72 and 15I, all organs examined had increased MLSs (Fig. 4). Those that contributed most to the MTLS were nerve, proventriculus, heart, and skin in line 72; nerve, proventriculus, and gonad in line 15I; nerve and skin in line 61; and proventriculus and liver in line N. The values for MLSs in skin were similar in lines 72 and 61 until 35 DPI, after which the values decreased in line 61.
Sciatic nerve, fixed in buffered formaldehyde-saline and processed for examination using hematoxylin and eosin. Histopathology in a line 15I chicken at 100 DPI. Type B nerve lesion, with densely packed accumulation of small lymphoid cells with pyknotic nuclei around a vascular area of the nerve (arrow). Bar ≅ 100 µm.
Immunohistology
All organs that were scored by histopathology, except skin, were examined at 3, 5, 7, 14, 21, 35, and 42 DPI by immunohistology. Lymphoid infiltration was present in tissues from infected chickens from lines 72 and 15I from 5 DPI and lines 61 and N from 7 DPI. In all lines these consisted of centrally located CD4+ cells with a few peripheral CD8+ cells. In lines 72 and 15I, the lesions expanded and CD4+ cells remained the majority, whereas CD8+ cells were rare and peripheral. However, in lines 61 and N, lesions remained small and at 14 and 21 DPI similar proportions of CD4+ and CD8+ cells were similar (Fig. 6a–e). From 35 DPI in line 61, and especially in line N, lesions became extremely rare and difficult to find. Bu-1+ cells were rare in all lesions examined.
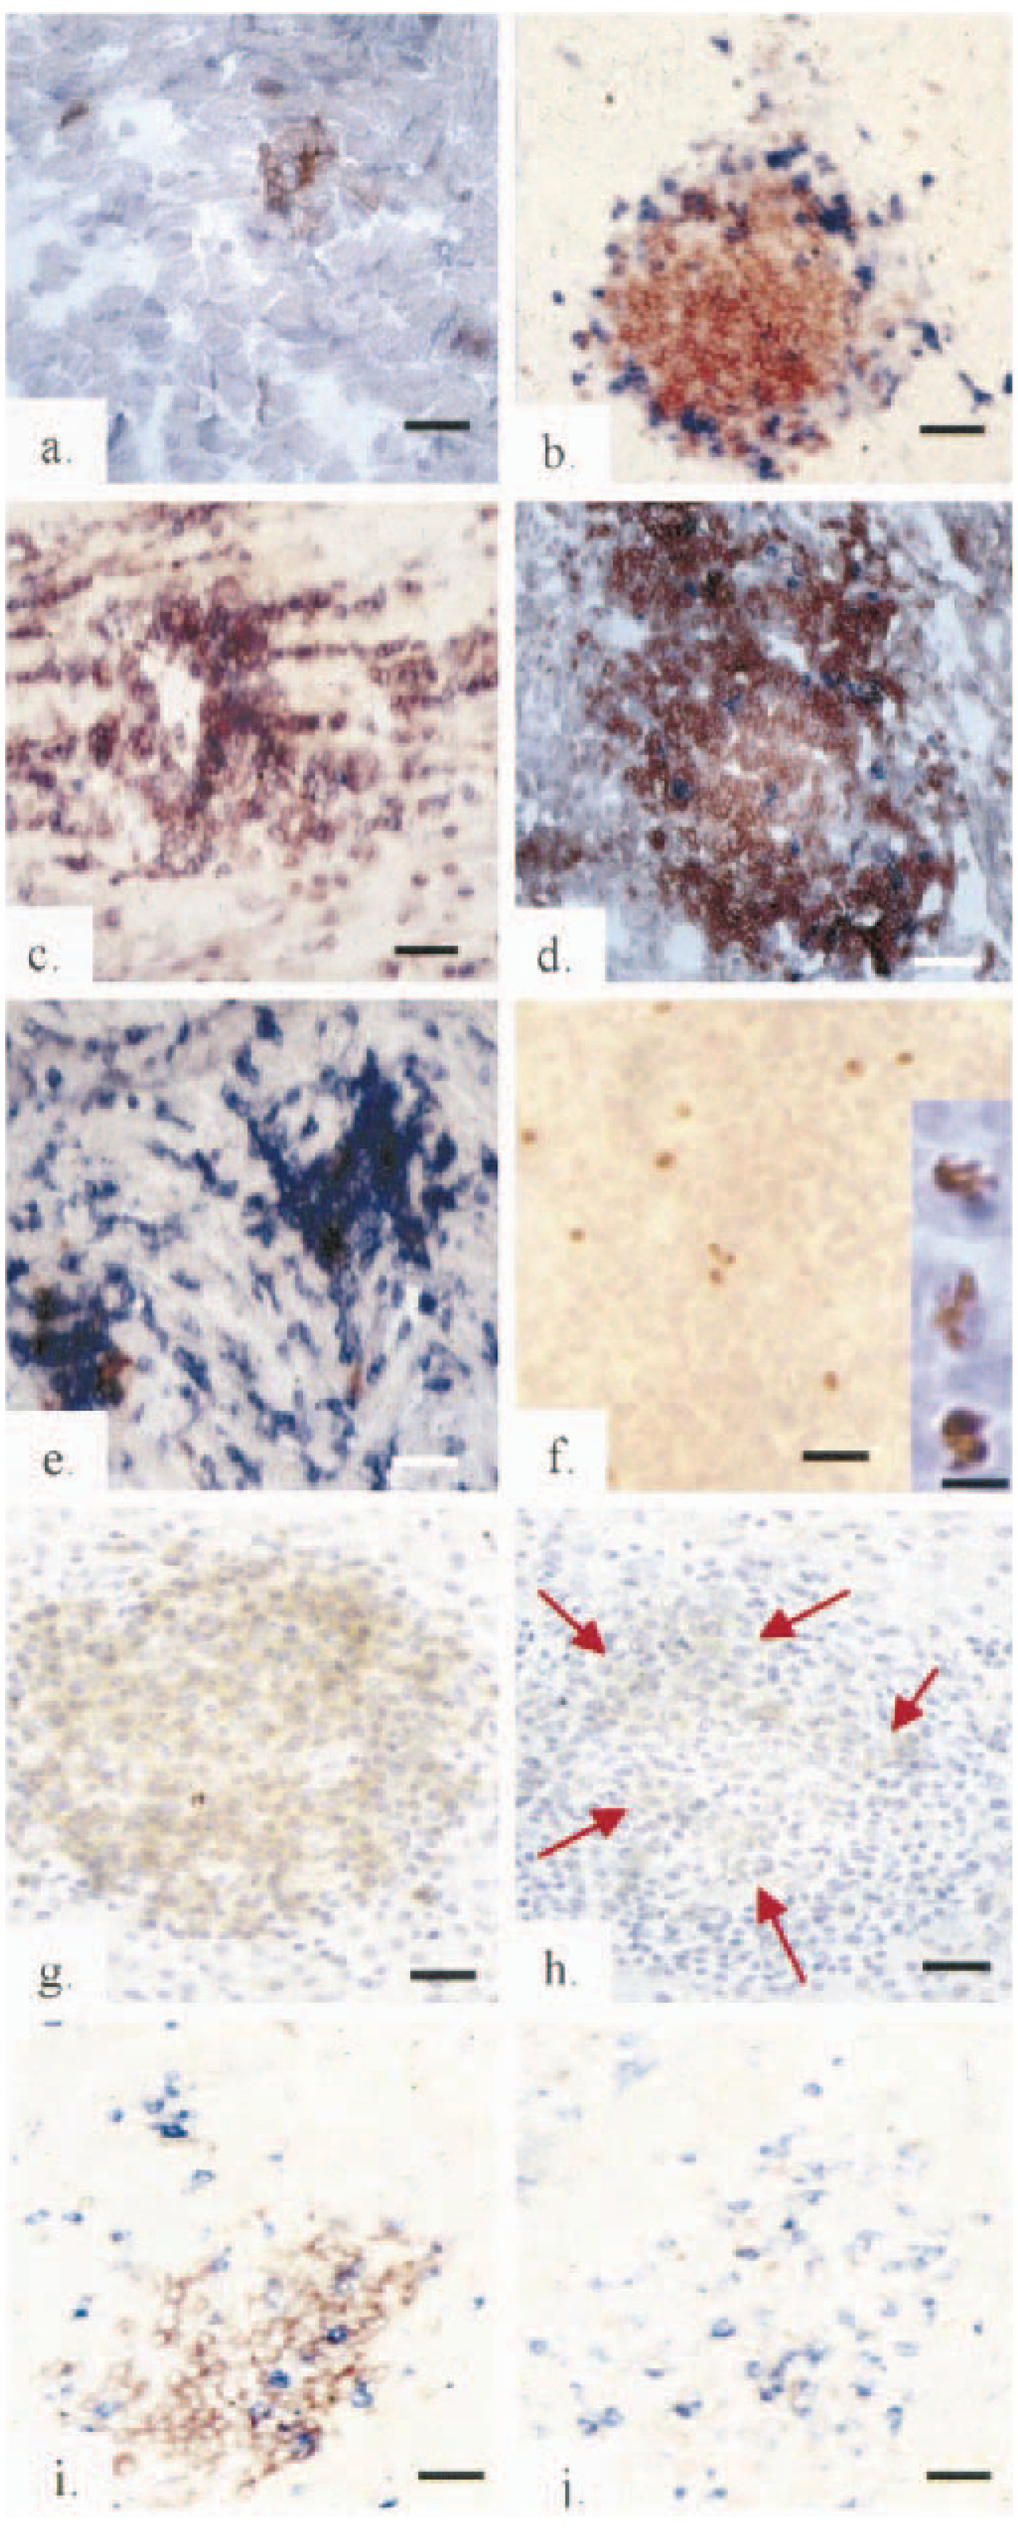
Immunohistology of infiltrating lesions in acetone-fixed sections of
brachial and sciatic nerve plexuses in lines 61 at 7 DPI
(
AV37+ cells surrounded by AV37− CD4+ cells (Fig. 6g, h) were present in lesions in organs from infected chickens of all genotypes but were never seen in organs from uninfected chickens. In a few lesions from line 72 and 15I chickens, relatively high proportions of CD8+ cells were present. When this occurred, the AV37 immunostaining was pale (Fig. 6j). In lines 61 and N, the AV37+ cells were scattered and their nuclei were apoptotic (Fig. 6f). By 42 DPI AV37+ cells were extremely rare in these genotypes. It was not possible to establish conclusively whether CD8+ or Bu-1+ cells were also AV37+.
Discussion
Experiment 1 defined a system for comparing relative resistance to MD in chickens of different genotypes. Experiment 2 described differences in pathology between the genotypes. MD is a complicated disease and in order to analyze our results we have divided it into phases based on clinical signs in the susceptible host. The cytolytic and latent phases were defined after Calnek 9 and the tumor phases (early and late) were defined as the times that each susceptible genotype first developed clinical MD (gross lymphomas). The phases of disease in the host should not be confused with stages of the MDV replication cycle and virus gene expression. It is possible to have cytolytically infected cells in chickens that are clinically in the latent phase of MD (or even in so-called latently infected cultured MDV-transformed lymphoma cell lines). 46 Organ sampling times were chosen to compare the chicken genotypes at defined times postinfection.
Only lines 72 and 15I developed clinical MD. The MD-specific clinical signs differed between these genotypes. The clinical signs were progressive in line 72 but fluctuated, or on occasion were never seen, in line 15I. The onset of these clinical signs was, on average, 29 days later in line 15I. The two resistant lines (and the few line 15I individuals that did not have clinical MD) developed subclinical MD (i.e., microscopic lymphocyte infiltration of nonlymphoid organs). From our results we rank MD susceptibility to HPRS-16 MDV (most susceptible to least) as line 72 > 15I > 61 > N.
Although each genotype had distinct patterns of gross pathology (Table 2), all had splenomegaly. This occurred at 3 and 5 DPI in lines 72 and 15I but at 7 and 14 DPI in lines 61 and N. It is difficult to explain why splenomegaly in the resistant genotypes occurred later than in the susceptible genotypes. Others 1 2 6 27 have suggested that the initial cytolytic infection and associated inflammatory responses are smaller in the MD-resistant genotypes.
At the cellular level, perivascular lymphocyte accumulations (<1 MLS unit) could be observed in sections of all organs from uninfected chickens of all genotypes. However, in the skin, proventriculus, and liver of some uninfected chickens, individual lesion scores approached 3. These were mainly in older birds and may be areas of normal lymphoid accumulation, 18 areas of lymphoid apoptosis, 59 or an immune response to antigens from nonpathogenic agents (e.g., food or commensal microorganisms). The spleen was not included in the histologic analysis of lymphocyte infiltration because it is primarily a lymphoid organ and as such outside the scope of this study. Autonomic nerves were also not included although lymphoid infiltration into these could have been an indirect cause of the cachexia observed in those line 15I chickens with no other pathology.
The MLS, measuring organ-specific lymphocyte infiltration, and the MTLS, measuring lymphocyte infiltration into all organs examined, differed between the genotypes. This is most clearly demonstrated by plotting MTLS trends (Fig. 7). Like clinical signs, MTLSs in line 72 increased progressively. During the cytolytic phase, and early latent phase, MTLSs of line 15I increased at a similar rate to those of line 72. The MTLS then plateaued, before increasing again, at a similar rate to that of line 72 in the early tumor phase. After this the MTLS again plateaued, coincident with the fluctuating clinical signs. In contrast to line 72, nerve contributed most to the MTLS in line 15I. All line 72 and 15I chickens with progressive MD had type A neuropathology, whereas those line 15I chickens with fluctuating clinical signs, and those that recovered completely, had type B or C neuropathology. This is consistent with observations in outbred chickens suggesting that type B and C lesions are associated with lymphoma regression. 24 38 The densely packed aggregations of pyknotic lymphocytoid cells in nerves with type B or C pathology represent cells in the early stages of programmed cell death and are further evidence of lesion regression.
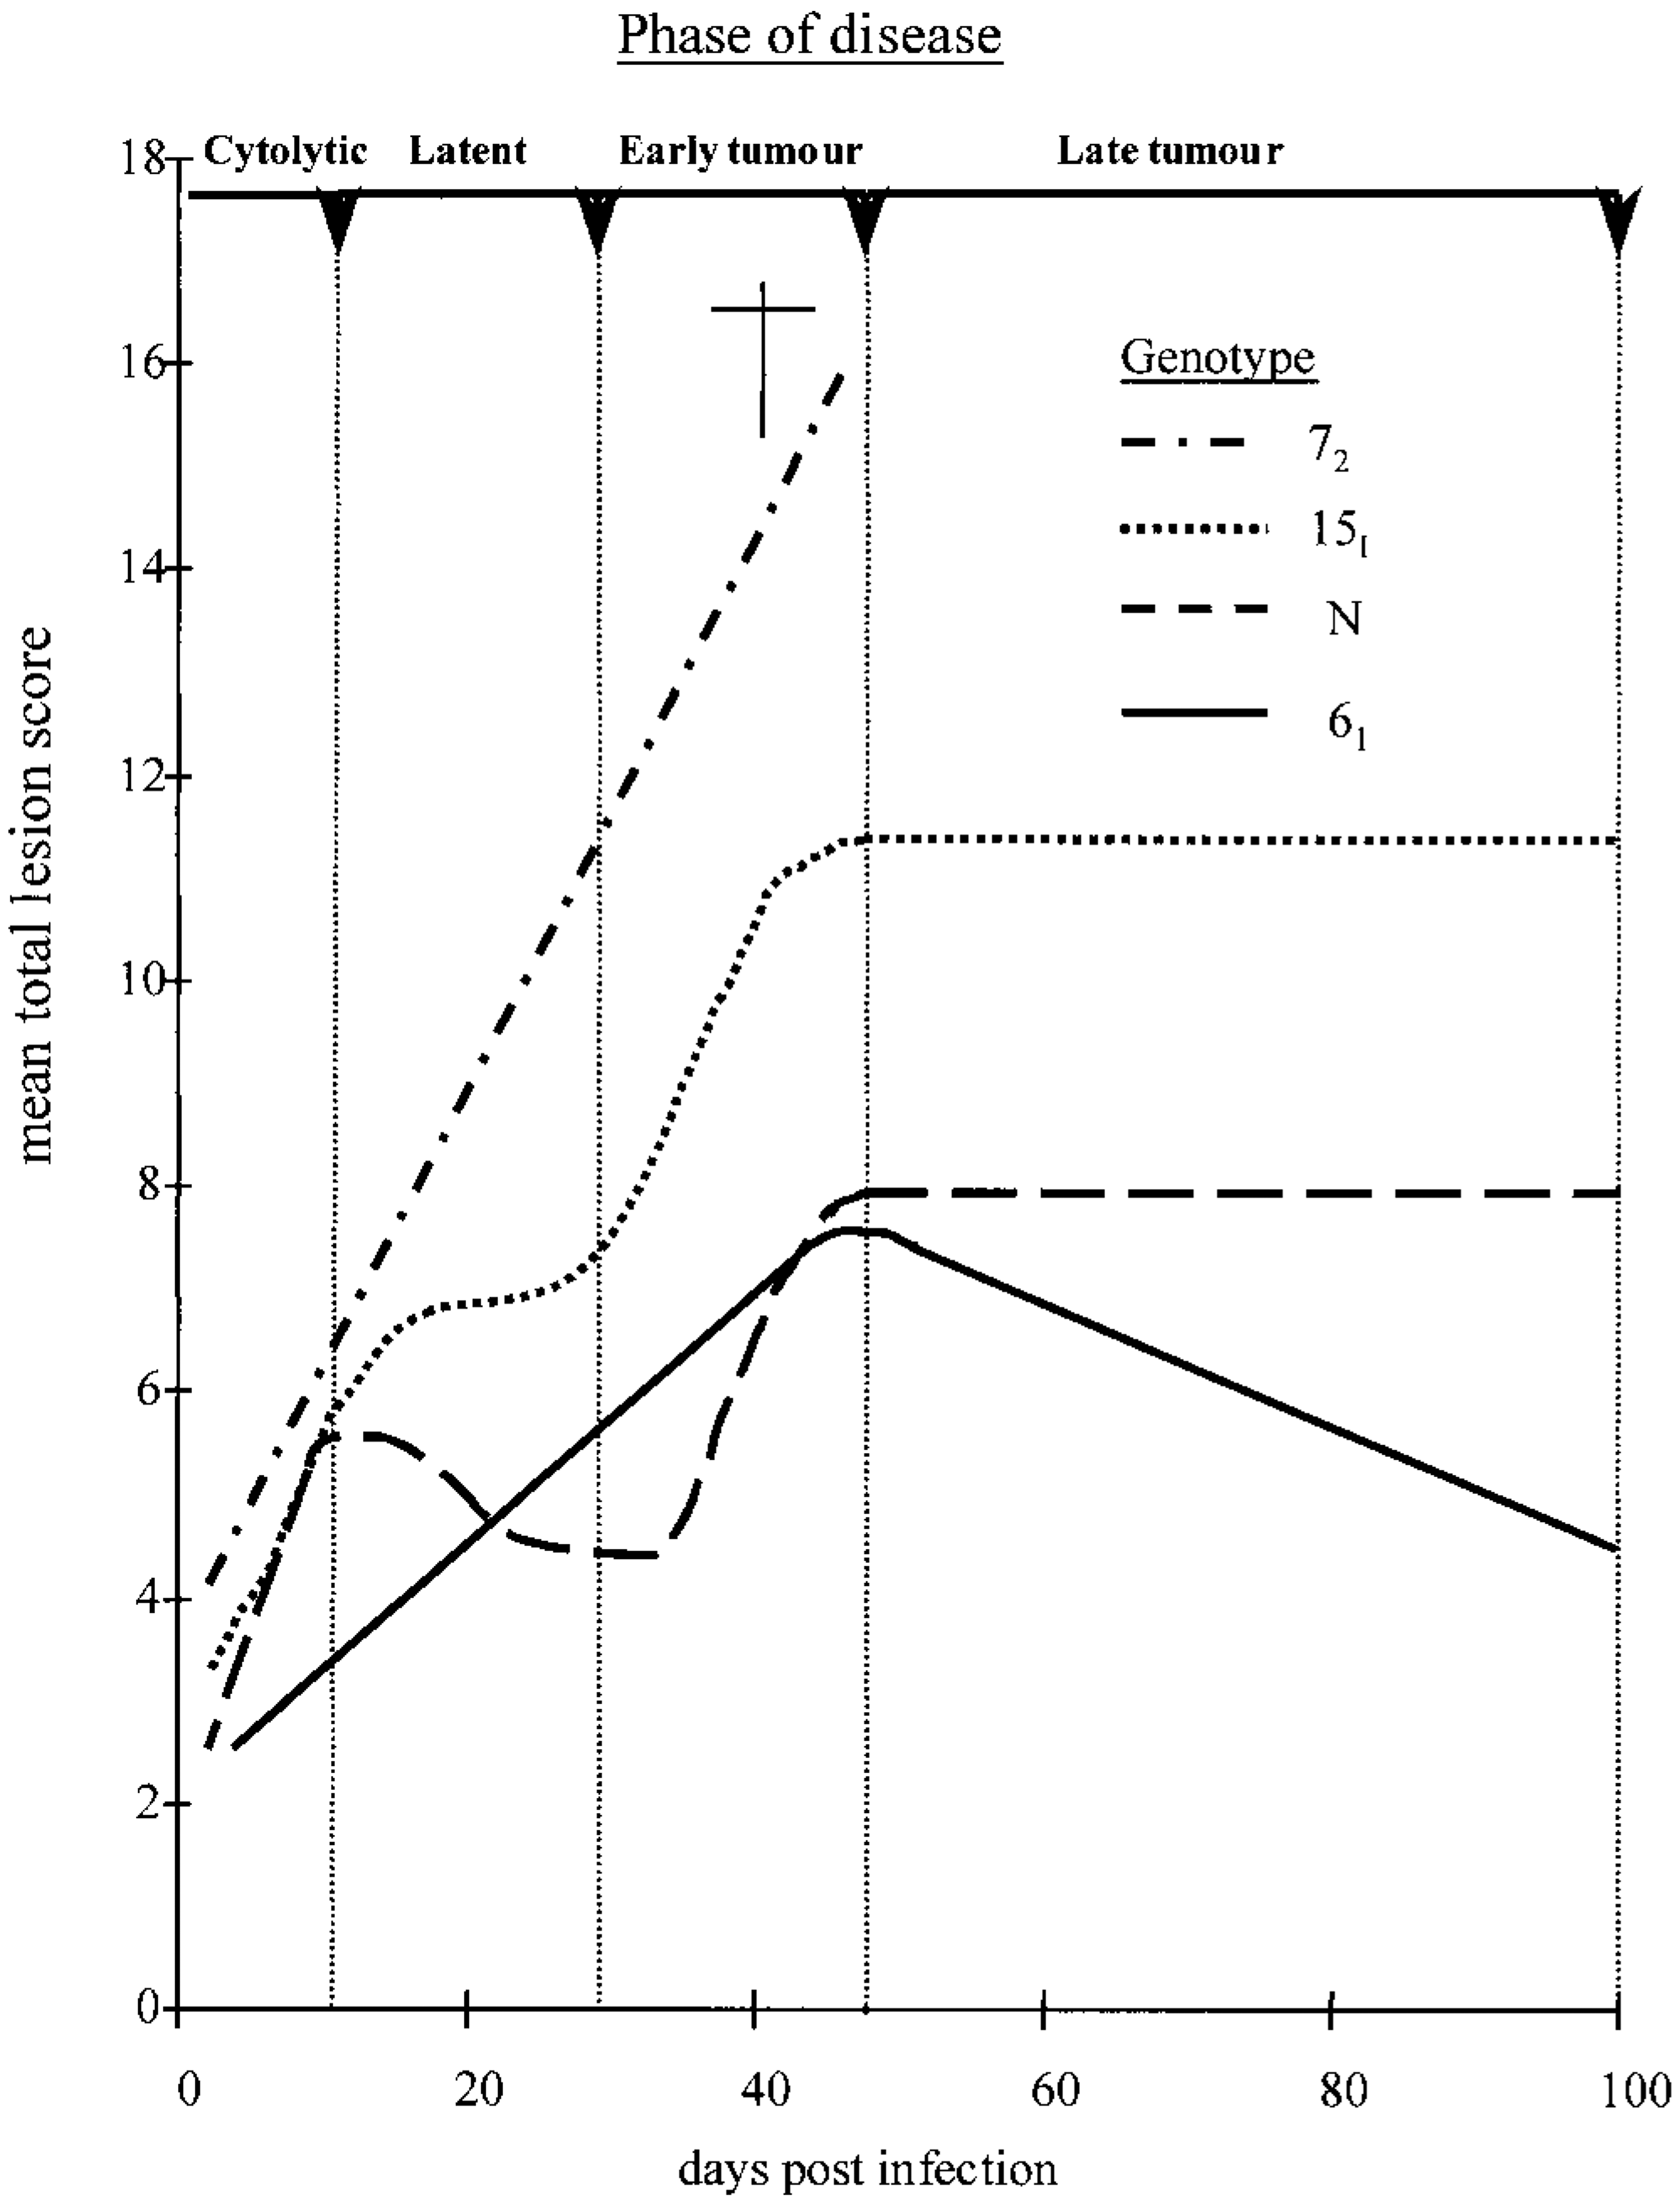
Trends in mean total lesion score relative to days postinfection in four genotypes of MDV-infected chickens. Trend lines were derived from the mean total lesion score data in Fig. 3.
In line 61 the MTLS increased from the cytolytic to the early tumor phase, after which it decreased. Although the MLS distribution differed between lines 61 and 72, the amount of lymphoid infiltration in skin was similar up to 35 DPI. Lymphocytes infiltrating the skin could either be MDV-infected or specifically reactive to productive MDV antigens in the feather follicle epithelium. 37 Similar amounts of MDV may be shed by these two genotypes up to 35 DPI despite differences in blood MDV load 28 and MD susceptibility. Several possibilities could account for the differences between line 61 and 72 in MLS: the numbers of activated lymphocytes migrating across endothelia and into tissues could be greater in line 72; lymphocytes may migrate into tissues in similar numbers and with similar affinities in both genotypes, but only in line 72 do they neoplastically transform and clonally expand in situ; and only neoplastically transformed cells that are present in line 72 cross the endothelium.
The MTLS increased from the cytolytic to early tumor phase in both lines but the rate was lower in line 61; the MTLS began to decrease in line 61 at the time gross lymphomas occurred in line 72. This suggests that effective MD resistance in line 61 occurs during both the cytolytic and tumor phases. This resistance cannot be MHC-associated because both lines have identical MHC class I and class II 16 23 41 (I. Shaw and J. Jacob, personal communication). Interestingly, Vallejo et al. 58 identified eight non–MHC-associated quantitative trait loci for MD resistance using a line 63 × 72 F2 cross.
In line N, a similar increase in MTLS occurred in the cytolytic phase as in lines 72 and 15I, a decrease occurred in the latent phase, and, similar to line 15I, a further increase occurred in the early tumor phase. Line N had low MLSs for nerve, heart, skin, and gonad. The proventriculus in the latent phase and the liver in the cytolytic and latent phases contributed most to the MTLS. Both organs act as secondary lymphoid tissues in the chicken. 18 Lymphoid infiltration in these organs in the cytolytic phase may indicate an immune response to productive MDV antigens. This is consistent with Calnek's 9 suggestion that an immune response in the cytolytic phase in resistant chickens minimizes the amount of MDV available to latently infect and subsequently to neoplastically transform T-cells. Further, because liver and proventriculus had greater MLSs in line N than 61, the immune response in the cytolytic phase may be greater in the former. The increased MTLS during the early tumor phase in line N may be either hyperplastic (possibly antigen-specific) lymphoblasts or latently infected and neoplastically transformed lymphocytes that escaped the immune response during the cytolytic phase. CD8+ cells were the most common phenotype in lymphoid infiltrations of both lines N and 61, at this time suggesting that the former is more likely.
One of the major problems in MD is the definition and objective comparison of the relative virulence of MDV isolates. To date only one objective method has been described. 61 Classical MD 28 affects peripheral nerves; however, more virulent MDV pathotypes have emerged 61 that cause lymphomas in both nerves and other nonlymphoid organs (acute MD 4 8 ). HPRS-16 is a well-characterized virulent pathotype causing acute MD in susceptible chickens yet the bias of lymphoid infiltration into nerves in line 15I typifies classical MD.
In contrast to the central nervous system, the peripheral nervous system (PNS) is not considered immunologically privileged per se. 22 55 However, the PNS does have low MHC class I expression 3 19 29 34 44 and is a site where pathogens are able to evade immune surveillance despite antigen production. 44 It is logical that the PNS, a poorly regenerative oligo-cellular organ, be protected from immunopathology. This may be one reason why lymphomas are restricted to nerves in classical MD (i.e., they can develop in an environment of relatively low immune responsiveness). Notably, the nerve was the only organ in which we observed a significant increase in MLS in the tumor phase in all genotypes of chickens examined. Witter 61 described an increase in the relative frequency of visceral and ocular lymphomas as the relative virulence of MDV isolates increased. Together with our data this suggests that a comprehensive study of lymphoma distribution by organ could aid in ranking the genotypes of chickens for MD susceptibility and could improve MDV pathotyping. Our work also reemphasizes the importance of standardizing host genetic background when pathotyping MDV isolates.
A major question in MD is whether or not neoplastically transformed cells occur in all chicken genotypes. The proposal has been made that the antigen recognized by the AV37 MAb is expressed by MDV-transformed cells in vivo and MDV-transformed cell-line cells but is not a lymphoid activation antigen. 47 After MDV infection, AV37+ CD4+ cells surrounded by AV37− CD4+ cells were present in lines 72 and 15I (from 5 DPI) and in lines 61 and N (from 7 DPI). If the antigen recognized by the AV37 MAb is confirmed to be a marker of neoplastic transformation, our work suggests that neoplastic transformation and consequent migration of these cells into nonlymphoid organs may occur in all genotypes from the cytolytic phase, regardless of MD susceptibility. The delay in the appearance of AV37+ cells in the resistant genotypes (particularly in line N) may be because fewer cells became latently infected and then neoplastically transformed because of efficient early immune-mediated clearance of MDV.
Another issue to address is whether MD resistance (or removal of tissue-infiltrating neoplastically transformed cells) in the tumor phase is immune mediated. This is controversial. 50 Payne et al. 39 first proposed that immune responses to productive MDV antigens in the cytolytic phase are followed by antilymphoma responses to either MDV latent proteins or tumor antigens. Differences in the phenotypes of cells present in MD lesions give some indication. In all genotypes we studied, CD4+ cells were the most frequent phenotype found in tissue lesions during the cytolytic phase. These cells remained the most frequent phenotype in lines 72 and 15I. In contrast, in lines 61 and N, CD8+ cells increased in frequency and became the most frequent phenotype from the latent phase onwards. In those lesions with relatively large proportions of CD8+ cells (even in line 72 chickens), AV37 immunostaining was low. The CD8+ cells may control expression of the AV37 antigen or may destroy cells that express it at high levels. The MAb CT8 recognizes chicken CD8α-chain so these CD8+ cells could be classical CTLs, natural killer cells, or TCRγδ T cells. The AV37+ cells present in line 61 and line N lesions had apoptotic nuclei, indicating programmed cell death. This could have been in response to a death signal from a cytotoxic cell or could have been self-induced. The identity of the antigens that are targeted remains unknown; potentially they could be of viral or host origin. Further work must establish whether expression of the antigen recognized by the MAb AV37 indicates neoplastic transformation.
Although few MDV antigens have been described in latently infected or neoplastically transformed cells in MD, 46 those that are present could be immunogenic. Indeed, low levels of CTL activity have been demonstrated against them. 35 36 Also, antibodies against putative self-antigens expressed on MD lymphoma cells (possibly recognizing, among others, the diverse and poorly characterized Marek's- associated tumor surface antigens 14 17 25 26 30 31 33 45 52 56 57 63 ) have been eluted from MD lymphomas. 43 Thus, immune responses to non-MDV antigens are feasible even if ineffective in some genotypes.
The following model of MDV infection is proposed for the four genotypes of chickens. In all an immune response exists against productive MDV antigens in the cytolytic phase, controlling the number of latently infected or neoplastically transformed lymphocytes with the following ranking: line N > 61 > 15I > 72. An immune response to neoplastically transformed cells (recognizing MDV latent antigens or host-encoded tumor antigens) exists in all genotypes. Immunity against neoplastically transformed cells is relatively more important in line 61 than in line N because of the relatively greater load of such cells in the former. Also, an immune response exists against neoplastically transformed cells in lines 15I and 72. In the former, it allows some individual chickens to survive. In line 72 all chickens develop MD but immunity is effective in only a few individual lesions.
The bias toward CD8α+ cells in lesions was associated with MD resistance and is circumstantial evidence for immunity against developing lymphomas. However, all genotypes of chickens may be latently MDV-infected for life 62 and some difference (qualitative or quantitative) must exist in antigen expression between latently infected and neoplastically transformed (latently infected) cells, allowing the former to escape the immune response regardless of the particular genotype's MD resistance.
In summary, host genotype–dependent MD resistance occurs at the cytolytic, latent, and tumor phases of MD. Cellular infiltration into organs of all genotypes seems to consist of both reactive and putatively neoplastically transformed lymphocytes. MD lymphoma regression is a real phenomenon and MD is an accessible, natural, in vivo model for biological regression of herpesvirus-induced neoplasia. Finally, our present work provides a basis for the identification of host or MDV genes responsible for resistance to MD at different phases of the disease.
Footnotes
Acknowledgements
We would like to thank Dr. L. N. Payne for his advice during preparation of this manuscript.