
Abstract
Background
The Koshino (KI) and Caton-Deschamps (CDI) indices are used to measure patellar height in children, with the CDI showing excellent reliability in typically developing (TD) children. Reliability of such measures in children with cerebral palsy (CP) and spina bifida (SB) is unknown.
Methods
Lateral knee radiographs were reviewed retrospectively for children with TD (n = 49), CP (n = 48) and SB (n = 42). Five raters took measurements from radiographs twice, at least two weeks apart. Measurements included the CDI, Insall-Salvati Index (ISI) and KI. Systematic variability (bias) and random variability were examined using repeated measures ANOVA, 95% limits of agreement (LOA) and coefficients of variation (CV).
Results
Mean values of all three indices differed among raters (p < 0.0001). A significant difference was seen between the first and second measurements for CDI and KI indicating a learning effect. LOA ranges were large for the CDI (intra-rater: 0.37-0.95, inter-rater: 0.60-1.04) and ISI (intra-rater: 0.25-0.49, inter-rater: 0.51-0.57) for all patient groups. The KI showed a clinically acceptable range for TD participants (intra-rater: 0.14-0.16, inter-rater: 0.11-0.14) with larger ranges for CP (intra-rater: 0.26-0.33, inter-rater 0.0.2-0.35) and SB patients (intra-rater: 0.23-0.27, inter-rater: 0.19-0.25). CVs were lowest (best) for KI (3.8% to 7.4%) and highest (worst) for CDI (14.7% to 23.1%) for all three groups. Results were similar for patients with both open and closed physes.
Conclusions
The KI is the most reliable patellar height measure for paediatric patients with TD, CP and SB, with either open or closed physes. The KI is more complex and experience may be important for valid, reliable measurement.
Introduction
Patellar position may play a role in knee pain and gait abnormalities in children.1–5 There are a number of methods to measure patellar height on radiographs, the Insall-Salvati index (ISI) being the most widely used. Only two, the Koshino (KI) and Caton-Deschamps (CDI) indices, are applicable to paediatric patients. The CDI has shown excellent reliability in able-bodied adults and typically developing (TD) paediatric populations.6–8 Patients with cerebral palsy (CP) and spina bifida (SB) are predisposed to developing patella alta; thus, being able to accurately measure their patellar height is of great importance. 9 However, reliability of patellar height measures in patients with CP and SB has not been assessed. These patients often have patellar pole and tibial tuberosity abnormalities associated with long-standing crouch gait, 2 potentially confounding accurate patellar height measurements. The purpose of this study was to examine the reliability of the CDI, ISI and KI in children with CP and SB, as well as paediatric patients without disability.
Patients and methods
A medical record search was conducted to identify patients with CP and SB who had lateral knee radiographs taken between August 2004 and May 2014 at the authors’ institution. The 56 participants with CP and 46 participants with SB were identified. Radiology records were searched to identify TD patients who had lateral knee radiographs taken and read as normal by a radiology attending physician during June 2014. This search yielded 179 patients. With a goal of including approximately 50 participants per group, 50 participants each were randomly selected for the TD and CP groups. All 46 participants were included in the SB group. One participant in the TD group, two in the CP group and four in the SB group were subsequently excluded due to sub-optimal radiographs, leaving 49 participants in the TD group, 48 in the CP group and 42 in the SB group for analysis. (Fig. 1) For patients with bilateral knee radiographs available, the side with the best lateral view was used. Since existing radiographs were used, knee flexion angle was not standardised. Knee flexion averaged 52° ± 14° (22° to 95°).
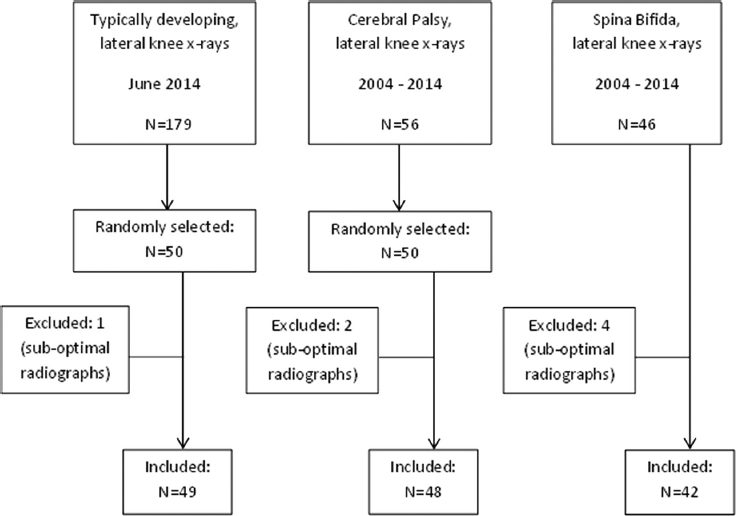
Participant enrolment flow chart.
Five raters took measurements from the radiographs. The raters included two orthopaedic surgeons (one with 17 years and the other with 11 years in practice), two medical students (third year) and one physical therapist (with 21 years of experience in paediatric gait analysis). One of the orthopaedic surgeons had prior experience with the ISI, but not with the CDI or KI. None of the other raters had prior experience with any of the indices. All raters were given the same instruction materials prior to beginning the study. The materials included images, descriptions and diagrams for each measure obtained from pertinent literature.7,8 The five raters took measurements on two separate occasions, at least two weeks apart. All measurements were made using the electronic measuring tools available in the Synapse software (Fujifilm Medical Systems, United States, Inc., 419 West Avenue, Stamford, CT, USA) and electronic markings were deleted after being recorded.
The radiographic measurements included:
Knee flexion angle. CDI: the ratio of the length of the articular surface of the patella to the distance between the distal end of the articular facet of the patella and the anterior corner of the superior tibial epiphysis (Fig. 2a). The recommended knee flexion angle is 10° to 80°. Normal range for the CDI is reported as 0.6 to 1.2.
10
ISI: the ratio of the length of the patella to the distance from the distal end of the patella to the insertion of the patellar tendon on the tibial tuberosity (Fig. 2b). The recommended knee flexion angle is 20° to 70°. Normal range for the ISI is reported as 0.8 to 1.2.
11
KI: the ratio between the distance from the midpoint of the patella to the midpoint of the superior tibial physis and the distance from the midpoint of the distal femoral physis to the midpoint of the proximal tibial physis (Fig. 2c). The recommended knee flexion angle is 30° to 90°. Normal range for the KI is reported as 0.9 to 1.3.
7
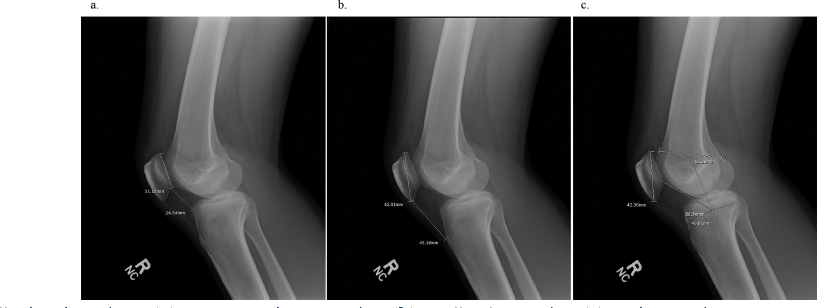
Patellar height indices: (
Analyses were conducted to evaluate two different types of variability: 1) systematic differences between raters or measurement sessions (bias); and 2) random variability. Systematic differences were examined using repeated measures ANOVA with factors rater, session, and the interaction between rater and session. When significant differences existed, secondary analysis was performed using pairwise comparisons with Bonferroni adjustment of significance levels. Data were analysed for all participants combined, as well as stratified by group, and by physeal status (open or closed).
Random variability was assessed in both absolute and relative terms using 95% limits of agreement (LOA) and coefficients of variation (CV). LOAs are expressed in the units of the measurement and indicate the range that is expected to capture 95% of repeated measurements on an individual. Since different measures may have different ranges of values, LOAs provide useful information in the unit of measurement but cannot always be compared between different measures. CVs, on the other hand, are expressed as a percentage of the mean value, allowing for comparison between measures with different typical values or different units. CVs are a relative measure in that they are affected by the magnitude of the mean value.
LOA ranges were calculated as LOArange = 1.96√(2*MSE), where MSE is the mean squared error from ANOVA. The 95% of repeated measurements are expected to fall within ±LOArange of the mean value. The LOA range is interpreted with respect to what would be considered a clinically acceptable difference between repeated measurements of the same entity 12 with a smaller LOA range indicating better reliability. For intra-rater variability, the MSE was derived from a repeated measures ANOVA with subject as a random factor and rater as the repeated measure. For inter-rater variability, MSE derived from a repeated measures ANOVA with subject as a random factor and measurement session as the repeated measure. For overall variability, MSE was derived from an ANOVA with subject as the only factor.
CV is defined as 100 × Standard Deviation / Mean. To assess overall variability, CVs were calculated using the ten measurements for each participant (5 raters × 2 sessions). These were averaged to determine a mean CV and the range of CVs for each measure. To assess interrater variability, CVs were calculated for each participant for the second measurement session. The second session measurements were used to eliminate variability due to raters’ unfamiliarity with the measurements during the first session. A smaller CV value represents better reliability.
Results
Participants in the TD group were significantly younger (mean age 11.3 ± 2.8 years (6 to 17)) than the CP group (mean age 13.0 ± 4 years (6 to 20)) and SB group (mean age 12.6 ± 3.6 years (6 to 20)) (p < 0.0001). There was no significant difference between groups in the percentage of participants with open physes (82% TD, 73% CP, 74% SB, p = 0.54).
Systematic differences among raters and sessions
There was a significant difference between the first and second measurements for CDI and KI, as well as a significant interaction of rater and session. For the ISI, there was also a significant interaction between rater and session, but the session main effect was not significant. Rater 4 (p< 0.0001) had significantly lower CDI values for the second session. Rater 3 (p = 0.002) had significantly lower ISI measurements at the second session, while Rater 4 (p = 0.002) had higher ISI measurements at the second session. Raters 1 (p = 0.0002), 2 (p = 0.02) and 4 (p < 0.0001) had lower KI measurements at the second session (Fig. 3).
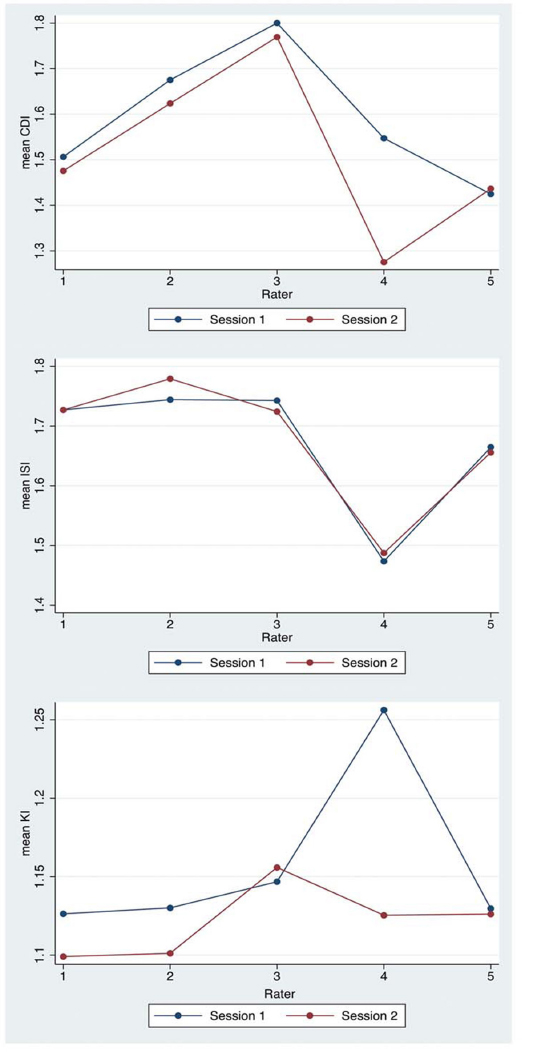
Comparison of measurements among raters for each session.
There was a significant difference in all three indices (CDI, ISI, KI) among the five raters at the second measurement session (p < 0.03). Rater three had higher CDI measurements than raters 1, 4 and 5 (p < 0.02) and Rater 2 had higher CDI measurements than raters 4 and 5 (p < 0.02). Rater 4 had lower CDI measurements than raters 1, 2 and 3 (p < 0.02) and lower ISI measurements than raters 1, 2 and 3 (p ≤ 0.005). Rater 3 tended to have higher KI measurements than raters 1 (p = 0.051) and 2 (p = 0.069), though these did not reach the level of statistical significance. Otherwise, there were no systematic differences in the KI among raters at the second measurement session (Fig. 3).
Random variability
LOA ranges of the three indices are shown in Table 1 for participants separated by diagnosis and by physeal status (open vs closed). The KI showed smaller ranges for intrarater and inter-rater variability for TD children and those with CP and SB, with both open and closed physes. The CDI and ISI showed large 95% LOA ranges relative to the published normative ranges10,11 for all patient groups, with smaller ranges seen for patients with closed physes than for those with open physes. Only the KI showed LOA ranges which were less than 50% of the normal range stated in the literature (0.4), 7 being lowest (best) for TD participants.
Limits of agreement (LOA) ranges for the three indices by diagnosis and physeal status.
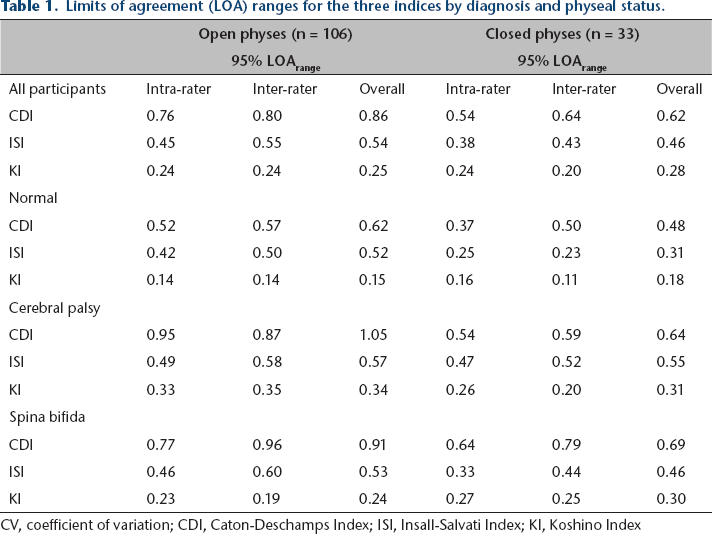
CV, coefficient of variation; CDI, Caton-Deschamps Index; ISI, Insall-Salvati Index; KI, Koshino Index
Overall, CVs were lowest for KI (indicating the best overall and inter-rater reliability) and highest for CDI (indicating the lowest reliability) (Table 2). CVs tended to be lower in the TD group than the CP and SB groups for the CDI and KI. The KI had the lowest CV for all three diagnosis groups.
Coefficients of variation for the three indices by diagnosis: mean CV (%) (range)
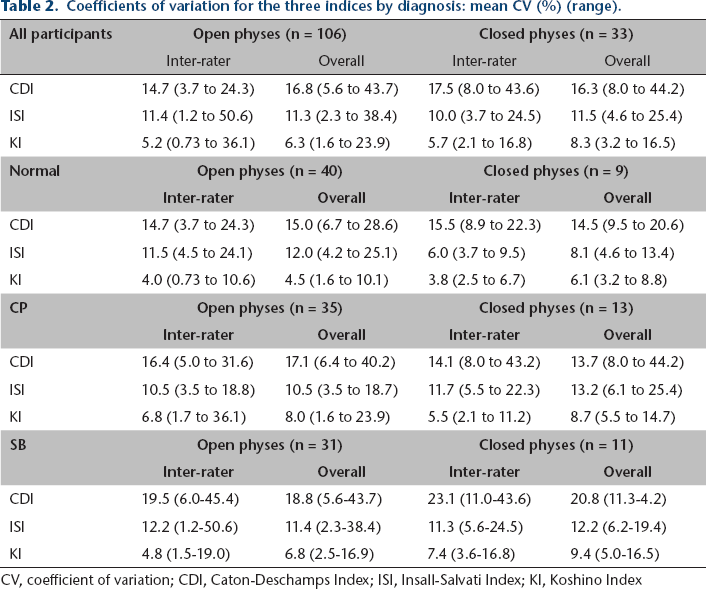
CV, coefficient of variation; CDI, Caton-Deschamps Index; ISI, Insall-Salvati Index; KI, Koshino Index
CVs for the component measurements of the three indices are shown in Table 3. The greatest inter-rater variability was seen for measurements of patellar facet length and facet to tibia length (CDI), and for patellar tendon length (ISI). Variability was the lowest for patella length (ISI), patella-tibia distance and femur-tibia distance (KI). These results were similar for all three diagnosis groups.
Coefficients of variation for component measurements of the three indices.
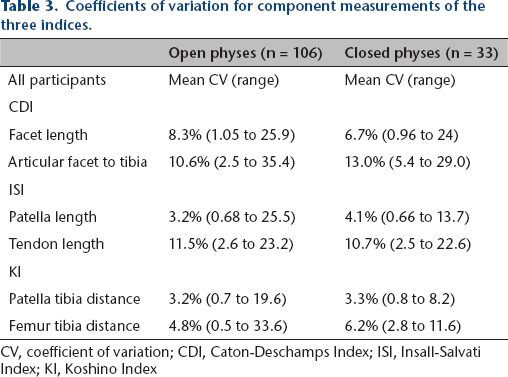
CV, coefficient of variation; CDI, Caton-Deschamps Index; ISI, Insall-Salvati Index; KI, Koshino Index
Discussion
A number of indices exist for measurement of patellar position. The ISI is widely used in adult patients, but can be inaccurate in the paediatric population due to its reliance on bony landmarks (patella and tibial tubercle) that are incompletely ossified in children. The KI was developed to avoid using these landmarks, making it ideal for paediatric use. Children with disabilities who walk in severe crouch often have elongated or fractured inferior patellar poles, as well as poor definition or elevation of the tibial tubercle, which may invalidate use of the KI and ISI in these cases. The CDI was developed to avoid these confounding factors 10 and has proven reliable in able-bodied adults and TD children.7,8 Reliability of patellar height indices has not been established for paediatric patients with disability. Such measures are important for patients with CP and SB in whom patella alta is thought to be related to anterior knee pain, or who may be considered for patellar tendon advancement surgery in conjunction with distal femoral extension osteotomy to correct crouch gait.13,14 For all three patient populations included in this study (TD, CP and SB), the KI was the most reliable method and the CDI was the least reliable method of measuring patellar position. This suggests that the KI should be the method of choice for determining patellar height for all paediatric patients, particularly those with atypical anatomy.
The 95% LOA range was high for the CDI and ISI. When considered relative to the range of normal values for each measure reported in the literature (0.6 for the CDI, 0.4 for the ISI and KI),7,10,11 at best the CDI showed variability of 0.37 (62% of the normal range) and the ISI 0.23 (58% of the normal range). At the worst, the CDI showed variability of 0.96 (160% of normal range) and the ISI of 0.60 (150% of normal range). Thus, many normal radiographs could be classified as having abnormal patellar position using these measures. The KI showed lower LOA ranges for both inter-rater and intra-rater reliability, with the best 95% LOA range being 0.11 (28% of the normal range). However, variability was as high as 0.27 (68% of the normal range) which could result in misclassification in some cases.
The sources of increased variability of the CDI and ISI measurements compared with the KI appear to be measurement of the length of the patellar articular facet, the distance from the articular facet to the tibia and the length of the patellar tendon (all had mean overall CVs of 7% to 13%). Anatomic abnormalities were seen in several participants, such as dysmorphic patellas and tibias (some with no distinct patellar articular surface and/or insertion of patellar tendon at the tibial tubercle), likely affecting measurement reliability in these patients (Fig. 4). While the components of the KI require more steps than the other measures tested, both had low mean CVs (3% to 6%) for all three patient groups. The components of the KI are less dependent on identification of specific bony landmarks that can be dysmorphic in patients with developmental disabilities. Patella length from the ISI was also quite reliable (CV of 3% to 4%) in the current study, though it was likely a source of variability in participants with patellar pole fragmentation (Fig. 4b).
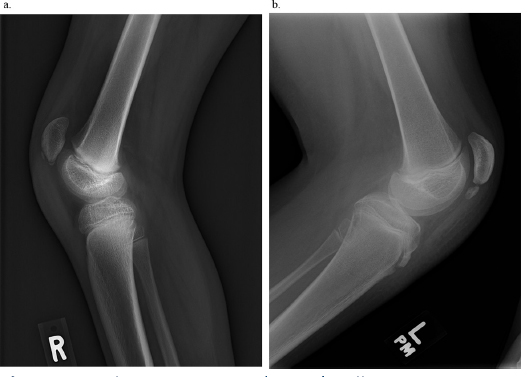
Sample participant radiographs illustrating anatomic variations complicating patellar height measurements. (
The data revealed a significant decrease in the CDI and KI from the first measurement to the second measurement for most raters in this study. This seems to represent a learning effect over the course of hundreds of measurements. None of the raters had prior experience with either index. Inter-rater reliability of the KI was improved at the second measurement, after learning had occurred.
Physeal status did not appear to affect reliability for the KI, which showed the most acceptable LOA ranges of all indices for patients with both open and closed physes. However, LOA ranges for the CDI and ISI tended to be either the same or slightly better in cases where the physes were closed. This suggests that the KI is the best index for use with younger patients, as well as those who are skeletally mature.
This study had a number of limitations. Only one rater had prior experience with patellar height measurement (using the ISI). Reliability may be better among clinicians experienced in using the CDI and KI. We did not perform comparisons between inexperienced and experienced raters since only one rater had prior experience, and this was with only one of the measures. Further study is merited to determine how experience affects measurement values and reproducibility for the three indices. While our data suggest that the KI should be used for reproducibility reasons, it is still unclear which measurement method most accurately diagnoses patellar alignment problems that are, or will become, clinically relevant. The correlation of radiographic diagnosis of patella alta or baja to clinical signs and symptoms was beyond the scope of this study, but we believe it merits further investigation. This would be best done through prospective longitudinal study with follow-up for the development of symptoms or pathology related to patellar mal-alignment. Because of the retrospective nature of the study, the amount of knee flexion present during radiography could not be controlled. However, the majority of radiographs were within the range of knee flexion specified for all three indices.
The KI is the most reliable measure of patellar height for paediatric patients with typical development as well as those with CP and SB. The main source of variability in the CDI and ISI measurements is use of obscure bony landmarks. The KI is a more complex measure than the CDI and ISI, and a learning effect was seen indicating that experience may be important to obtain valid, reliable measurement.
Footnotes
No benefits in any form have been received or will be received from a commercial party related directly or indirectly to the subject of this article.
No funding was received for this study.
All procedures performed in studies involving human participants were in accordance with the ethical standards of the institutional and/or national research committee and with the 1964 Helsinki Declaration and its later amendments or comparable ethical standards. For this type of study formal consent is not required.
RK owns stock in Zimmer-Biomet, Medtronic, Pfizer and Johnson and Johnson. All other authors declare that they have no conflict of interest.