
Abstract
Purpose
Dynamic pediobarograph measures foot–floor contact pressure during walking and provides a quantitative functional assessment. The goal of this study was to assess the reliability of pediobarograph measurements in normal children and in those with cerebral palsy (CP).
Materials and methods
During the first investigation, five non-disabled children and four with CP had three pediobarograph measurements taken of each foot, repeated five times. The pediobarographs were analysed by dividing the foot into five segments; the heel, the lateral midfoot, the medial midfoot, the lateral forefoot and the medial forefoot. A measure of valgus/varus foot posture was defined as the relative medial–lateral difference of combined mid- and forefoot impulse, named valgus/varus index. During the second investigation, 50 children (100 feet) with spastic diplegic CP were studied to calculate the standard error of measurements (SEM), to investigate the number of pediobarograph measurements necessary to obtain accurate results. The third investigation was an inter- and intraobserver study performed on one normal subject's repeated measurements.
Results
In the first investigation, the group with CP had a significantly increased variability in the medial midfoot (P = 0.013). The variability of the valgus/varus index had a standard deviation of 13%, demonstrating that this measure is relatively stable. The SEM and 95% confidence interval from the second experiment showed that, even if the accuracy increased with the number of measurements, the greatest gain seemed to be contributed by increasing the number of measurements from 3 to 6. The inter- and intraobserver study showed good to mostly excellent agreement.
Conclusion
Pediobarograph measurements can be used to monitor and quantitatively assess the progressive changes of foot deformity over time. Pediobarograph is a reliable measurement that shows little variability between measurements at the same occasion and between measurements on different days. Three to six measurements seems practical and adequate to obtain. The technical aspect of measuring shows good repeatability and agreement between observers.
Introduction
Foot deformities in children are common; however, the ability to classify and quantify the deformity remains difficult. Although radiographs can be obtained standing, they do not record the dynamics of foot function, and there is poor correlation between the static radiographic measurements and the dynamic appearance and symptoms. Dynamic pediobarograph, which measures the foot–floor contact pressure during walking, provides a quantitative functional assessment. An objective dynamic assessment of the foot while walking is obtained and the degree of deformity can be quantified [1–5]. There have been studies reporting use of the pediobarograph in the evaluation of different foot deformities in adults with rheumatoid arthritis, diabetes mellitus and forefoot problems [6–11].
In children, pediobarographic measurements have been used to evaluate treatment of clubfeet, cavovarus foot deformity in Charcot-Marie-Tooth and foot deformities associated with cerebral palsy (CP) [12–15]. Previous studies have evaluated different methods of assessing measurements of foot pressure, and the reliability of these methods [16–20]. There have been no studies reporting results from repeated measurements and the reliability of the pediobarograph in children with CP. The goal of this study was to report the reliability of pediobarograph measurements in both normal children and those with CP, and observe the variability within individuals. The intra- and interobserver error due to the technical processing of pediobarographs will also be defined.
Materials and methods
Institutional Review Board approval was obtained from the Hospital's ethics committee prior to initiation of the study. We carried out three different investigations to assess reliability of pediobarograph measurements:
The first assessed the variability of pediobarographs within individuals with and without CP. The second, which included another group of patients with CP, was performed to determine how the increased number of measurements obtained influenced the accuracy. The third assessed the reliability of the measurement technique; repeated data from one non-disabled child were used.
Technical procedure
To collect and analyse the data for the pediobarograph, a Tekscan High-Resolution Pressure Assessment System (Tekscan Inc., South Boston, MA, USA) was used. The measurement method started with obtaining a visual record by making a video using a hand-held video camera with the child walking barefoot on a standard walkway. A physical measurement was then made of the foot length and width. The child was next instructed to walk at a self-selected speed on a pressure-sensitive floor mat (61 × 65 cm). No assistive devices were used. The foot pediobarograph was then rotated to a zero foot progression angle, recording the degree of rotation required. A rectangular mask with a length and width equal to the measured length and width of the child's foot was placed over the pediobarograph. The footprint was placed in the mask so that it corresponded with the visual appearance of the foot. This means that if the child was a high toe walker with most weight appearing to be on the medial side of the foot, the footprint would be positioned on the anterior medial aspect of the mask.
The pediobarographs were analysed by dividing the foot into five segments, starting with the heel segment (posterior third), the midfoot (middle third) and forefoot (anterior third). The midfoot and forefoot were divided into symmetrical medial and lateral segments yielding medial midfoot (MMF), medial forefoot (MFF), lateral midfoot (LMF) and lateral forefoot (LFF). The pressure/time integral was normalised with body weight and foot size, and the impulse, total pressure during one step, of each segment was calculated. By adding the two medial segments of the foot and subtracting the two lateral segments, the result was divided into the whole forefoot and midfoot impulse to create an index. This index defines a measure of valgus/varus foot posture, defined as the relative medial–lateral difference of combined mid- and forefoot impulse (MMF + MFF) − (LMF + LFF)/(MMF + MFF + LFF + LMF) [1] (Fig. 1).
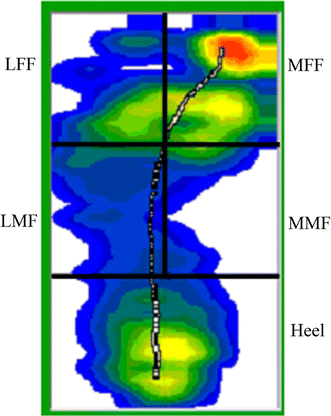
Pediobarograph, the five segments of the foot. MMF medial midfoot, MFF medial forefoot, LMF lateral midfoot, and LFF lateral forefoot
The first investigation included five non-disabled children [average age of 9.4 (6, 8, 11, 14 and 9) years] and four with CP [average age of 9.0 (5, 11, 8 and 13) years]. One additional child with CP was excluded since all the measurements could not be completed within the same time frame as for the rest of the study group. Each of the nine volunteers in this prospective study had a total of five visits, within a time period of 65 days, with a minimum of 1 day between visits. Three pressure readings from each foot were obtained at each visit. This means that each child had 15 measurement of the right and 15 measurements of the left foot. The non-disabled children were screened for a history of disease or previous injury that could alter the child's walking or foot configuration. In the disabled group, all were independent community ambulators. Subject 1 had a spastic–hemiplegic pattern CP and used no orthotics or assistive devices. When walking, subject 1 led with the right hip, having increased lumbar lordosis, decreased left arm swing and a bilateral, swing phase, heel-whip. Subject 2 had a spastic–diplegic pattern CP and walked with a severe crouch gait and flexed-knee position. This subject used a posterior Kaye walker or Lofstrand forearm crutches for all community ambulation. Subject 3 had a spastic–diplegic pattern CP and walked with a flat foot-strike, mild right toe drag, and planovalgus foot deformity. This subject used bilateral articulated ankle–foot orthoses with posterior stop straps but no other assistive devices. Subject four had a spastic–diplegic pattern CP and used no orthotics or assistive devices for ambulation. Subject 4 also had a stiff-legged gait on the right side and bilateral internal femoral rotation.
The second investigation was undertaken to assess the increased gain in accuracy with increased number of measurements from the pediobarograph. In this second investigation, we retrieved data from our records, in the Gait Laboratory database, of 50 children with spastic diplegic CP. Pediobarograph measurements had previously been performed on this group and, as is the routine, three measurements had been obtained from each foot. Thus, 100 feet with each foot's three measurements were used to calculate the standard error of measurements and 95% confidence interval of the z scores.
The third investigation, the inter- and intraobserver study, was performed to assess the reliability of the measurement technique and its repeatability. Data from one unrelated non-disabled child, 9 years of age, was used. The data consisted of 12 pediobarograph measurements from each foot each day on three consecutive days. Two experienced engineers from the gait laboratory with at least 10 years of experience performed the calculations for the inter- and intraobserver study. Independently from each other, the two engineers/observers calculated the data on all pediobarographs by dividing the foot into the five segments (see next paragraph below for more precise description). This was repeated after 2 days. Thus, each observer calculated the data from 12 measurements from three different days for the right and left foot twice.
Statistical analysis
The measurements were analysed statistically using SPSS 12.0 (Chicago, IL). Based on our Gait Laboratory's database of 54 normal subjects (108 feet; of children and young adults), a normal mean (M) and standard deviation (SD) were used to normalise the test subjects. The Z-score (Z) is calculated by subtracting the mean of the subject from the mean of the normal and dividing the sum with the normal standard deviation (Z = mean x − mean normal/SD normal). Calculating the mean Z score from the three tests within the same day, and also calculating the standard deviation, the variability within the same day could be assessed. Levene's test for equality of variance was calculated to compare the variability between the two groups for each foot segment, and for the variability between the groups regarding valgus/varus index.
The 95% confidence interval was calculated for three foot pressures obtained. The standard error of measurement (SEM) for the three obtained measurements were then used to derive 95% confidence intervals for 6, 9 and 12 measurements. The formula used was SEM = variance/square root of T (T = number of measurements) and confidence limit = X ± (1.96) SEM.
The data were on the interval level of measurement; therefore, inter- and intraobserver reliability was assessed using intra-class correlation coefficients (ICCs). The ICCs were computed for complete agreement using a two-way random-effects model specified by McGraw [21]. According to Fleiss, interpretive ranges for ICCs are as follows: r < 0.40, poor; r 0.40–0.75, good; r > 0.75, excellent [22].
Results
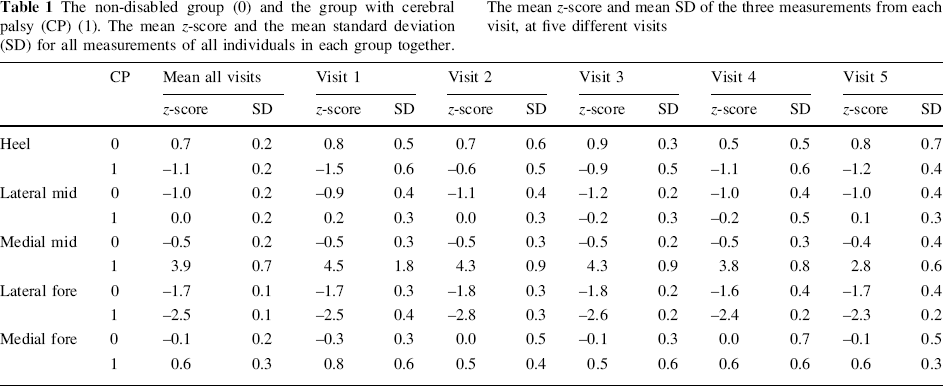
The result from the first investigation with the z scores are shown in Table 1. When comparing the variability of the non-disabled group with that of the group with CP using the Levene's test for equality of variance, there was significantly more variability in the medial midfoot, MMF (p = 0.013). There was no difference in the other foot segments. Also, Levene's test for equality of variance for the valgus/varus index showed no difference between two groups.
The non-disabled group (0) and the group with cerebral palsy (CP) (1). The mean z-score and the mean standard deviation (SD) for all measurements of all individuals in each group together. The mean z-score and mean SD of the three measurements from each visit, at five different visits
The mean valgus/varus index in the non-disabled group was 2.9, and consisted of 2 feet in valgus and 8 feet in the normal. The mean index in the group with CP was 19.7, consisting of 4 feet in valgus, 3 normal and 1 in varus. The laboratory's normal are −30 to 12 ± 1 SD. An index above 12 is considered a valgus positioning and an index below −30 a varus positioning. The variability in the CP group was slightly higher (SD 30.6) than in the non-disabled group (SD 21.6) and there was no statistical difference between the groups.
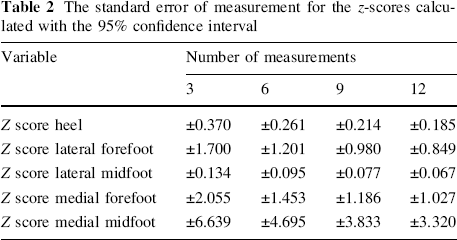
The second investigation with the calculation of increased accuracy with increased number of measurements revealed that the standard error of measurement reduced the error by around 50%, with the 95% confidence interval using 12 measurements instead of 3. A 30% error reduction can be obtained by collecting 6 measurements instead of 3 (Table 2).
The standard error of measurement for the z-scores calculated with the 95% confidence interval
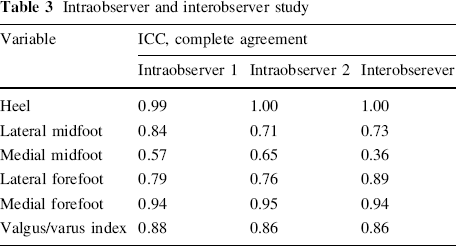
The third investigation, consisting of the inter- and intraobserver study, showed that intraobserver agreement for observer 1 was excellent in all the foot segments except the medial midfoot, where it was good. It was also excellent regarding the index. Observer 2's intraobserver agreement was excellent (including the index), except for the medial midfoot and the lateral midfoot, where it was good. Interobserver agreement was excellent, except for medial midfoot where it was poor and in the lateral midfoot where it was good (Table 3).
Intraobserver and interobserver study
Discussion
The goal of measuring the foot pressure is to quantify the degree of foot deformity and assess the foot dynamically. Foot pressure measurements have been used to define high-pressure areas at risk of ulceration in those with diabetes and other neuropathies [7, 9, 11]. Also pediobarograph measurements have been used to investigate feet affected by rheumatoid arthritis, hallux valgus, metatarsalgia and cavovarus deformities [8, 10, 15]. Evaluation of clubfoot treatment has also been performed in this way [14]. In the management of children with CP foot deformities, pediobarographic measurements have also been useful in assessing technical outcome after treatment for valgus deformity as well as other foot deformities [12, 13].
Our method of using the pediobarograph measurements by calculating an index simplifies the evaluation of the measurements in several aspects. It is a linear response from severe varus to severe valgus. The index not only contrasts the varus and valgus deformities with negative and positive numbers but also differentiates the severe deformity from the mild, by continuous numerical data that is correlated with the clinical assessment. This index is derived from the simple concept that the difference of walking impulse between the medial and lateral columns defines the functional difference of varus and valgus foot posture. Since the index is a normalised value without units, it is easily used to compare the differences before and after treatment over time within individuals. This measure is not impacted by growth in body weight or size of the foot.
Regardless of the advantages among different measurement techniques and ways of calculating and presenting the results, there is a need to assess and be aware of the reliability of the measurement obtained. Is the value encountered reliable? Would a repeated measurement give the same value? Obviously, it is important to know the mean and variation of the measurement in the normal population, and the variability of the measurement within the normal patient population and the pathologic population under study. It is important to also consider the variability between visits.
In the first investigation undertaken comparing the two groups of 5 non-disabled and 4 CP children, significant differences in the variability were found only in one of the five foot segments—the medial midfoot segment. This is not surprising, since the most common foot deformity in CP is pes planovalgus, with a collapsed midfoot and an increased pressure in the medial midfoot, corresponding to the displaced talar head with surrounding soft tissue. Since this is the most sensitive segment to measure and usually has the lowest impulse, there is also significant increased variation. However, by assessing the whole medial column to measure varus and valgus posture, this variability is no longer significant because the medial forefoot usually has much higher magnitude of impulse and is less variable. The heel segment might be expected to also have greater variability, since abnormalities as a consequence of heel cord tightness, spasticity, and variable toe walking are common. The heel segment showed no difference in variability, which suggests that our small patient population had a foot position consistent with that of the normal population. Children with CP in a large population do have diversity in gait, functional ability and foot configuration/stability, making it difficult to draw specific conclusions of gait variability from only a group of four patients. If the CP group had contained severely involved children only, or just very mildly involved, this variability might be different.
In the second investigation, which assessed the standard error of measurement in 50 CP patients, a benefit of obtaining more than three measurements on each visit was suggested. A substantial increase of accuracy was found if six measurements were obtained, and a full 50% reduction of the standard error measurement was calculated when 12 measurements were made. The ideal number of measurements in a clinical setting based on this assessment is difficult to define. It seems unpractical to obtain too many measurements. However, taking three measurements seems minimal, and up to six measurements of each foot gives a more accurate evaluation. There are different systems available with different sized sensing areas, and there is a possibility to use several sensing areas at the same time. It is difficult to give strong recommendations for the number of measurements since it depends on how the footprints are collected and therefore the local set up at the laboratories determines the practical use to a wide extent, including the number of measurements.
The third investigation, the study of intra- and interobserver agreement, showed good to predominantly excellent results, which suggests that the process of dividing the foot into the five segments of the pediobarograph, had a very minimal contribution to the variability of the measurement.
Conclusion
Pediobarograph measurements can be used to monitor and quantitatively assess the progressive changes of foot deformity over time. Pediobarograph is a reliable measurement that shows little variability between measurements on the same occasion and between measurements on different days. Three to six measurements seems practical and adequate to obtain. The technical aspect of measuring shows good repeatability and agreement between observers.
Footnotes
Conflict of interest
The authors received no grants or outside funding in support of their research or preparation of this manuscript. They did not receive payments or other benefits or a commitment or agreement to provide such benefits from a commercial entity. No commercial entity paid or directed, or agreed to pay or direct, any benefits to any research fund, foundation, educational institution, or other charitable or nonprofit organisation with which the authors are affiliated or associated.