
Abstract
Objective measurements of physiological parameters controlled by the autonomic nervous system such as blood pressure, heart rate and respiration are easily obtained nowadays during anaesthesia by the use of monitors: oscillometers, pulseoximeters, electrocardiograms and capnographs are available for laboratory animals. However, the effect-site of hypnotic drugs that cause general anaesthesia is the central nervous system (the brain). In the present, the adjustment of hypnotic drugs in veterinary anaesthesia is performed according to subjective evaluation of clinical signs which are not direct reflexes of anaesthetic effects on the brain, making depth of anaesthesia (DoA) assessment a complicated task. The difficulties in assessing the real anaesthetic state of a laboratory animal may not only result in welfare-threatening situations, such as awareness and pain sensation during surgery, but also in a lack of standardization of experimental conditions, as it is not easy to keep all animals from an experiment in the same DoA without a measure of anaesthetic effect. A direct measure of this dose–effect relationship, although highly necessary, is still missing in the veterinary market. Meanwhile, research has been intense in this subject and methods based on the brain electrical activity (electroencephalogram) have been explored in laboratory animal species. The objective of this review is to explain the achievements made in this topic and clarify how far we are from an objective measure of DoA for animals.
The existence of an objective measure of depth of anaesthesia (DoA) for laboratory animals is imperative in order to provide accurate titration of anaesthetic drugs and avoid waking during surgery or overdosage, contributing to the refinement of experiments. Objective measures also diminish the workload and the quantity of anaesthetics administered, allow better outcomes and enable the development of automated systems for anaesthesia delivery. Furthermore, in laboratory animal anaesthesia a precise adjustment of the DoA is essential to keep all animals in an experiment under the same conditions to avoid bias in the results and allow a reduction in the number of animals required to achieve sufficient statistical power.
A direct measure of this dose–effect relationship is still missing in veterinary anaesthesia, but research has begun to be carried out, particularly regarding the investigation of methods based on the spontaneous electrical activity of the brain (electroencephalogram [EEG]). The objective of this review is to discuss the achievements made in this topic and clarify how far we are from an objective measure of DoA for animals.
The development of veterinary anaesthesia
Over the past 50 years, great developments were made in animal anaesthesia, including a better control of respiration, haemodynamics and the introduction of new anaesthetic drugs such as volatile agents and short-acting anaesthetic agents like propofol. Nevertheless, animal anaesthesia still carries a much higher risk than human anaesthesia, with fatalities running at 2% in dogs and cats 1 compared with 0.01% in humans. 2
The pressure to improve the standards of care in animals is increasing, in order to meet the animal welfare regulations which defend the ‘three Rs – refinement, replacement and reduction’ and ensures that the best anaesthetic care is employed in animal facilities of research laboratories. 3
When an animal undergoes surgery, the administration of anaesthetic and analgesic drugs is required to render it unconscious and ensure that the pain an animal experiences is kept to a minimum during and after the procedure.
To ensure adequate DoA to prevent awareness without causing an overdose, a continuous examination of the patient's physiological parameters and the anaesthetic delivery systems is normally performed. Biomedical advances have allowed great improvements in anaesthesia monitoring standards for the cardiorespiratory systems, making it possible to monitor an animal's vital signs with the aid of monitors that most commonly provide pulseoximetry, capnography, blood pressure and temperature. However, DoA or ‘depth of hypnosis’ is still monitored manually and subjectively, by visual inspection of clinical signs such as somatic reflexes to noxious stimulation and eye globe movements. Research has suggested that because the main target effect-site of hypnotic agents is the central nervous system (CNS), the titration of hypnotic drugs should be based in the depression observed in its main effect-site organ – the brain.
What is depth of anaesthesia?
The concept of DoA is often associated with changes caused by anaesthetics in the level of consciousness of the patient. In humans, after induction of anaesthesia the patient fails to move in response to command and is considered unconscious. This behavioural definition of unconsciousness was introduced in anaesthesia over 160 years ago. 4 While in humans loss of consciousness after anaesthesia is detected by loss of verbal response, this is difficult to extrapolate to define DoA in animals, as they are unable to respond verbally. However, DoA classification in animals has always been associated with human definitions. 5 Movement responses to stimulation during anaesthesia are the most commonly used as signs of ‘consciousness’ or DoA both in humans and veterinary patients. Examples of these signs are the palpebral reflex, eye globe rotation, general muscle tone, or in laboratory animals, the righting reflex. Although commonly applied in practice, this approach has several limitations: first, when neuromuscular blocking agents are used, they induce complete muscle paralysis but do not remove consciousness; 4 the contrary may happen with the administration of dissociative agents which render the patient dissociated from reality but increase the muscle tone. Several medical conditions may lead to these situations which substantiates the idea that clinical unresponsiveness is not necessarily synonymous with unconsciousness. 4
In rats and rabbits loss of consciousness is assumed when animals lose their righting reflex, i.e. when the animal does not return to the ventral position when placed in dorsal recumbence. 6,7 From this point, DoA in animals is normally dependent on the observation of their motor and autonomic responses to noxious stimuli.
Depth of anaesthesia monitoring
Majority of the available methods for depth of anaesthesia monitoring that have been used or explored in animals
Three main groups are shown: subjective methods not based on the electroencephalogram (EEG), objective methods not based on the EEG and methods based on spontaneous EEG
Subjective evaluation of clinical signs
The first methods for DoA evaluation were based on clinical signs and autonomic responses evaluated on the patient through direct visualization or with the aid of specific monitors (e.g. stethoscope, electrocardiogram, blood pressure monitors, etc.). The first systematic method was the organization of clinical signs to ‘clinical scales’. The widely known Guedel's scale of anaesthesia classified anaesthesia in four stages based on changes of muscle tone, respiratory parameters and ocular signs. The use of clinical signs as the only method to assess DoA has been recognized as unreliable because it is mainly based on evaluation of autonomic reflexes and muscle activity, as such the responses are affected in different ways by different anaesthetics, 10 patient movement in response to surgical stimulation is merely a spinal cord reflex 11–13 and therefore may not be related to cortical effects of anaesthetics. 14 Furthermore, when neuromuscular blocking agents are used, skeletal muscle responses to surgical stimulation and respiratory frequency and depth are abolished and cannot be used to assess the adequacy of anaesthesia; also, when present, their evaluation is subjective and largely dependent on the experience of the anaesthetist. Finally, traditional clinical signs such as hypertension, tachycardia and lacrimation are unreliable indicators of DoA. 15,16 A wide range of situations such as administration of anticholinergic drugs, hypotension, dehydration, hypoxia, hypo- or hyperthermia may lead to haemodynamic changes, without changes in DoA.
Because most of these clinical responses are not reliable indicators of DoA, laboratory animal anaesthetists may have difficulties in adjusting the anaesthetic dosage to the animal's needs which may result in situations of insufficient or excessive DoA, the first putting the patient in risks of awareness and the second in risks of death or postoperative disease. In addition to the previously referred limitations of clinical signs, the introduction of newer anaesthetic drugs, such as newer volatile agents, intravenous anaesthetics, analgesics and neuromuscular blocking agents makes Guedel's classification obsolete. Furthermore, the use of ‘balanced anaesthesia’ (hypnosis, analgesia and muscle relaxation) makes it a more complex process.
Direct anaesthetic dose measurements
An objective method based on the drug concentration has been suggested as a measure of volatile agent potency, and also as an indicator of DoA: the minimum alveolar concentration (MAC). This concept was developed by Eger et al. 17 MAC represents the alveolar concentrations that would suppress the response to a specific noxious stimulus in 50% of the studied subjects. The measurement of MAC has three important components that give it consistency: a constant partial pressure of volatile anaesthetic at the site of action before the assessment of the response, the application of a specific noxious stimulus (skin incision in humans or tail clamping in animals); and the requirement to observe a defined clinical response – the purposeful movement.
Similarly, the constant plasma concentration (Cp50) has been suggested as a method to assess drug concentration versus DoA for intravenous anaesthetics. Like MAC for volatile anaesthetics, the Cp50 denotes the steady-state plasma concentration producing a 50% probability of an effect. The main problems related to both of these drug concentration-based techniques concerned the way in which MAC and Cp50 are calculated (response to a stimulus in only 50% of the subjects) which makes them not applicable to all individuals. Furthermore, high doses of volatile anaesthetics might not per se abolish awareness situations. 14
Measurement of end-tidal concentration of volatile anaesthetics or prediction of plasma concentration of intravenous anaesthetics in realtime may be a better method for assessing DoA, as it is an objective measure of the actual drug dose received by the patient. In animals, end-tidal concentration of volatiles is easily monitored after endotracheal intubation. Prediction of plasma concentration of injectable anaesthetics is a bigger challenge, as it is dependent on the development of pharmacokinetic models.
Spontaneous electroencephalogram
Because the EEG reflects the general degree of cortical electrical activity, it was thought to provide a clinically effective measure of the depth of cerebral depression following the administration of anaesthetic drugs.
EEG is thought to reflect the combined effect of synchronized electrical potentials, originated in the apical dendrites of cortical neurons. 18 It therefore represents a record of the oscillations of the electrical activity of large groups of neurons (essentially pyramidal cells) in the brain and most likely reflects postsynaptic potential activity rather than action potentials in the area underlying the EEG electrodes. 19
It was first described in 1875 by Richard Caton in the exposed cortical surface of rabbits and monkeys, 20 but it was only when Hans Berger discovered that chloroform and barbiturates induced changes in the human EEG that the investigations regarding DoA monitoring using the EEG began. 21 Intensive studies of the effects of general anaesthetics on the EEG began in the 1950s. 21
In general, anaesthetics produce a frequency shift of the EEG signal, from high to low frequencies and an increase of the EEG signal amplitude, creating an EEG signal with synchronous properties. But for higher doses/perfusion rates burst suppression (BS) may occur and the EEG amplitude decreases. 21 An example of the effects of isoflurane on the EEG of a rat is shown in Figure 1.
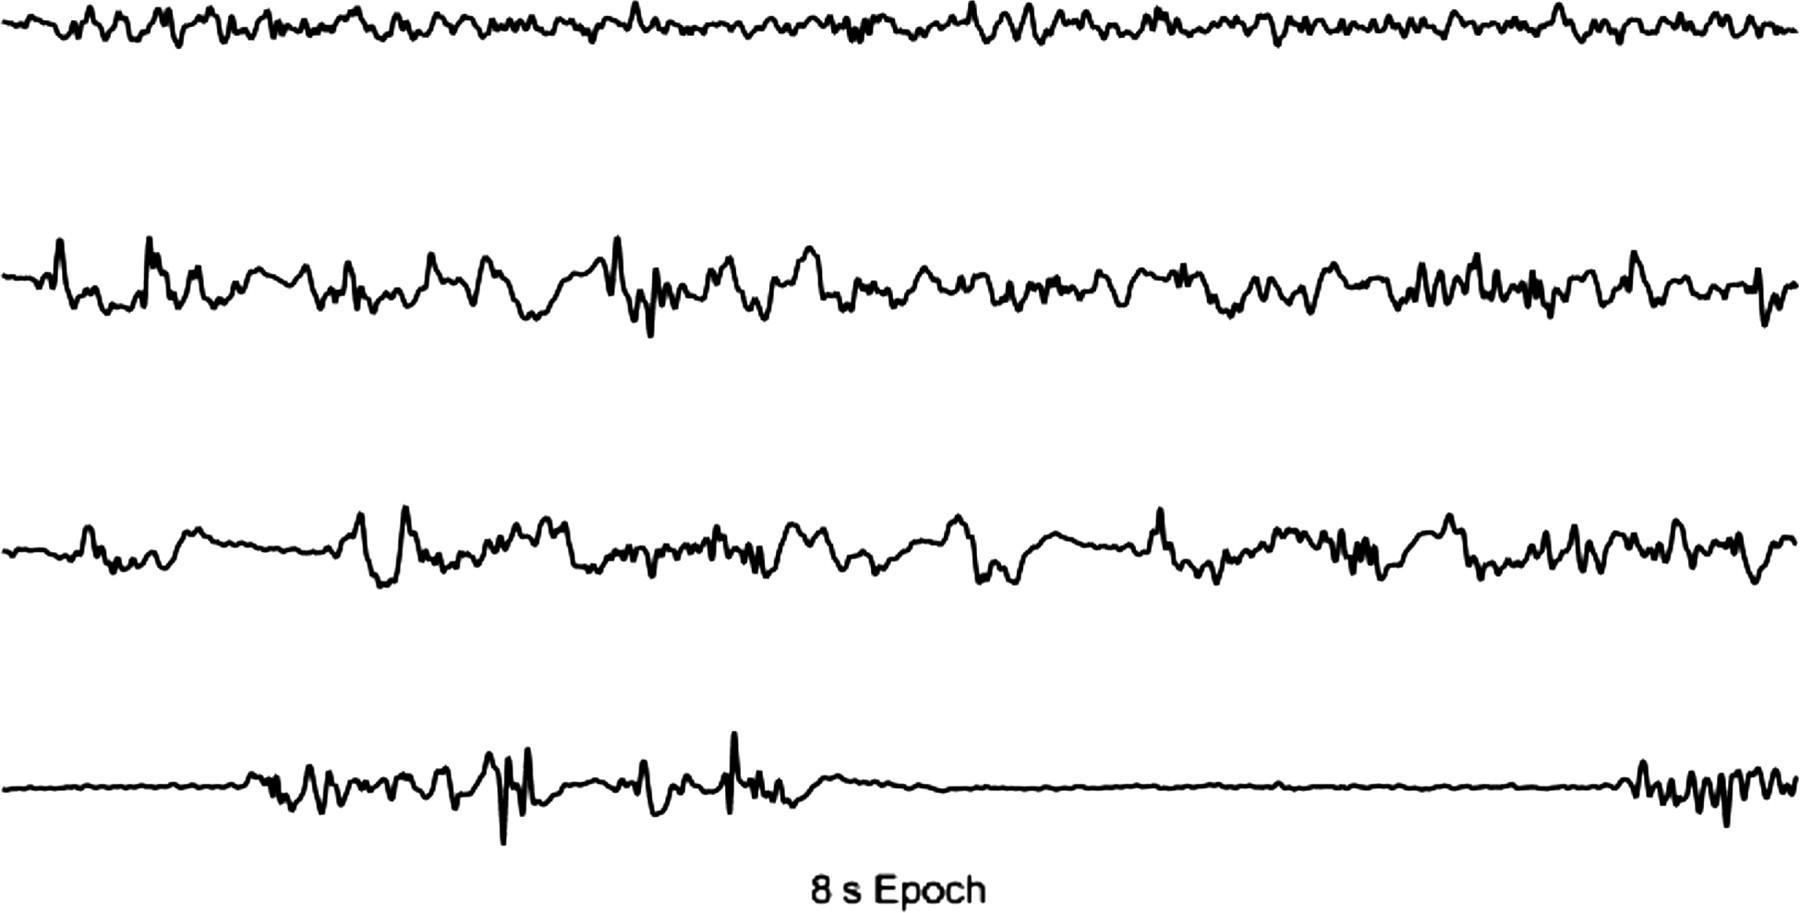
Effect of isoflurane on the brain electrical signal of a rat. The first trace represents the awake trace; the second shows the signal recorded in a rat under light isoflurane anaesthesia (higher amplitude and lower frequency waves); the third trace corresponds to a medium anaesthetic depth and the fourth corresponds to a deeply anaesthetized animal, with burst suppression pattern
Unprocessed EEG shows several limitations as a monitoring tool for anaesthesia, especially due to its sensitivity to electrical interferences from the operating theatre, such as diathermy devices, patient eye-blink and electromyographic artefacts. To overcome these problems, several processing techniques have been developed to provide quantitative parameters that reflect the information of the EEG in an easy to interpret manner. For animals, electronic indexes for DoA monitoring are not available, but there are several research studies exploring the potential application of indexes developed for humans in animal patients.
Non-commercial methods
Spectral analysis
Electroencephalogram boundary frequencies
Classical boundary frequencies of the electroencephalogram: delta, theta, alpha, beta and gamma 49
Although a common effect with all drugs acting via the GABAA (gamma aminobutyric acid A) receptor system is the slowing of EEG rhythms, different anaesthetics produce different characteristic changes which make the use of band powers difficult for DoA monitoring. Nevertheless, band powers provide important information and might be useful in the study of the physiological mechanisms of various drugs.
Another set of parameters derived from the spectral analysis of the EEG are the ‘spectral edge frequencies’. These are normally represented by the 95%, 90% or 50% percentiles of the power spectrum. The power spectrum results from the amplitude squared of the individual frequency components (μV2) in relation to a specific time interval.
Spectral edge frequency is usually denoted as SEF x , being the frequency below which x% of the power spectrum of the signal resides. 22
These spectral parameters have been widely studied in a large variety of species, as they are traditional tools for the interpretation of the EEG. 23–28 They show a similar response to deepening of anaesthesia as humans with decreasing values in lighter anaesthetic planes and paradoxical increases when BS patterns appear (described next). These parameters have a high sensitivity to external artefacts which is an important limitation to their practical use.
Burst suppression ratio
In unanaesthetized animals, BS represents an abnormal cortical activity, where 95% of the cortical cells are silent during suppression. 29 During anaesthesia it is a benign pattern frequently seen in a healthy brain at deep planes. It can be identified in the raw EEG as episodes of electrical quiescence (‘suppression’) alternated with high frequency, high-amplitude electrical activity (‘bursts’) (Figure 1 – 4th trace). Increasing anaesthetic drug concentration causes increased duration of the suppression periods. 23,30 BS patterns of the EEG are classically quantified using the BS ratio defined as the percentage duration of suppression/duration of the epoch, an accepted method of analysis since 1988. 31,32 The graphic representation of the method for BS quantification is shown in Figure 2.
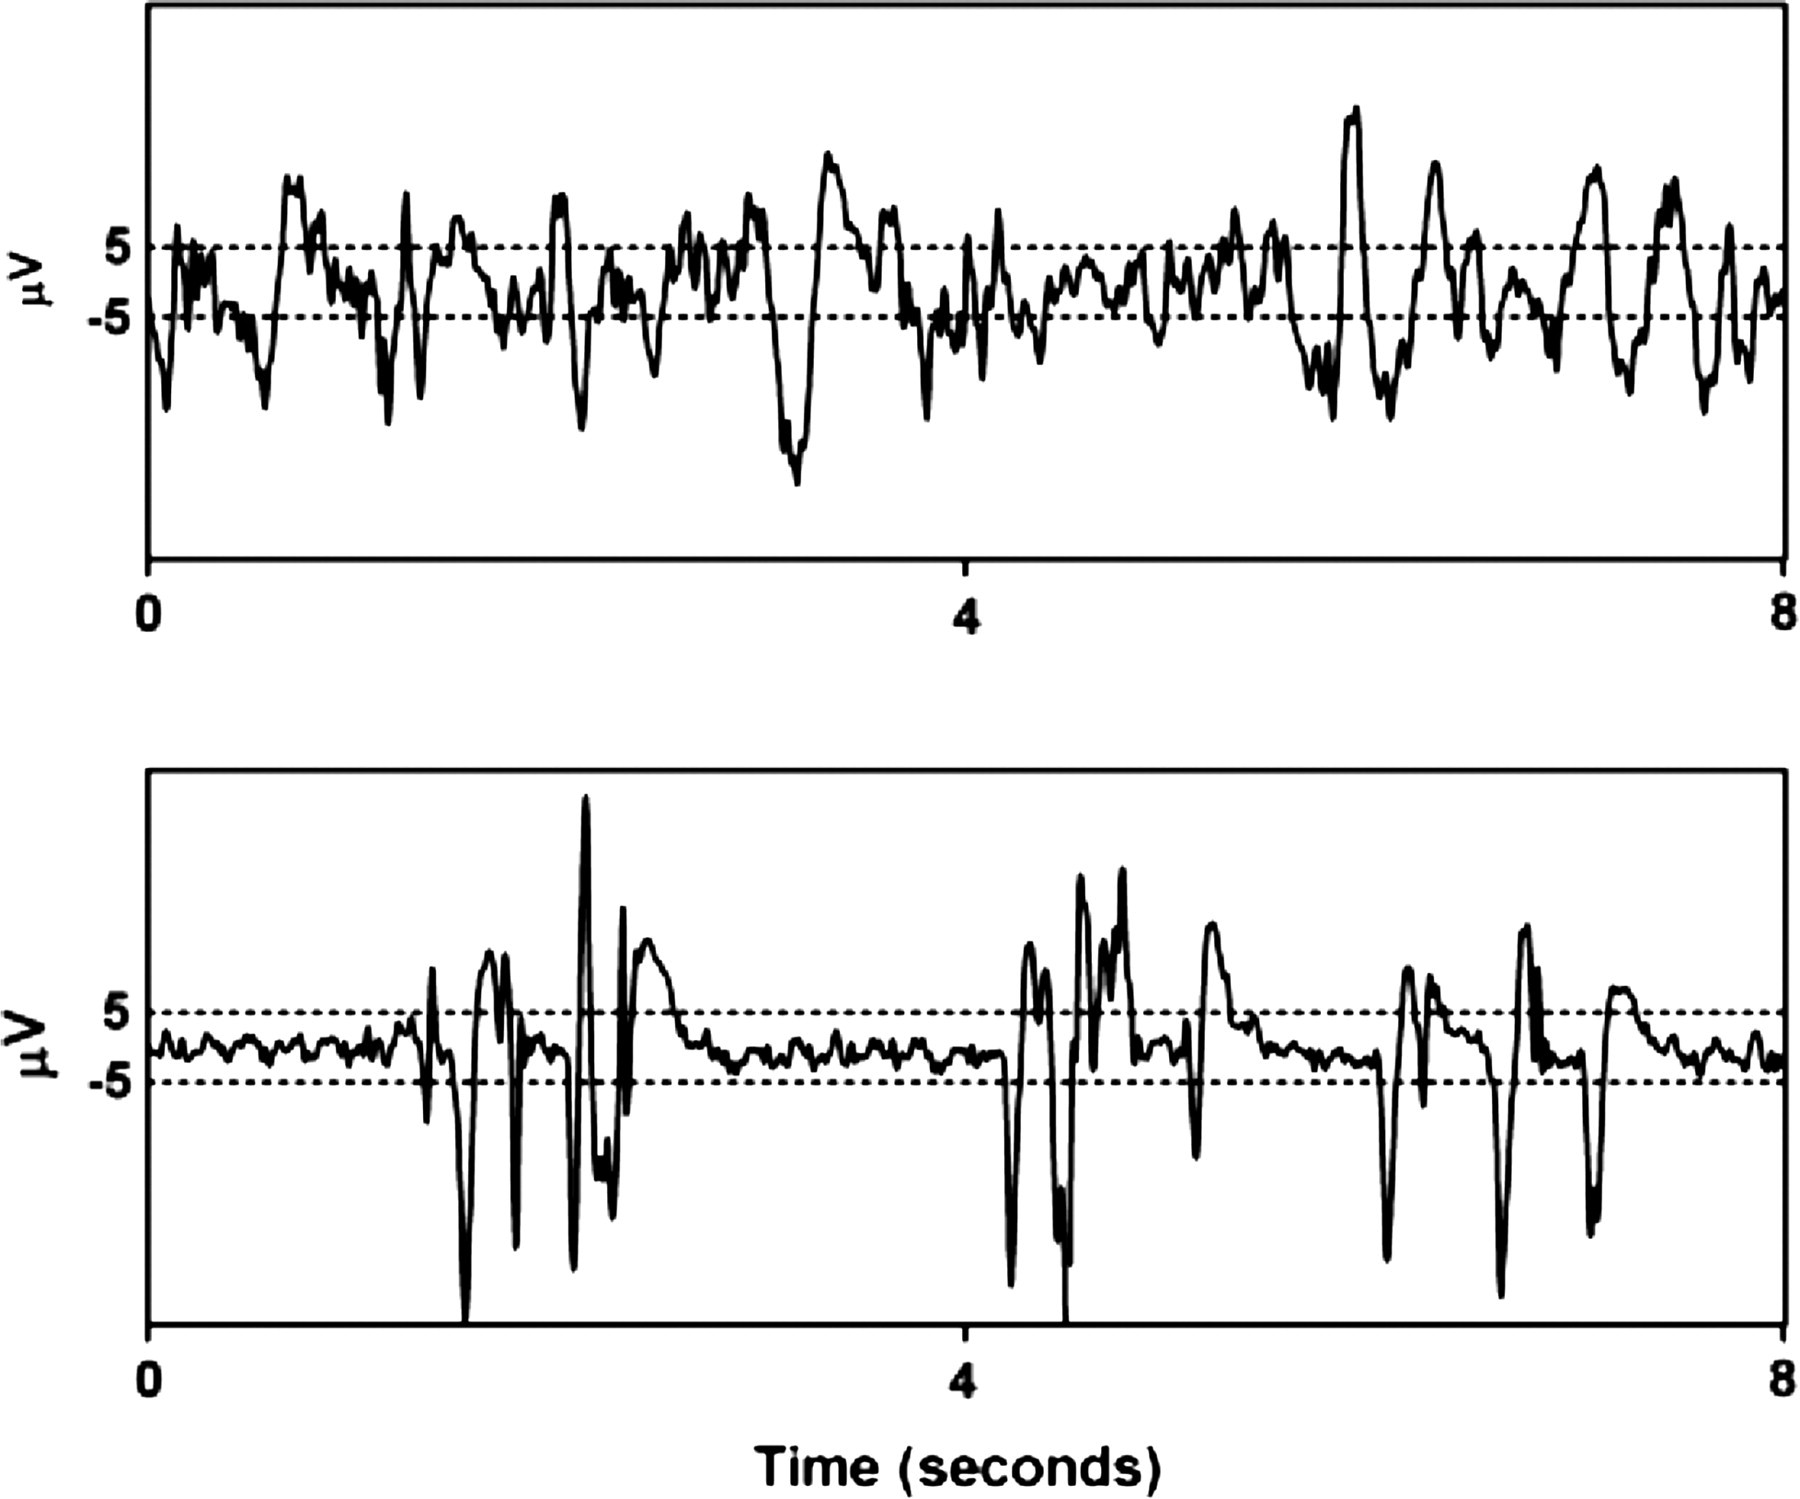
Method for burst suppression detection in an electroencephalogram epoch of 8 s suggested by Rampil. 31,32 The limit for detection is marked with dashed lines (±5 μV). The above electroencephalogram trace does not show a burst suppression pattern while in the trace below there are epochs of completely suppressed signal (between the two dashed lines). The burst suppression ratio is calculated as the sum of intervals of suppression found in the analysed epoch (with at least 0.5 s long duration), divided by the epoch length
In animals, the appearance of BS patterns on the EEG during general anaesthesia has been known for a long time. 32–34 The BS ratio has been used as a target parameter during closed-loop administration of anaesthetics in rats. 34 In rabbits, in a comparison between BS produced by isoflurane and proposal showed that bursts produced by propofol were less distinct from those of isoflurane, consisting of spikes on slow waves with a smoother wave form than the abrupt change in DC-level seen in isoflurane BS, without the appearance of the typical spindles seen in humans under propofol anaesthesia. 35 Different anaesthetics produce morphologically different BS patterns 36–38 which may be related to their different mechanisms of action. In healthy brains, BS is induced only by high concentrations of anaesthetics. 30,39,40 Although it is present during deep anaesthesia, this pattern is composed of low-frequency periods alternated with high-frequency periods of EEG which may cause a paradoxical increase in frequency-based parameters. 26 This should be interpreted cautiously as a high value of an EEG-derived parameter may lead the anaesthetist to increase the dose to prevent awareness while the patient is actually too deeply anaesthetized. 41
Because it is a sign of deep anaesthesia, interpretation of BS is an integral part of the majority of EEG-based DoA commercial monitors: bispectral index (BIS) (Covidien, Boulder, CO, USA), cerebral state index (CSI) (Danmeter, Odense, Denmark), patient state index (PSI) (Physiometrix Inc, North Billerica, MA, USA), narcotrend index (MonitorTechnik, Bad Bramstedt, Germany), spectral entropy (M-entropy module; GE Healthcare, Helsinki, Finland).
Entropy-based methods
The spectral parameters and the BS ratio are frequency- and time-domain analysis methods, respectively, which do not take into account the non-linear characteristics of the EEG. However, because the origin of the EEG, the brain, behaves as a non-linear system, it is reasonable to apply non-linear system analysis methods to extract information from the EEG, such as entropy-based concepts.
The concept of entropy, originally derived from thermodynamics, has been successfully applied to EEG analysis. Claude Shannon was the first to define entropy as a measure of information theory. 42 Applied to the EEG, Shannon entropy measures the predictability of future amplitude values based on the probability distribution of amplitude values already observed in the signal. It has been shown that Shannon entropy of the EEG amplitude values uniformly increases with increasing desflurane concentrations and it has been suggested as an EEG measure of DoA, 43 but because it is not normalized to the total power of the EEG it may vary among individuals, which is a limitation to its practical application. Other entropy-based concepts have enjoyed more success and have been tested in animal species: approximate entropy (AE) and permutation entropy (PE).
Approximate entropy
AE was introduced in 1991. 44 Similarly to Shannon entropy, it measures the predictability of future amplitude values of the EEG based on the knowledge of previous amplitude values, by comparing fragments of EEG inside an epoch. In practical terms, in a perfectly regular data series, knowledge of the previous value enables prediction of the subsequent value. For example, in the data series given by 0, 0, 1, 1, 0, 0, 1, 1,…, knowing that the two previous values were one and one allows for the prediction that the subsequent value will be zero. 45 Thus, with increasing irregularity, knowing past values will not allow reliable prediction of future values, and AE value increases. It has a theoretical minimum value of zero (maximum regularity of an isoelectric signal – brain silence) and a maximum value which can achieve around 1.7 (highly irregular signal – awake pattern). However, this scale depends on the epoch length used for the analysis. Several studies have shown that AE is a useful tool to quantify anaesthetic drug effect in human patients and is comparable to established commercial monitors and SEF. 46 Interestingly, it has been shown to be capable of detecting BS patterns. 47 Its major drawback is the sensitivity to artefacts and the fact that it requires long, stationary and noiseless EEG data. 48 AE has been recently reported to decrease with increasing concentrations of isoflurane, sevoflurane and desflurane in rats. 26 In a study performed with intracranial recordings in rats AE showed better performance than SEF and other entropy-based indexes, even when BS patterns were present. 49 However, in subsequent research in rabbits using extracranial recordings (EEG), AE showed worse performance 50,51 which may reflect its high sensitivity to external artefacts which are present in EEG recordings.
Permutation entropy
PE was first described by Bamdt and Pompe
52
as a method for ordinal pattern analysis of non-linear time series. It has been applied recently to the EEG during anaesthesia.
48,53,54
It has been shown to be highly resistant to artefacts and capable of detecting loss of consciousness in human patients under sevoflurane and propofol anaesthesia.
48,53,54
It separates the signal epoch in consecutive subvectors of constant length (motifs of length m) and orders the samples in every subvector according to their amplitude and defines permutations with the length of the motifs (m!). As an example, if m = 3, there can be 3! different permutations which is 3 × 2 × 1 = 6 permutations. The parameter value is given by the resultant normalized probability distribution of the obtained permutations, using the Shannon entropy formula. The PE formula can be represented by:
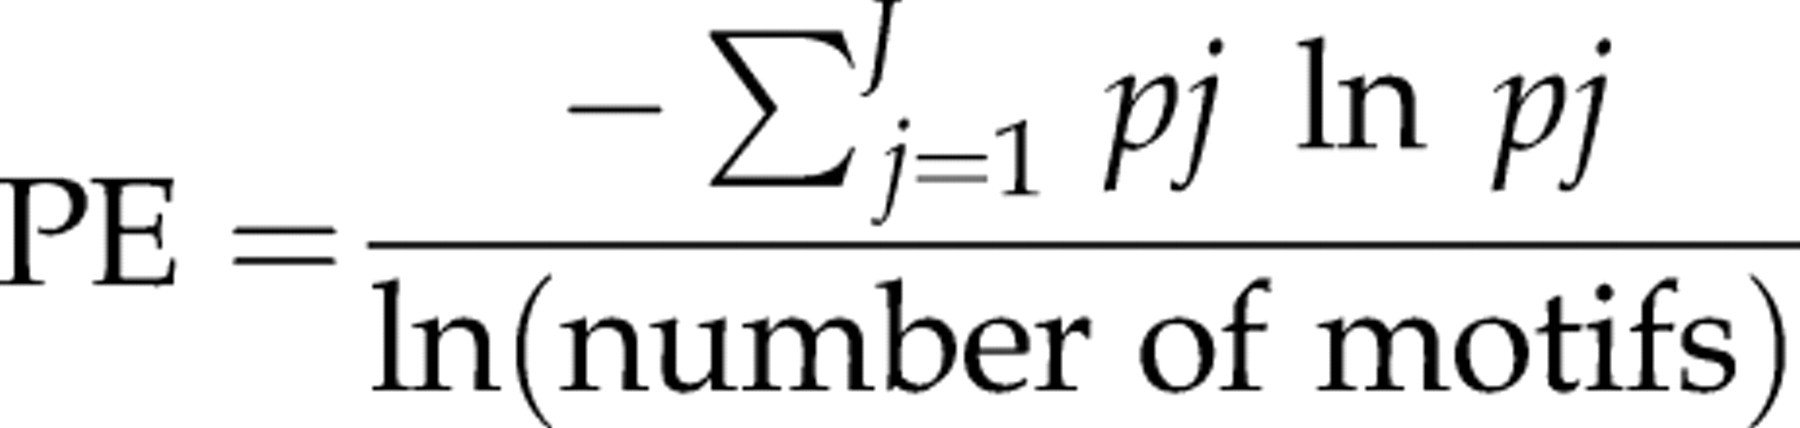
More details on its calculation can be found in the literature. 48,52–54 Recent studies in rats and rabbits showed the potential of this parameter to be used in these animal species, when a correction for BS patterns is incorporated in its calculation. 49–51 In these studies this parameter was shown to be more resilient to artefacts than SEF and AE, but it increased paradoxically with the appearance of BS which made the correction essential for its adequate use. Studies in other animal species are required to confirm this parameter's potential for animal anaesthesia application.
The use of non-commercial monitors for animal DoA monitoring such as spectral parameters and entropy-based measures has the advantage that the algorithms may be improved and adapted to different EEG characteristics and different drug effects, which is not possible with commercial monitors but because commercial monitors are very practical to use, several have already been tested in animal species and are described below.
Human anaesthesia commercial monitors
Bispectral index
BIS is a parameter derived from the EEG which is calculated based on a model with multiple components and optimized with a database of EEG recordings matched to observed DoA and drug dosages. It has gained strong popularity in human clinical practice and there are more than 900 peer-reviewed publications about it and PubMed search reveals around 60 publications of BIS in animals. It shows a number that varies between 0 (brain death/isoelectricity) and 99 (wakefulness). The derivation of this number (index) from the EEG involves a weighted sum of four variables derived from the time domain, spectral domain and bispectral domain. The time-domain variables are BS ratio and QUAZI suppression which is an index designed to detect BS in the presence of wandering baseline voltage and incorporates slow wave (<1 Hz) activity. In the frequency domain there is a variable called BetaRatio (qualifies the spectral power of the beta waves – 15–30 Hz) and in the bispectral domain the variable SynchFastSlow. The final result is a numerical index that varies between 0 (deep coma) and 99 (awake).
BIS has been criticized because the basis of the algorithm is not freely available and it is difficult to interpret the changes in terms of neurophysiological processes.
In humans it has been validated across several anaesthetics and sedatives including isoflurane, propofol and midazolam. 55 By contrast, N2O, ketamine, fentanyl and some levels of sevoflurane showed no correlation with BIS. The regular use of this monitor has been shown to result in lighter DoA, reflected in average higher BIS values, which has been argued as a contribution for a better anaesthesia technique. 56
With such a wide investigation of this monitor, there is an abundance of studies reporting not only successful uses but also limitations of the monitor. In a very polemic study, Avidan et al. 57 reported that the use of BIS was not associated with lower incidence of anaesthesia awareness or reduced administration of volatile anaesthetic gases. In this study, anaesthesia awareness occurred even when BIS values and the end-tidal concentration of anaesthetic were within the target ranges. 57 Other reports of limitations regarding BIS include the appearance of high BIS values in patients who were in a deep DoA. 58 Also, the reliability of the monitor may be affected by the electrode placement position. 59 The BIS monitor may be used as a monitor of sedation, but it does not measure analgesia well, which limits its use as a sole monitor in automated systems of anaesthesia. However, there are studies in which BIS is used as the target variable for closed-loop control of hypnotic drugs’ administration. 60,61
Regarding animals, the application of BIS during general anaesthesia has been investigated in a diversity of species including studies of BIS monitoring in horses, 62,63 pigs, 27,64–67 goats, 68 dogs, 69–75 cats, 76,77 rabbits, 67 dolphins, 78 alpacas 79 and chickens. 80
In dogs, an inverse relationship between BIS values and multiples of isoflurane 72 and sevoflurane 71 was found. In pigs, a correlation between isoflurane and BIS was found, although no correlation was found between a numerical clinical scale and the values of BIS. 65 In horses, huge interindividual variability was found regarding BIS values during isoflurane anaesthesia which led the authors to conclude that BIS was not a good indicator of level of consciousness for that species. 62 More recently, works performed on horses have reported an overall capacity to correlate with unconsciousness but not to predict intraoperative movement. 81 In another study in horses, BIS was shown to be a useful indicator of awakening but did not indicate the degree of CNS depression during propofol anaesthesia. 63 In cats, BIS values were inversely and linearly related to end-tidal isoflurane concentrations but were consistently low suggesting that clinical BIS endpoints used to titrate anaesthetic agents in humans may not be applicable to cats. 76
Most of the studies using BIS in animals try to find a correlation between its values and motor and autonomic responses to pain during anaesthesia which in general is not found. 62,82
In pigs, noxious stimulation caused significant increases in arterial pressure but not on BIS. 83 In a study performed on rabbits, BIS did not show significant changes at the moment of skin incision and was concluded as having limited usefulness as a predictor of important changes in haemodynamic variables during surgery. 28
These controversial results are probably related to the fact that patient movement in response to noxious stimulation is merely a spinal cord reflex 12,13,84 and therefore is not predictable from cortical EEG responses.
Apart from the limitations inherent to the clinical endpoints used in BIS studies, its application in animals is questionable since its algorithm is based on data collected in humans. March and Muir 82 reviewed the use of BIS in animal species and suggested that the interspecies differences in the EEG features associated with different hypnotic and amnesic states may affect the correlation between BIS values and DoA. This possibility is supported in a previous study, which suggests that clinical BIS endpoints used in humans may not be used in cats, for example, due to the fact that BIS in this species varied between 5 and 32 with 1.5–0.8 MAC isoflurane. 76
Cerebral state monitor
The cerebral state monitor (CSM) is a portable device that analyses the frequency shifts in the EEG signal as the level of consciousness changes and presents the CSI scale from 0 to 100. It also provides EEG suppression percentage and a measure of EMG activity, similarly to the BIS. It combines four subparameters extracted from the EEG using fuzzy-logic. The four parameters consist of the α-ratio, β-ratio, α–ratio, β-ratio and BS. 85 Similarly to the already described commercial indexes, the range of adequate anaesthesia is designed to be between 40 and 60. Anderson et al. 86 reported that CSI correlated well with BIS and showed similar patterns and numerical values in day-surgery anaesthesia without muscle relaxation, however, which monitor is the more dependable remains to be established. In another study, it has been further found that the CSI detects the graduated levels of propofol anaesthesia well when compared with the propofol effect-site concentration and the Observer's Assessment of Alertness and Sedation (OAAS) score, and it behaves as other DoA monitors with a progressive decrease during propofol induction, but loss of consciousness with N2O results in no change in CSI. There are some studies of the CSI in animals. In dogs sedated with medetomidine it was suggested as a promising method for monitoring the degree of sedation and hypnosis. 87 In later studies, during propofol anaesthesia, although it showed correlation with increasing doses of propofol, 88 no correlation was found with clinical signs of DoA during induction of anaesthesia. 89 In a study in pigs, good agreement was found between clinical signs of DoA and the CSI. 90
Spectral entropy
Spectral entropy is available in the form of a module for the Datex multiparametric monitor (General HeathCare, Helsinki, Finland). It applies the concept of Shannon entropy, which is a measure of information content, to the power spectrum of the EEG signal. When applied to the power spectrum of EEG, spectral entropy is obtained and measures the regularity of the frequency distribution. It derives response entropy (RE) and state entropy (SE). RE is calculated in the frequency range from 0 to 47 Hz and includes EEG and EMG activity. SE is calculated in the frequency range from 0 to 32 Hz and should mainly include EEG activity. The maximum value of the RE is 100, and the maximum value of the SE is 91. Numbers close to 100 mean that the patient is conscious, and numbers close to zero denote very deep anaesthesia. As for the other monitors, a clinically practical level of anaesthesia is achieved when the value is between 40 and 60. When the RE and SE values are identical (subtracted value 0–3), the level of anaesthesia can be considered adequate. A slow increase in the difference between the RE and SE values during anaesthesia is a sign of frontal muscle EMG activity, which in turn is a sign of ‘inadequate’ anaesthesia. Spectral entropy has been proven to reflect the level of consciousness just as reliably as BIS in some studies 91 but not in others. 92,93 This difference may be related to the high sensitivity to artefacts of spectral entropy which makes it very variable with different recording conditions in the different studies. In humans, the functionality of the monitor has been validated for propofol, thiopental, sevoflurane and desflurane anaesthesia. Spectral entropy was recently investigated in beagle dogs. 94 It was suggested that this parameter showed a potential for application in animal species because it is independent of the signal amplitude. Although it was capable of distinguishing awake and unconscious states, it was not capable of detecting deep planes of anaesthesia or to indicate antinociception in dogs. In sheep, spectral entropy was suggested to be a sensitive monitor of the consciousness–unconsciousness transition, rather than a progressive indicator of anaesthetic drug effect. 95
IoC-View monitor
The IoC-View monitor displays the index of consciousness (IoC). It is the most recently introduced monitor for DoA monitoring. It is commercialized by Aircraft Medical (Barcelona, Spain). Similarly to the BIS, the EEG is recorded with two electrodes placed on the patients’ forehead and a reference electrode placed on the cheek in a standard position. Its calculation is based on the symbolic dynamics method which transforms a time series into a symbol sequence that can reveal the non-linear characteristics of the EEG. It also integrates the β-ratio (frequency range between 11 and 42 Hz) during superficial anaesthesia and the amount of suppression of the EEG (equivalent to the traditional BS 22 ). Decreasing values of IoC correspond to gradual loss of consciousness and a deepening of the level of anaesthesia. In a unitless scale from 99 to 0, an index of 99 indicates an awake patient and an index of 0 indicates a flat EEG. Studies in animals revealed that the IoC has an acceptable performance during isoflurane anaesthesia, in rats 49 and rabbits. 51 In rabbits, during propofol anaesthesia, the IoC showed a lower capacity for detecting increasing DoAs. 50
Techniques used for recording the EEG in animals
As previously stated, the EEG gross changes are similar between species, in response to DoA increases. However, there may be information in the EEG which is more difficult to quantify and needs adequate signal analysis and good-quality signal recordings. In this context, the differences in species head anatomies may play an important role. Differences between species regarding muscles and subcutaneous structures may justify changes in signal transmission. The relation between brain surface and electrode contact may be an additional source of intervariability between species. In this context, the efficacy of the recording techniques is important to guarantee that a good-quality signal is being acquired. Furthermore, different recording techniques may lead to different signals being recorded and different statistical results. 59
Electrode placement in animals is more difficult than in humans, as the skin often has more fur and is thicker. Additionally, in companion and competition animals, shaving the head skin to place disk electrodes is not an option.
The electrode placement technique used in the recordings is important to obtain adequate quality on the signal. Commercial monitors often have a numerical value for the signal quality displayed as the signal quality index (SQI), as is the case of BIS, CSI and IoC.
When recording EEG in humans the electrodes are usually placed on the surface of the scalp and normally consist of adhesive disks made of tin, silver or gold. The most common are silver/silver chloride disks. In animals, it is difficult to use adhesive electrodes without shaving the head skin. Subdermal needle electrodes have been adopted especially in dogs, 72,96 horses 63,97,98 and cats. 76 Subdermal needle electrodes have the advantage of dispensing with clipping the head fur, which is important in the case of companion and racing animals where appearance of the animal is important and also the fact that the conducting electrode tip is bathed directly in tissue fluid, improving the interface between the generator and recording system. 99 When using adhesive electrodes on the skin it is required that the skin is first shaved and degreased, for example with diethylether. Electrode movement against the surrounding tissue during recording must be avoided to prevent artefact, especially in awake animals.
In dogs’ clinical neurophysiology, subdermal needle electrodes are normally used. Experienced veterinary neurophysiologists have also suggested the use of electrode clamps 100 which has been used in the test of CSI during anaesthesia. 88,89
The refinement of the recording hardware is a very important step in the creation of a monitor for DoA in animals, as it should be practical and reliable at the same time.
How far are we from an objective DoA monitor for animals?
Research performed to date suggests that there is a high potential of the EEG to be used for DoA monitoring in animals. In general, the EEG-derived parameters respond to increasing doses of anaesthetics. Although commercial monitors are easier to use and interpret, non-commercial parameters may allow a faster development of reliable tools, as the methods that translate the information of the EEG into a single index are published and allow modifications and improvements. The development of adequate sensors to record high-quality EEG in different species is essential and should follow the development in EEG analysis.
The validation of EEG-derived parameters will have to be performed for different anaesthetic protocols for each species, as the duality drug-effect may be interfered with by each species anatomy and physiology.
Heyse et al. 101 recently suggested a five-step validation process for EEG-derived indexes consisting of (1) validation of the index for detecting signs of clinical anaesthesia; (2) pharmacokinetic–pharmacodynamic validation; (3) validation of performance under clinical setting; (4) improving outcome and (5) cost-effectiveness. This could be an interesting approach for future developments of DoA monitor validation in veterinary anaesthesia.
Conclusions
There is no objective measure for DoA in animals to date, but there is no doubt that such a tool would highly improve animal welfare, improve the monitoring of anaesthesia, improve the quality of anaesthesia recovery, facilitate anaesthetic titration, reduce costs with anaesthetics and allow better research with less variability induced by anaesthesia.
Research studies performed on animals most commonly explore the EEG as a tool for DoA monitoring and results seem promising as they suggest that non-linear and linear parameters based on the EEG of animals may reflect the anaesthetic dose and correlate well with subjective assessment of DoA. Nevertheless, the existing commercial monitors which are available for human patients seem hardly applicable to animal species which suggest a necessity for developing specific tools for animals.
Footnotes
ACKNOWLEDGEMENTS
This work was supported by FEDER funds trough the COMPETE Program, and by national funds from the Portuguese Foundation for Science and Technology, under the project COMPETE: FCOMP-01-0124-FEDER-009525 (PTDC/CVT/101999/2008), COMPETE: FCOMP-01-0124-FEDER-009497 (PTDC/CVT/099022/2008) and SFRH/BPD/75697/2011.