The first attempts to introduce computerized power spectrum analysis of the electroencephalogram (EEG) as an intraoperative anaesthesia monitoring device started approximately 30 years ago. Since that time, the effects of various anaesthetic agents, sedative and analgesic drugs on the EEG pattern have been addressed in numerous studies in human patients and different animal species. These studies revealed dose-dependent changes in the EEG power spectrum for many intravenous and volatile anaesthetics. Moreover, EEG responses evoked by surgical stimuli during relative light levels of surgical anaesthesia have been classified as ‘arousal’ and ‘paradoxical arousal’ reaction, previously referred to as ‘desynchronization’ and ‘synchronization’, respectively. Contrasting reports on the correlation between quantitative EEG (QEEG) variables derived from power spectrum analysis (i.e. spectral edge frequency, median frequency) and simultaneously recorded clinical signs such as movement and haemodynamic responses, however, limited the routine use of intraoperative EEG monitoring. In addition, the appearance of EEG burst suppression pattern and isoelectricity at clinically relevant concentrations/doses of newer general anaesthetics (i.e. isoflurane, sevoflurane, propofol) may have weakened the dose-related EEG changes previously reported. Despite these findings, the EEG power spectrum analysis may still provide valuable information during intraoperative monitoring in the individual subject. The information obtained from EEG power spectrum analysis may be further supplemented by newer EEG indices such as bispectral index and approximate entropy or other neurophysiological monitors including auditory evoked potentials or somatosensory evoked potentials.
Unlike many clinical procedures, experimental surgeries particularly in large laboratory animal species may be associated with extremely invasive surgical techniques (i.e. lung transplantation, total artificial heart replacement) (Flecknell et al. 1989, Weidemann et al. 1990), long-lasting anaesthesias for up to 24 h (Flecknell et al. 1989, Otto et al. 1997) and the frequent use of muscle relaxants or a combination of these factors. Therefore, assurance of adequate surgical anaesthesia under these conditions becomes more difficult as many clinical signs traditionally used for monitoring depth of general anaesthesia may be either not available (i.e. movement response, skeletal muscle tone, eye reflexes) or unreliable (i.e. haemodynamic variables) due to the combined effects of many different drugs administered during the course of anaesthesia. Hence, the question arises, by which means adequate depth of anaesthesia can be assessed reliably and objectively?
In human anaesthesia, the move to monitoring the electroencephalogram (EEG) has been accelerated by the unacceptable risk of traumatic intraoperative awareness and by the recognition of shortcomings in the previous gold-standard monitoring of anaesthetic depth including haemodynamic signs such as blood pressure and heart rate (Rampil 2001). With the current anaesthetic techniques, including muscle relaxants and opioids, periods of intraoperative awareness are unlikely to be heralded by changes in haemodynamic variables, while otherwise a lack of response to surgical incision does not guarantee amnesia or the lack of conscious awareness of intraoperative pain in the individual patient (Rosen & Lunn 1987, Sandin et al. 2000). For these purposes, the EEG has been the most widely evaluated neurophysiological tool used to assess the depth of anaesthesia (Glass et al. 1997). One of the primary intentions of a quantitative evaluation of the depth of anaesthesia by means of processed EEG variables was to titrate anaesthetic agents in order to avoid drug overdose, prevent intraoperative awareness, and to provide the anaesthesiologists with automatic feedback systems for drug adjustment (Guérit 1998). The same intentions can be applied to general anaesthesia in animals particularly for circumstances existing during the aforementioned experimental surgical conditions.
Definitions of general anaesthesia
Very recently, general anaesthesia in human beings has been defined as a drug-induced loss of consciousness (LOC) during which patients are not arousable, even by painful stimulation (American Society of Anesthesiologists 2006). Previously published desired components of general anaesthesia also include analgesia, lack of movement to noxious stimulation, immobility, muscle relaxation and cardiovascular stability, meaning the ablation of heart rate and blood pressure responses to noxious stimulation (Steffey 1983, Antognini & Berg 1995, De Beer et al. 1996).
‘Consciousness’ is a state in which a patient is able to process information from his or her surroundings and is assessed by observing a patient's purposeful response to various stimuli (American Society of Anesthesiologists 2006). LOC is a threshold or all-or-non phenomenon (Prys-Roberts 1987) and has been defined as the loss of awareness of surrounding and alertness to events in human patients (Kearse et al. 1998).
The primary endpoints used in humans to determine the threshold for LOC during induction of anaesthesia include the patient's inability to respond to non-noxious stimuli such as (i) cessation of counting (Campagna et al. 2003); (ii) loss of response to verbal command (Dunnet et al. 1994); (iii) suppression of the eyelash reflex (Forrest et al. 1994, Gugino et al. 2004); (iv) calling out one's name (Glass et al. 1997); (v) uninhibited release in a handheld object (Kearse et al. 1998); or (vi) light tapping on the shoulder or light shaking (Kodaka et al. 2005). In addition, up to 1.3 times the minimum alveolar concentration (MAC) of halogenated volatile anaesthetics supplemented with opioids and nitrous oxide have been recommended for suppression of awareness during anaesthesia in humans (Sandin et al. 2000). Return of consciousness, on the other hand, is indicated by eye opening in response to verbal commands (Gugino et al. 2004).
EEG recordings during anaesthesia induction revealed an increase in fast, high-frequency oscillations of voltage waves in frontal regions, spreading to more posterior regions with increased sedation and onset of unconsciousness (John & Prichep 2005). Conversely, slow low-frequency waves appeared in posterior regions and migrated forward. A comprehensive explanation of the mechanism by which anaesthetics cause LOC has not yet been developed (John & Prichep 2005). The anaesthetic dose required to suppress consciousness exceeds the amnestic dose but is substantially less than that required for surgical immobility (Chortkoff et al. 1995a,b, Antognini & Carstens 1999, American Society of Anesthesiologists 2006).
‘Depth of anaesthesia’ or ‘depth of hypnosis’ refers to a continuum of progressive central nervous system (CNS) depression and decreased responsiveness to stimulation (American Society of Anesthesiologists 2006). Administration of anaesthetics can produce a wide range of hypnotic depths, from mild inattention to unresponsiveness to noxious stimuli (Campagna et al. 2003). There are various functional definitions for the term ‘hypnosis’, i.e. drug-induced impairment of cognitive functions required for responding appropriately to environmental stimuli, including attention and perception.
Sometimes, the term ‘sedation’ is used as a synonym for ‘hypnosis’ and describes a state of drug-induced hypnosis with anxiolysis, diminished motor activity and decreased arousal (Campagna et al. 2003).
‘Amnesia’ is defined as the absence of recall (American Society of Anesthesiologists 2006) or the partial or complete loss of memory (Campagna et al. 2003). Both hypnosis and amnesia are considered to have supraspinal anaesthetic effects (Eger et al. 1997).
‘Immobility’ is another essential goal of general anaesthesia (Antognini & Carstens 2005). The achievement of this anaesthetic endpoint was used almost 40 years ago to develop a standard of anaesthetic potency (Eger et al. 1965). The authors defined the MAC of inhalant anaesthetics as the concentration that prevents gross purposeful movement in 50% of subjects when a supramaximal noxious stimulus is applied, e.g. clamping the tail of an animal.
Subsequent experimental studies in rats revealed that MAC represents primarily the level of depression of a spinal antinociceptive reflex as it is independent of forebrain structures (Rampil et al. 1993) and remains unaltered after spinal transection (Rampil 1994).
MAC-BAR (Blockade of Autonomic Responses) is the MAC that blocks changes in heart rate, blood pressure, pupil diameter and/or plasma catecholamine concentrations in 50% of subjects when a supramaximal noxious stimulus is applied (Roizen et al. 1981). The ratio of MAC-BAR/MAC for isoflurane in goats is approximately 2.8 (Antognini & Berg 1995) and for halothane in humans is approximately 1.45 (Roizen et al. 1981).
Finally, MAC-awake is the MAC in humans that abolishes responsiveness to verbal commands. MAC-awake coincides with the anaesthetic concentration that prevents learning and memory and thus presents the endpoint for amnesia (Chortkoff et al. 1995b). Like the loss of righting reflexes in an animal with an inability to return from its back to an upright position, MAC-awake measures responses to non-noxious stimuli. Therefore, a close relation between MAC-awake and loss of righting reflexes has been suggested (Campagna et al. 2003).
Limitations of the MAC concept include its ‘all-or-none’ and subjective nature. Determination of MAC is subjective because it requires the investigator to state that the animal (or human) either did or did not display ‘gross and purposeful movement’ (Antognini & Carstens 2005).
Effects of general anaesthesia on sensory processing
For many injectable and inhalational anaesthetics, the proposed mechanism of action is to impede with the transfer of somatosensory information at synaptic sites located in the brainstem (Eger et al. 1971), thalamus (Angel 1993) and cerebral cortical (Berg-Johnsen & Langmoen 1987, Angel 1993). Anaesthetic-induced CNS depression is associated with: (i) loss of conscious experience and decrease in the amount of information which reaches the cerebral mantle; (ii) loss of memory; (iii) changes in spontaneous activity recorded from the scalp (EEG); (iv) loss of volitional control of the skeletal musculature; (v) attenuation of protective reflexes (reflex withdrawal, cough, gag reflexes); (vi) loss of postural reflexes; (vii) wide ranging changes in cardiovascular and respiratory performance (Angel 1993).
In addition to their direct cortical and subcortical effects, anaesthetics can exert their effects on brain function (i.e. amnesia, unconsciousness), also indirectly by impeding with the centripetal transfer of somatosensory information at the level of the spinal cord (Angel 1993, Kendig 1993, Steriade 1996). This assumption is supported by the fact that lumbar intrathecal administration of bupivacaine can reduce the hypnotic requirements for thiopental in rats by approximately 39% (Eappen & Kissin 1998). Moreover, recent evidence suggests that other anaesthetic endpoints such as suppression of movement (Antognini & Schwartz 1993, Rampil et al. 1993, Rampil 1994) and haemodynamic responses (Antognini & Berg 1995) to noxious stimulation, at least in part, results from direct anaesthetic actions in the spinal cord. Previous data indicate that inhalant anaesthetics including halothane, enflurane, isoflurane, sevoflurane and desflurane may cause immobility by different spinal mechanisms such as diminishing α-motoneuron excitability as indicated by an F-wave depression (King & Rampil 1994, Rampil & King 1996, Antognini et al. 1999) and/or a reduction in dorsal horn spontaneous activity (Jinks et al. 2004). Further evidence for a spinally mediated suppression of movement response to noxious stimulation is provided by the facts that neither acute precollicular decerebration (Rampil et al. 1993) nor high thoracic spinal cord transection (Rampil 1994) altered the nature of the motor responses of isoflurane-anaesthetized rats after tail-clamping.
Data obtained during selective delivery of isoflurane to either the head or the torso in anaesthetized goats further suggest that cardiovascular responses to noxious stimuli that are generated in the spinal cord, can be suppressed by isoflurane's action on the spinal cord while its action on the brain may have little effect on changes in arterial blood pressure (Antognini & Berg 1995).
General anaesthesia can therefore be understood to be the result of heterogenous actions at specific anatomical sites within the CNS (Rampil 2001). Peripheral anaesthetic action, on the other hand, such as suppression of nociceptor function or alteration of axonal transmission, seems to be of little importance for the magnitude of movement response to noxious stimuli (Antognini & Kien 1995).
The electroencephalogram
The traditional EEG is defined as a time-domain recording of spontaneous electrical signals formed by the summation of the activity of millions of neurons in the cerebral cortex (Tooley et al. 1984, Gugino et al. 2004). The activity is produced from excitatory and inhibitory post-synaptic potentials in large pyramidal neurons located in the lower layers (e.g. layer V) of the cerebral cortex (Prince & Shanzer 1966, Tooley et al. 1984, Rampil 1998). Measures of the electrical signal such as amplitude and frequency are modulated by afferent inputs transmitted from sensory-specific thalamic nuclei serving as gates between receptors and the cortex and by ‘epicentres’ within cortical areas (John & Prichep 2005). The EEG frequency bands frequently applied for monitoring depth of anaesthesia are the delta (δ) (0–4 Hz), theta (θ) (4–8 Hz), alpha (α) (8–13 Hz) and beta (β) (13–30 Hz) bands (Kaieda et al. 1989, Schwender et al. 1996).
The normal EEG in a relaxed awake human individual with the eyes closed is characterized by rhythmic α activity with greatest amplitude in the posterior region (Tinker et al. 1977, Kishimoto et al. 1995, Gugino et al. 2001). Alpha activity arises from the interaction between populations of neurons in the thalamus and in certain areas of the cortex (John & Prichep 2005). Pacemaker neurons distributed throughout the thalamic regions oscillate in the α frequency range, regulating and synchronizing the excitability of the cells in the thalamocortical pathways (John & Prichep 2005). This modulation is further distributed throughout the cortex by cortico–cortical interactions (Gugino et al. 2004, John & Prichep 2005).
The EEG frequency content may be modulated by three main types of neurons located in the thalamic nuclei. These include the thalamocortical relay nuclei (TCR) projecting to the cortex, reticular nucleus neurons (RE) interacting synaptically with the TCR cells and local intrinsic neurons (Gugino et al. 2004, John & Prichep 2005). By GABAergic (γ-amino butyric acid) action, RE neurons can inhibit thalamic pacemaker neurons and thereby slowing their rhythms (Hughes & John 1999, Gugino et al. 2004, John & Prichep 2005). These inhibitory influences act to hyperpolarize the pacemakers and diminish sensory throughput from the TCR neurons to the cortical receiving areas, thereby slowing the mean frequency of the oscillators and shifting the α rhythm toward the θ rhythm (Hughes & John 1999, John & Prichep 2005).
Further nucleus reticularis hyperpolarization of TCR neurons (Edmonds & Paloheimo 1985, Hughes & John 1999, Gugino et al. 2004) together with the diminished activation of the cortex by the ascending reticular activating system (ARAS) (John & Prichep 2005) results in an unmasking of δ oscillator neurons in the thalamus and deep cortical layers and leads to production of a very slow δ rhythm. In the awake state, δ oscillators are normally inhibited by the ARAS (Hughes & John 1999) and consciousness is maintained by a circulating activity flow among ARAS, intralaminar nuclei and the cortex (John & Prichep 2005).
The brainstem reticular formation was denoted as the ARAS (John & Prichep 2005). The ARAS receives inputs via collaterals from sensory pathways (John & Prichep 2005). Activation of this system by incoming stimuli causes the brainstem reticular formation to inhibit the nucleus reticularis, opposing the GABAergic inhibitory action of nucleus reticularis by acetylcholine and releases its inhibitory actions on the thalamus (John & Prichep 2005). The thalamic gates are now opened and afferent inputs are transmitted from the sensory-specific thalamic nuclei via the projection pathways to axosomatic synapses of pyramidal neurons predominantly in the lower layers of the cortex (Layer V). Therefore, strong activation by ARAS results in cortical ‘arousal’ referring to desynchronization of the α oscillators with appearance of faster rhythms in the β frequency range (Hughes & John 1999, John 2001, John et al. 2001). Early experimental studies in awake and anaesthetized cats revealed that direct electrical stimulation of the brainstem reticular formation resulted in the transition from sleep to wakefulness as indicated by a shift in the EEG pattern from high-voltage slow wave to low-voltage fast wave activity, so-called physiological arousal reaction or desynchronization (Moruzzi & Magoun 1949, Prince & Shanzer 1966, Kaada et al. 1967).
Power spectrum analysis of the electroencephalogram
Time-domain recordings of the EEG will deliver an enormous amount of data and requires additional trained personal for continuous EEG signal analysis (Fleming & Smith 1979). In order to decrease the amount of data, computer-processed EEG analysis such as the power spectrum analysis has been employed for a more practical approach to intraoperative EEG monitoring (Myers et al. 1973, Levy et al. 1980, Rampil et al. 1980). The first step in the process of power spectrum analysis consists of digitizing the primary (‘raw’) EEG signal at frequent intervals for a certain period of time (e.g. 2–16 s) known as an ‘epoch’ (Myers et al. 1973, Levy et al. 1980). For example, an analogue-to-digital (A/D) signal transformation can be performed at a rate of 64 transformations per second, yielding a 256 sample point A/D conversion during a 4 s epoch of data entry (Myers et al. 1973). Next, the data of one epoch are subjected to Fast Fourier Transform (FFT). FFT separates the EEG epochs into a number of component sinusoidal (sine and cosine) waveforms across the entire frequency range (i.e. 0.5–45 Hz), each having a calculated amplitude, frequency and phase whose sum is the original waveform (Levy et al. 1980, Pichlmayr et al. 1983, John & Prichep 2005). The numerical value of an EEG signal recorded for a certain time series (t) (epoch) can be calculated from the amplitude (ai) at each frequency (fi) in the original EEG tracing based on the following formula (John Prichep 2005):
The analysis of successive epochs is repeated continuously with no loss in primary data while the resulting spectra are plotted sequentially along the Y–axis (Myers et al. 1973). The speed of data processing allows a continuous, minute–by–minute assessment of the depth of anaesthesia (Levy et al. 1980, Walter 1987). By convention, the term ‘power’ has been used as a measure of amplitude reflecting the origins of Fourier analysis in radio-engineering (Levy et al. 1980, John & Prichep 2005).
In order to summarize the most relevant information about a particular EEG sample, quantitative measures derived from power spectrum analysis have been devised (Kiyama & Takeda 1997). These QEEG variables include EEG median frequency (MF; 50% quantile) (Schwilden & Stoeckel 1980, Otto et al. 1996), spectral edge frequency (SEF) as the 80% (White & Boyle 1989, Otto & Short 1991), 90% (Schwender et al. 1998) or 95% quantile (Hudson et al. 1983, Johnson et al. 1994), total power (μV2) (Schwender et al. 1996, Haga et al. 2000), percentage distribution of total power (relative power) into the δ, θ, α and β frequency bands (De Beer et al. 1996, Otto et al. 1996) and power band ratios θ/δ, α/δ, β/δ (Schwilden & Stoeckel 1980, Haga et al. 2001) derived from relative power. Reliable correlations between QEEG variables and clinical signs demonstrate that certain aspects of brain electrical activity are sensitive to the level of consciousness. They provide practical clinical evidence that consciousness is a neurobiological phenomenon that can be objectively quantified, so that depth of anaesthesia can be analysed reliably using electrophysiological variables. These variables, however, provide relatively little insight into the underlying physiology of anaesthesia or the brain mechanisms mediating consciousness (John & Prichep 2005).
Another variable frequently used for QEEG analysis is the burst suppression ratio (BSR). EEG burst suppression pattern has been defined as an intermittent electrical activity interspersed with silence or as a near-complete depression of cortical electrical activity, which indicates a non-specific (e.g. trauma, drugs, hypothermia) reduction in cerebral metabolic activity (Dwyer et al. 1994, Rampil 1998). The BSR has been calculated as the percentage of isoelectric periods occurring over a certain period of time (e.g. 63 s) (Detsch et al. 2000). In addition, application of a burst-compensated SEF 95% (BcSEF) has been reported as well which was calculated offline as BcSEF = SEF × (1 – BSR/100) (Detsch et al. 2000).
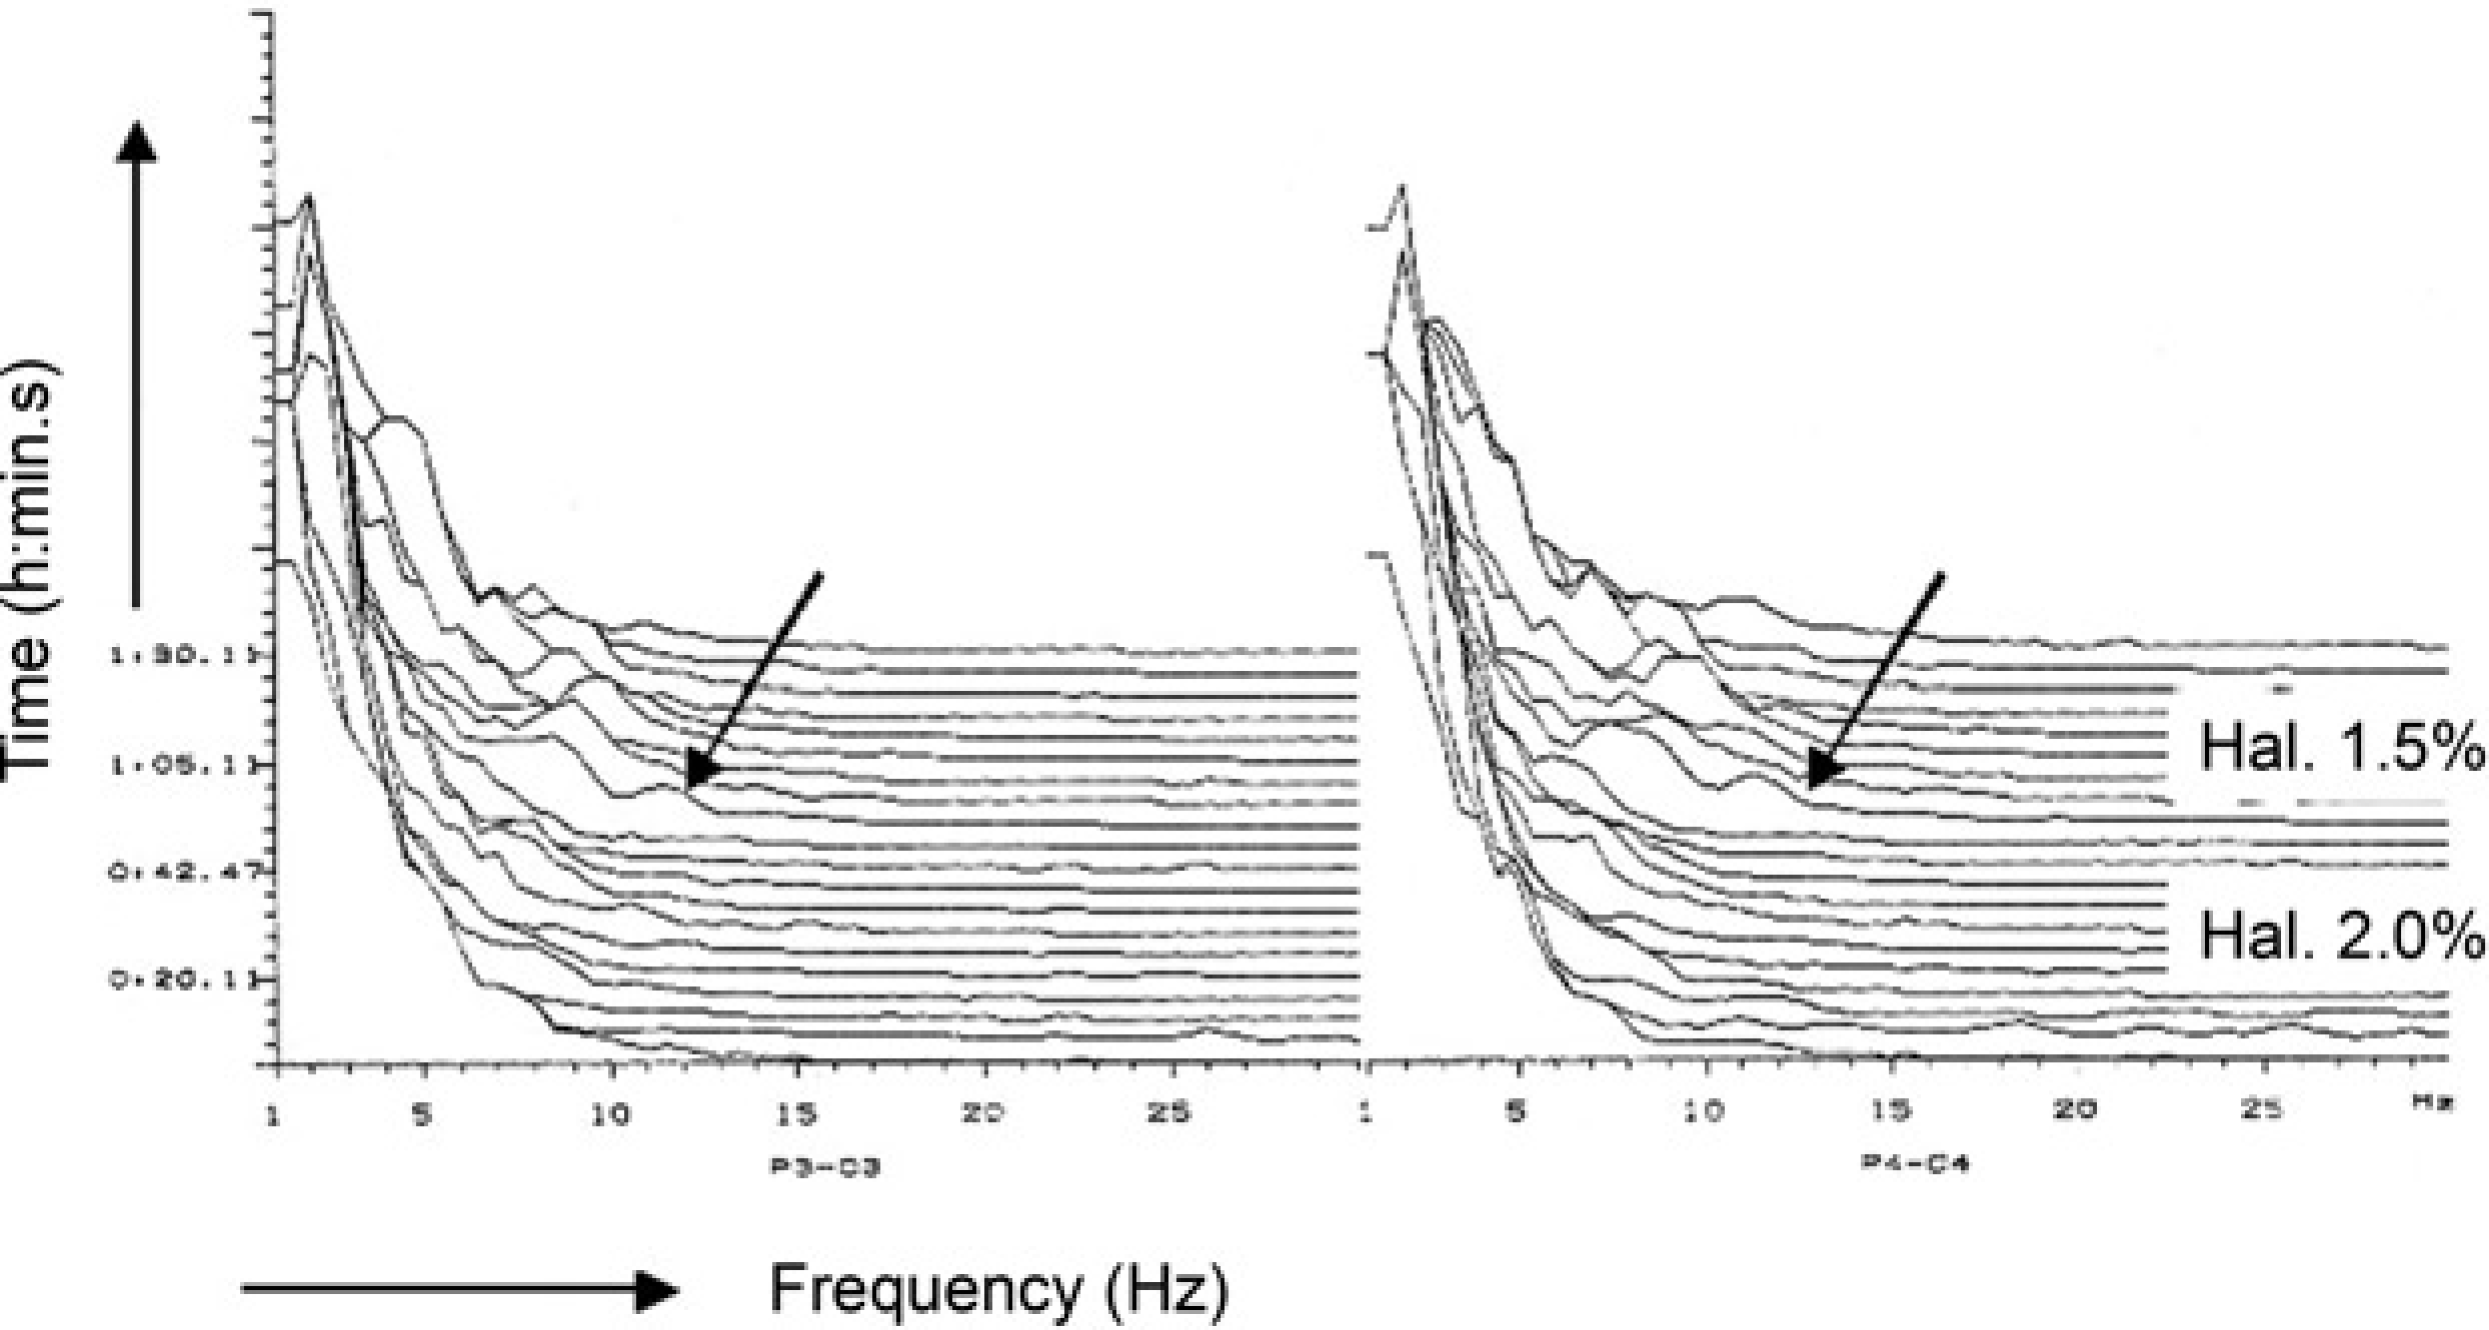
The most attractive form of display for the calculated power spectrum during anaesthesia is the compressed spectral array (CSA), where the component power is plotted as a function of frequency (μV2/Hz) for each analysed epoch (Myers et al. 1973, Levy et al. 1980, Tooley et al. 1984). The squared amplitudes are plotted as a histogram and then smoothed to assist in its readability. The analysis process of epochs is repeated continuously with no loss in primary data while the resulting power spectra are plotted sequentially along the Y-axis and the frequency range along the X-axis (Myers et al. 1973). This plotting of relative power vs. frequency for each epoch produces a three-dimensional graph in which there appears to be ‘hills’ at those frequencies making large contribution to the EEG, and ‘valleys’ at frequencies that contain less power (Figures 1–3). Power spectrum analysis and subsequent display of data in the CSA format provide a simplified identification of small changes in a complex EEG (Levy et al. 1980).
Two-channel electroencephalogram (EEG) recording (compressed spectral array format) during stifle surgery in a halothane-anaesthetized sheep. The arrow (↙) indicates a shift in EEG power towards the higher frequency ranges that appeared after the halothane vaporizer setting was decreased from 2.0% to 1.5% in oxygen
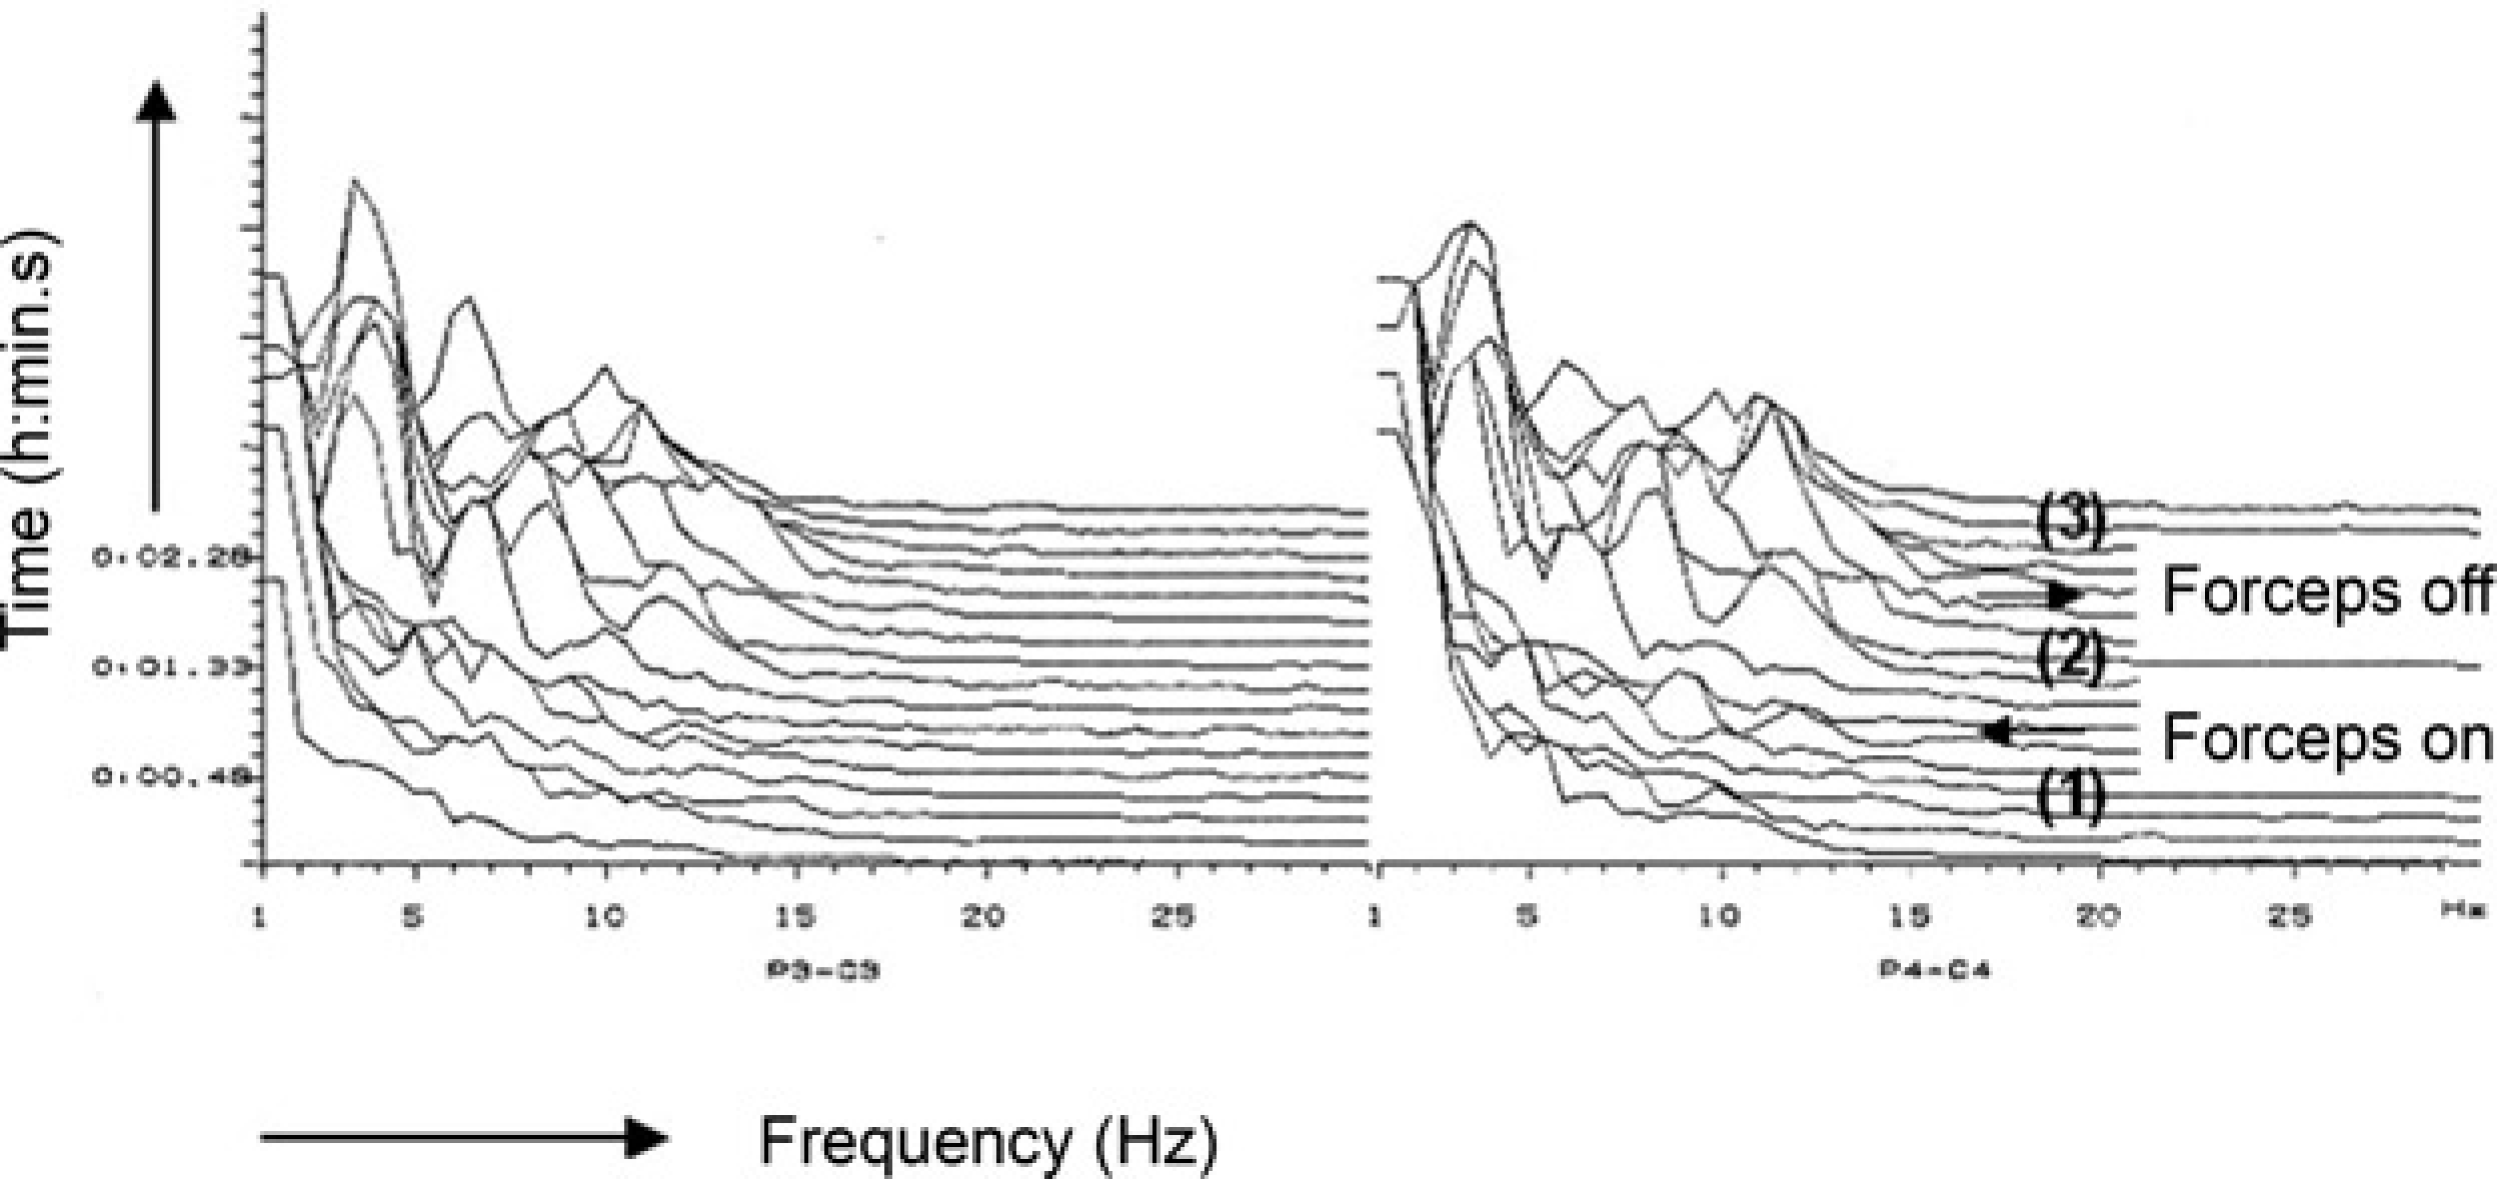
Two-channel electroencephalogram recording (compressed spectral array format) in a dog anaesthetized with 1.9% end-tidal concentration of isoflurane in oxygen. (1) One-minute baseline recording; (2) One-minute stimulation; full-ratchet clamping (armed péan forceps) applied to the interdigital skin of a rear leg; (3) One-minute post-stimulation period. Heart rate and mean arterial blood pressure increased from 68 beats per minute (bpm) and 67.5 mmHg (1) to 136 bpm and 125 mmHg (2) and decreased to 87 bpm and 115 mmHg (3), respectively
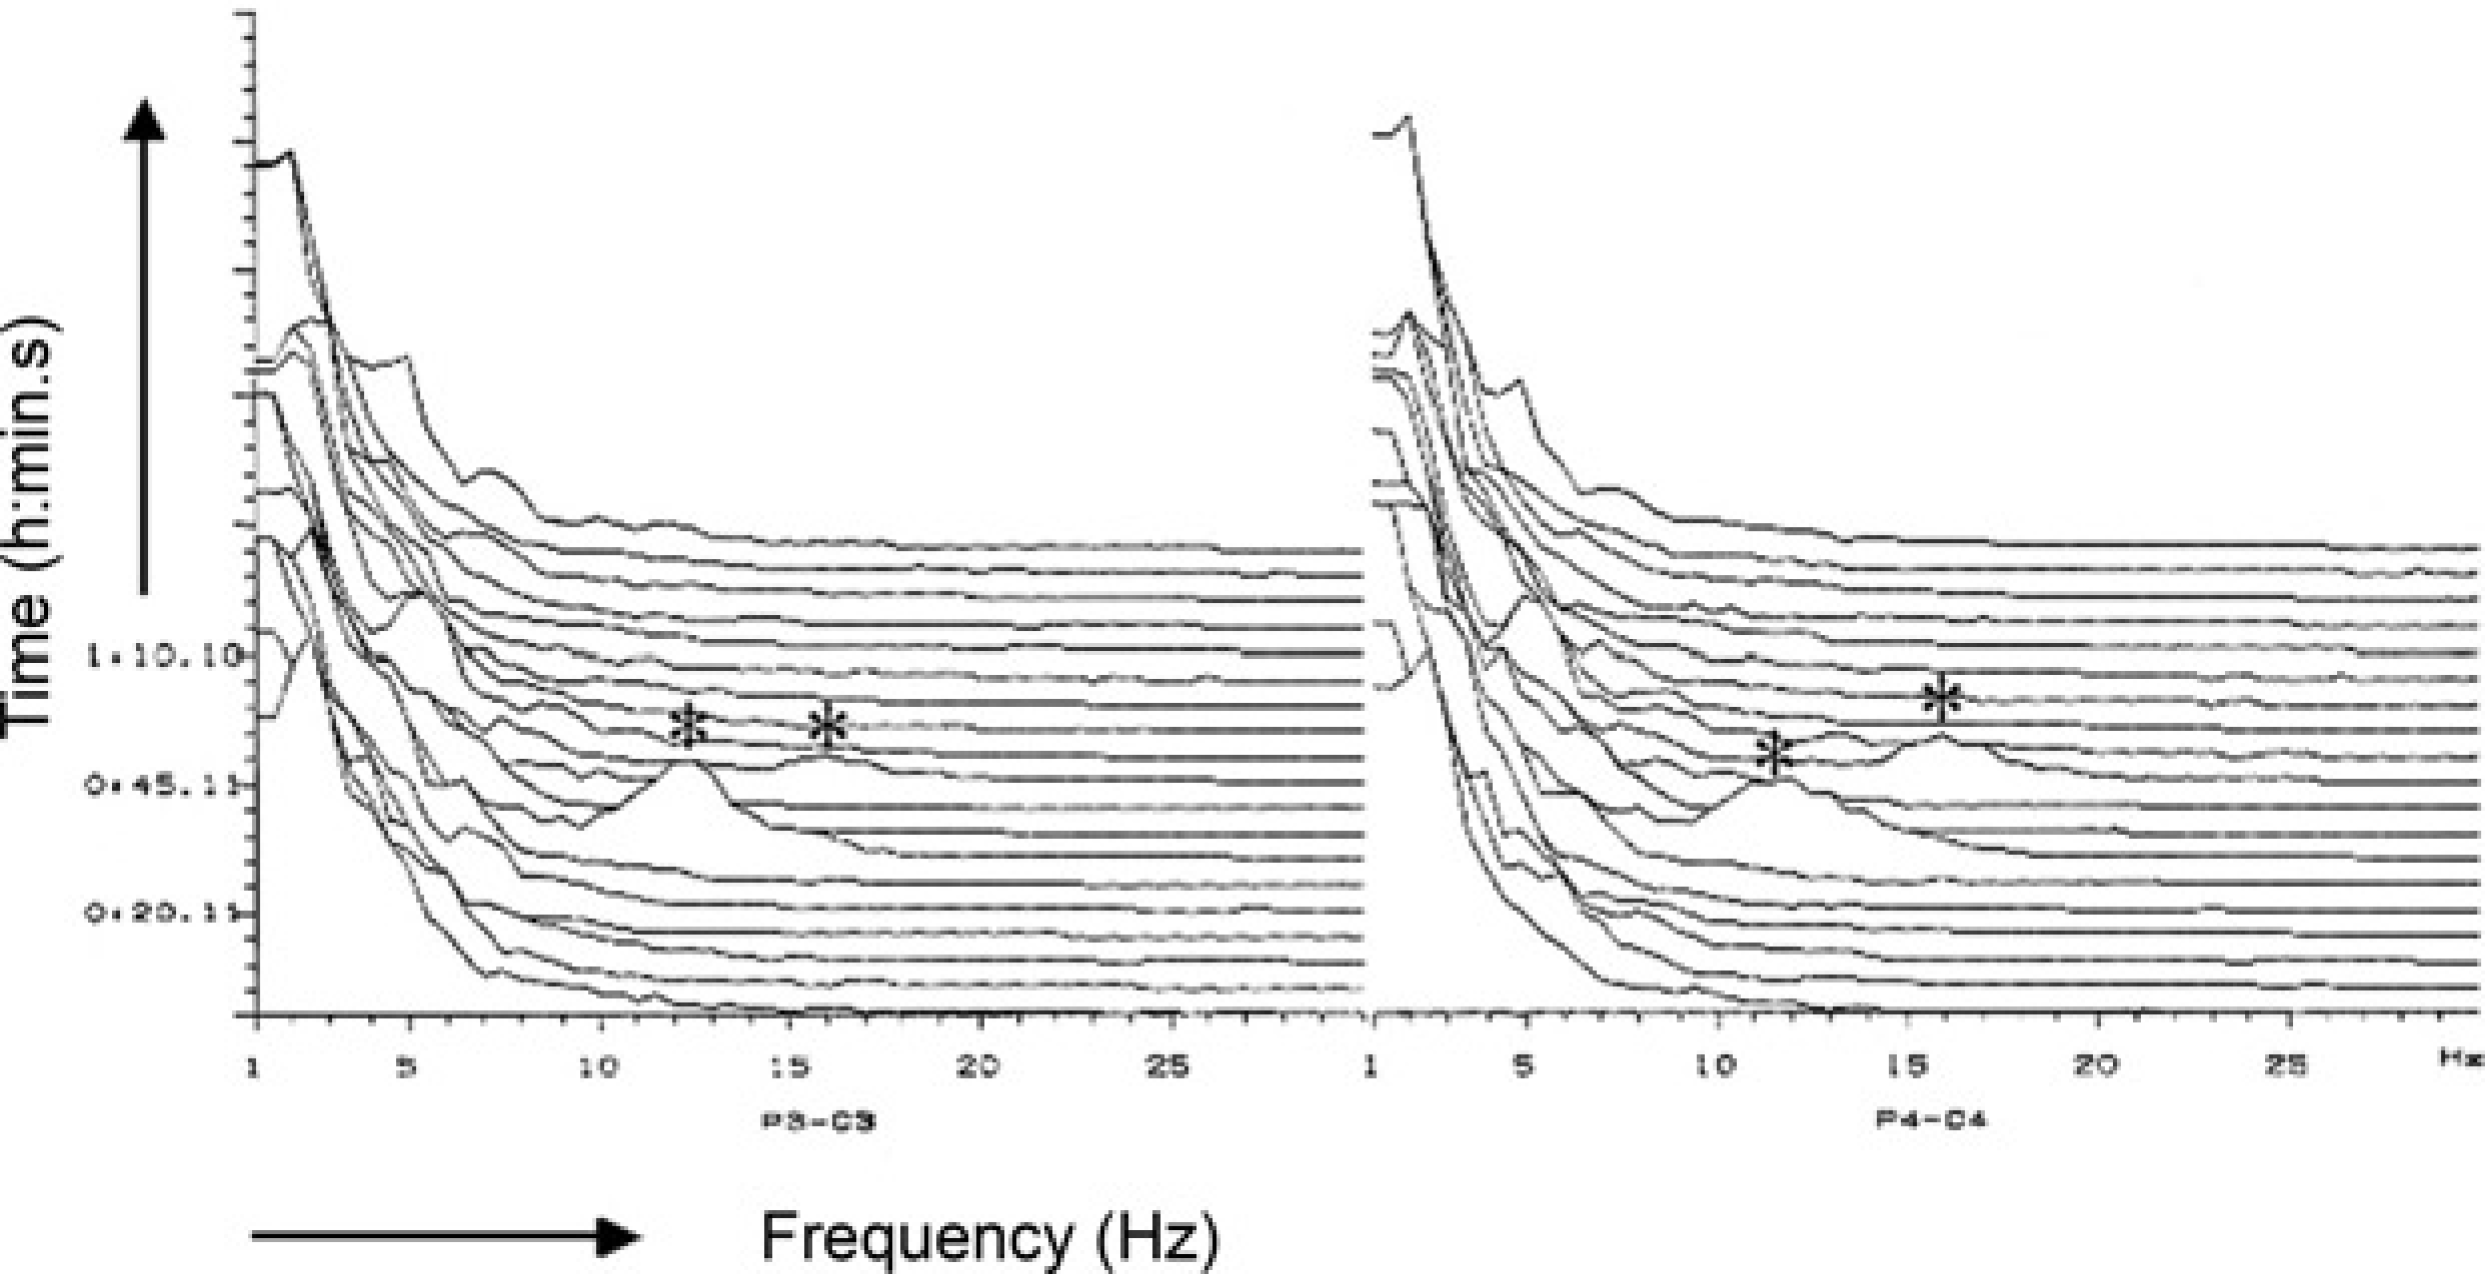
Two-channel electroencephalogram recording (compressed spectral array format) during stifle surgery in a halothane-anaesthetized sheep. The asterisks (*) indicate use of a drill during cruciate ligament replacement
Anaesthetic effects on the electroencephalogram
In the anaesthetized subject, depression of thalamic gates together with diminished activation of the cortex by the ARAS will be indicated by a progressive slowing of the EEG in which the underlying electrical signal will change from low-voltage fast-wave to high-voltage slow-wave pattern. A dose-dependent change in EEG activity along with an increase in anaesthetic depth was clearly demonstrated for many anaesthetics including thiopental (Kiersey et al. 1951) and isoflurane (Eger et al. 1971). In both studies, increasing doses of the anaesthetic resulted in an increase in EEG amplitude concomitant with a decrease in frequency of the EEG signal. A further increase in cerebrocortical depression was first indicated by the appearance of burst suppressions followed by a complete loss of electrical discharge (‘isoelectricity’). As soon as the dose of the anaesthetic agent was reduced, the EEG pattern reversed and lighter levels of anaesthesia were indicated by a decrease in amplitude and an increase in frequency.
When QEEG variables are applied, anaesthetic-related EEG slowing is associated with an increase in total power, an increase in relative power in the δ and θ frequency bands concomitant with a decrease in α and β power, and a decrease in both MF and SEF. These effects on the EEG pattern have been demonstrated in human patients and animals for a variety of anaesthetic agents including thiopental (Hudson et al. 1983), etomidate (Schwilden & Stoeckel 1980), propofol (Schwilden et al. 1989, Bergamasco et al. 2003), halothane (Pichlmayr & Lips 1980, Otto & Short 1991), enflurane (Schwilden & Stoeckel 1980), isoflurane (Schwender et al. 1996), sevoflurane and desflurane (Schwender et al. 1998), respectively. A reduction in anaesthetic concentration will reverse EEG slowing. Changes from deeper to lighter levels of anaesthetic depth will be indicated by a shift in EEG power from the lower (δ, θ) to the higher (α, β) frequency range and by a numerical increase in MF and SEF. This shift in EEG frequency will be presented most obviously in the CSA format (Figure 1).
Differences in the effects of anaesthetic agents on the electroencephalogram
Previous studies in dogs revealed that EEG isoelectricity could be achieved at end-tidal isoflurane concentration of 3.0% (Newberg et al. 1983), while 9.1% of end-tidal halothane concentration will be required for complete suppression of EEG activity (Michenfelder & Theye 1975). These concentrations are equivalent to approximately 2.3 times the MAC of isoflurane and 10.5 times MAC of halothane in dogs, respectively (Steffey et al. 1975, Steffey & Howland Jr 1977). The differential effects between isoflurane and halothane, indicating a more pronounced depression in cortical discharge by isoflurane than by halothane, have also been reported in other animal species. Equine studies revealed that at similar levels of anaesthetic depth, determined either by clinical signs or by MAC multiples, values for SEF, MF and β/δ ratio were lower and total amplitude was higher in horses anaesthetized with isoflurane compared with halothane anaesthesia (Otto & Short 1991, Johnson & Taylor 1998). In rats, a comparison between halothane and isoflurane at four equivalent MAC values also revealed significant lower MF values and the occurrence of burst suppression in the isoflurane-anaesthetized rats (Antunes et al. 2003a). A comparison of the effects of MAC multiples on EEG variables revealed even significantly higher numerical values for SEF and MF in pigs anaesthetized with sevoflurane in comparison with isoflurane (Martín-Cancho et al. 2003).
These results suggest that some anaesthetic agents such as thiopental (Kiersey et al. 1951), isoflurane (Eger et al. 1971) or propofol (Antunes et al. 2003b) cause more pronounced EEG suppression even at clinically relevant concentrations, while others (i.e. halothane) (Michenfelder & Theye 1975) may not. In addition, the pronounced depression of cerebrocortical electrical activity exerted by isoflurane and propofol may also be associated with a loss of dose-dependency in EEG changes in the higher concentration range (Rampil & Laster 1992, Antunes et al. 2003a,b).
Another important aspect for intraoperative EEG monitoring is the point of LOC that has been defined for different anaesthetic agents. Forrest et al. (1994) suggested that MF values smaller than 6.8 Hz are good predictors for unconsciousness in patients anaesthetized with propofol, while Schwilden and Stoeckel (1987) reported unconsciousness for MF values of <5 Hz for isoflurane anaesthesia. However, MF threshold values for propofol were obtained from patients during stable maintenance of anaesthesia with propofol alone and not subjected to surgical stimuli, while data for isoflurane were recorded during intraoperative anaesthesia which, at least in part, may have contributed to the differences in MF.
Contrasting results were found for the effects of opioid analgesics on the EEG pattern. Increasing serum concentrations of fentanyl, alfentanil or sufentanil were associated with progressive EEG slowing and a decrease in SEF in human patients (Scott et al. 1985, 1991). Similarly, intraoperative EEG monitoring during halothane anaesthesia revealed lower MF values and θ/δ ratios in sheep pre-treated with buprenorphine compared with those not treated with buprenorphine (Otto et al. 2000). The opposite effect was reported following injection of fentanyl during light propofol or isoflurane anaesthesia in rats (Antunes et al. 2003c). Both MF and SEF tended to increase after administration of fentanyl indicating an increase in EEG frequency content.
Electroencephalogram responses to noxious stimulation
One major application of intraoperative EEG monitoring is the identification of EEG responses evoked by surgical stimuli. These responses need to be determined before electroencephalography can be used as a valuable tool for the assessment of anaesthetic depth (Levy 1986).
The transition from sleep to wakefulness is characterized by an apparent breaking up of high-voltage slow-wave discharge of the cerebral cortex and replacement with low-voltage fast-wave activity (Moruzzi & Magoun 1949). This alteration in the EEG pattern has been called ‘desynchronization’ or ‘arousal’ which may be produced by any type of afferent stimulation that arouses the subject to alertness. The direct electrical stimulation of the brainstem reticular formation via concentric bipolar electrodes caused EEG arousal in cats. The generalized EEG response was seen best when a low intensity (1–3 V), high frequency (up to 300 Hz) electrical stimulus was applied after light chloralose anaesthesia had induced synchronization (high-voltage fast-wave pattern) without greatly impairing neural excitability before stimulation (Moruzzi & Magoun 1949). With deeper levels of anaesthesia, noxious stimulation failed to elicit EEG desynchronization. Cortical arousal was also reported in response to direct stimulation of the brainstem in rabbits anaesthetized with pentobarbital (Arduini & Arduini 1954), and during ether or thialbarbital anaesthesia in cats (Golovchinsky & Plehotkina 1971). In both studies, increasing doses of the barbiturate led to a progressive impairment of the EEG arousal reaction until this response was completely abolished. Interestingly, cortical arousal could be evoked at deeper stages of ether anaesthesia than during barbiturate anaesthesia (Golovchinsky & Plehotkina 1971).
EEG arousal similar to that reported for direct stimulation of the brainstem reticular formation could also be evoked by peripheral nerve stimulation in dogs anaesthetized either with halothane or methoxyflurane (Kuramoto et al. 1979). Application of supramaximal electrical stimuli to both sciatic nerves elicited a clear EEG arousal response at 0.5% end-tidal halothane concentration, while the EEG response was completely suppressed at 1.4% halothane. When using power spectrum analysis in human patients, replacement of predominant high-voltage slow-wave activity (δ, θ) by low-voltage fast-wave activity (α, β) during arousal reaction has been indicated by a numerical increase in MF (Schwilden & Stoeckel 1980, Stanski et al. 1987), SEF (Stanski et al. 1987, De Beer et al. 1996) and in the power band ratios (θ/δ, α/δ, β/δ) (Schwilden & Stoeckel 1980). Stimuli such as laryngoscopy, orotracheal intubation (Freye et al. 1999), skin incision (Stanski et al. 1987) or peritoneal dissection (Röpcke et al. 2001) may all cause EEG arousal. Similarly, EEG arousal in anaesthetized sheep subjected to orthopaedic surgery was elicited by skin disinfection, skin incision and/or using a drill (Otto & Mally 2003). Arousal reaction evoked by a one-minute mechanical compression (armed péan forceps) of the interdigital skin at a hind-limb in an isoflurane-anaesthetized dog is presented in Figure 2 (CSA). Noxious stimulation during 1.9% end-tidal isoflurane concentration in oxygen resulted in a transient pronounced shift in EEG power from the δ and θ bands towards the α and β bands associated with an increase in SEF and MF. The response was reversed after removal of the forceps. Another transient EEG arousal response evoked during stifle surgery in a halothane-anaesthetized sheep (2.0% vaporizer setting) is presented in Figure 3.
Unlike the classic EEG arousal reaction, EEG activation in response to noxious stimuli may be also indicated by an opposite alteration in the cortical discharge, referred to as ‘synchronization’, ‘paradoxical arousal’ or ‘slowing’ of the EEG. Although the usual response of the EEG to increased noxious stimulation is acceleration and desynchronization, some poorly understood physiological processes may cause the patient's EEG to synchronize (Rampil 2001). Clinical studies in human patients revealed that this type of EEG activation is associated with a sudden shift in EEG activity from the higher to the lower frequency ranges resulting in a considerable increase in high-amplitude δ-activity and a decrease in SEF (Bischoff et al. 1993, Kochs et al. 1994, Kiyama & Takeda 1997, Rampil 2001). Paradoxical arousal, that could falsely be interpreted as a deepening of anaesthesia or severe hypoxia (Bimar & Bellville 1977), was reported primarily in isoflurane-anaesthetized patients who underwent visceral urological, abdominal or gynaecological surgeries.
EEG synchronization has also been reported before in experimental studies in cats anaesthetized with either chloralose or pentobarbital (Prince & Shanzer 1966, Kaada et al. 1967). Both types of EEG activation pattern, arousal or paradoxical arousal, could be elicited by high frequency electrical stimulation of the midbrain reticular formation. Kaada et al. (1967) demonstrated that identical stimuli applied to the same electrode in a fixed position might evoke either type of response, depending on the depth of anaesthesia, the stimulation frequency and the stimulation intensity (voltage). Furthermore, the authors reported on individual differences. In several cats synchronization was encountered at all stimulus intensities while in other individual cats only desynchronization could be elicited. Similar results were found in a previous study in sheep anaesthetized with isoflurane for experimental orthopaedic surgery (Otto & Mally 2003). In this study both types of EEG activation pattern were recorded and data suggest that appearance of either response may have been affected by the depth of anaesthesia and stimulation intensity. In halothane-anaesthetized patients, skin incision evoked desynchronization in adult patients while synchronization was found to be the predominant response in infants and children (Oshima et al. 1981). Although the causes resulting in intraoperative EEG arousal or paradoxical arousal still remain unclear, the occurrence of either response may be, at least in part, affected by depth of anaesthesia, intensity and type of stimuli, individual differences and age of the patient.
In previous studies a reduction in δ and θ power and a subsequent increase in MF have been suggested as specific indicators for nociception related EEG arousal reaction (Freye et al. 1999, Murrel et al. 2003), while an increase in power in the α frequency band was correlated with cortical reactivation resulting from reduced hypnosis (Freye et al. 1999). This assumption is in contrast to previous reports suggesting that both activation of the ARAS by afferent nociceptive impulses on one hand (Pichlmayr et al. 1983, Röpcke et al. 2001) and the action of opioid analgesics on the other hand (Pichlmayr et al. 1983, Scott et al. 1985, 1991) result in unspecific EEG changes, such as an increase in frequency content and EEG slowing, respectively. These alterations in the EEG pattern reflect changes in vigilance only and therefore support the hypothesis that EEG changes can be primarily used to describe the hypnotic/sedative drug effects (Röpcke et al. 2001, Bruhn et al. 2003, John & Prichep 2005). Thus, one of the primary goals of intraoperative EEG monitoring is the maintenance of a high-voltage slow-wave EEG pattern with predominant δ activity that has been obtained after induction of anaesthesia, but before the onset of surgical stimulation. Changes in the EEG pattern in response to noxious stimulation need to be avoided as any change of the functional activity of the cerebral cortex may indicate conscious perception of pain (Prior 1987).
Relationship between changes in electroencephalogram variables and clinical signs in response to noxious stimulation
In a number of studies, a close relationship between changes in the EEG pattern and simultaneously recorded autonomic variables in response to noxious stimulation could be clearly demonstrated. EEG desynchronization or synchronization in humans and animals were associated with changes in clinical signs such as mydriasis, increases in systolic (SAP), mean arterial blood pressure (MAP) and/or heart rate (HR) during pentobarbital (Prince & Shanzer 1966), halothane (Oshima et al. 1981, Otto & Gerich 2001), alfentanil/N2O (Stanski et al. 1987), isoflurane (Bischoff et al. 1993, Otto & Mally 2003) or propofol (Inada et al. 1999) anaesthesia. For instance, EEG changes recorded in a dog (Figure 2) were accompanied by an 85% increase in MAP and a 100% increase in HR above pre-stimulation baseline values. In addition, Stanski et al. (1987) reported on increases in SEF and MF both before and during haemodynamic responses indicating a biphasic EEG response. However, when looking for simultaneous changes in EEG and haemodynamic variables, EEG arousal has been most frequently accompanied by an increase in SAP and MAP, while changes in HR may not always occur (Bischoff et al. 1993, Inada et al. 1999).
In contrast to these findings, a poor correlation between changes in EEG variables and clinical signs has been reported as well. Clinical studies conducted in human patients anaesthetized with isoflurane revealed no differences in the EEG pattern between subjects who made purposeful movements in response to incision and those who did not move (Dwyer et al. 1994, Kochs et al. 1999). This lack of correlation has been explained by the fact that anaesthetic depression of the cortical signal processing may not parallel anaesthetic depression of the afferent–efferent nociceptive reflex pathway and the autonomic nervous system at the spinal and subcortical sites. This assumption is supported by evidence from experimental studies in isoflurane-anaesthetized rats that were either deeply anaesthetized (Rampil & Laster 1992) or had a removal of the entire forebrain (Rampil et al. 1993). In both studies, movement response to noxious stimulation could be elicited despite a ‘functional decortication’ induced by isoflurane or after forebrain removal. Similarly, maintenance of leg withdrawal reflex despite EEG burst suppression was reported in another study where rats were anaesthetized with pentobarbital (Haberham et al. 1999) supporting the hypothesis that the brain may be more sensitive to anaesthetic effects than the spinal cord (Antognini & Carstens 1999, Rampil 2001).
Moreover, a poor correlation was also reported between simultaneously recorded EEG and haemodynamic variables during noxious stimulation. Marked increases in MAP and HR following both endotracheal intubation and surgical stimulation in patients anaesthetized with propofol and N2O were associated with an increase in SEF in only one out of six patients (White & Boyle 1989). In isoflurane-anaesthetized pigs, various types of noxious stimuli caused a significant increase in MAP, while changes in EEG variables were not significant (Haga et al. 2001). Again, it was concluded that autonomic haemodynamic responses may be more closely related to neurophysiological events in either the brainstem or spinal cord than to cortical events, which would more likely be reflected by changes in the EEG indices (White & Boyle 1989).
Afferent transmission of nociceptive impulses in awake subjects evokes nociceptive responses at various levels of the CNS. These responses include movement, changes in haemodynamic (HR, arterial blood pressure) and respiratory (rate, tidal ventilation, breathing pattern) variables, changes in pupil diameter and cortical arousal (Breazile & Kitchell 1969, Steffey 1983). During general anaesthesia, suppression of somatosensory responses can be achieved with blood concentrations of either intravenous or inhalation anaesthetics which are too low to suppress the motor and autonomic respiratory and haemodynamic responses (Prys-Roberts 1987). Moreover, even higher anaesthetic concentrations will be needed to suppress adrenergic responses (i.e. changes in HR, arterial blood pressure, pupil size) than for suppression of motor responses.
Therefore, movement and haemodynamic responses to surgical stimuli may still be maintained at levels of anaesthetic depth deep enough to produce pronounced cerebrocortical depression (i.e. burst suppression, isoelectricity) and therefore, deep enough to block conscious perception of pain. This ‘dissociation’ between cortical responses, on the one hand, and movement and cardiovascular responses to noxious stimulation, on the other hand, may be taken as support for the assumptions that general anaesthesia is the result of heterogenous actions of an anaesthetic at specific anatomical sites within the CNS (Rampil 2001) and that the brain is relatively more sensitive to anaesthetic actions than the spinal cord (Antognini & Carstens 1999). Moreover, this situation may be similar to that reported in brain-dead organ donors who are still able to respond to surgical stimuli by haemodynamic changes (Pennerfather et al. 1993).
In addition to the aforementioned QEEG variables, other approaches such as bispectral index (BIS) (Mi et al. 1998), approximate entropy (ApEn) (Sleigh & Donovan 1999), mid-latency auditory evoked potentials (AEPs) (Antognini & Wang 1999) and somatosensory evoked potentials (SSEPs) (Schwilden et al. 2005) have been advocated for the monitoring of anaesthesia. BIS and ApEn are also processed indices derived from raw EEG signal analysis. While MF and SEF extract frequency information from the EEG signal (Sleigh & Donovan 1999), BIS is composed of a combination of the time domain, frequency domain and higher-order spectral subparameters and incorporates the degree of phase-coupling between the component waves (Sigl & Chamoun 1994, Rampil 1998). A review of the development and use of bispectral analysis in anaesthesia has been published very recently by March and Muir (2005). ApEn quantifies the regularity of data-time series (Pincus et al. 1991). As with the median and SEF, contrasting reports exist on the value of information obtained from BIS. While dose-dependent changes in BIS values have been reported for increasing end-tidal concentrations of sevoflurane (Greene et al. 2002), isoflurane (Greene et al. 2003) or propofol (Martín-Cancho et al. 2006), contrasting results were also reported on the association between BIS and haemodynamic variables (Driessen et al. 1999, Kussman et al. 2001, Nakayama et al. 2003) suggesting no obvious advantages of BIS over traditionally used EEG power spectrum variables. AEPs and SSEPs, however, may provide additional information on anaesthetic depth because EEG, AEP and SSEP might represent different aspects of the changes in electrophysiological action on the CNS produced by general anaesthesia (Schwilden et al. 2005). Therefore, more studies comparing the different aspects of the various approaches will be needed for more detailed information.
Conclusion
During the past decades, anaesthetic and surgical techniques have evolved that make it more difficult to judge anaesthetic depth. Hence, objective measures of anaesthetic depth in addition to traditionally used clinical signs are needed in order to assure adequate depth of surgical anaesthesia. Commercially available EEG monitors provide some insight into the anaesthetic effect on individual patients and thus allow more precise anaesthetic administration. Numerous studies revealed that most anaesthetic agents cause similar EEG changes such as replacement of fast α and β rhythms by slow θ and δ rhythms during increasing depth of anaesthesia, occurrence of burst-suppression pattern during deep anaesthesia or isoelectricity at the deepest level. Although some issues still remain open including the facts that EEG monitoring can only work in the absence of factors liable to mimic overdose (e.g. hypoxia, haemodynamic instability, hypothermia) or that paradoxical arousal reactions could be falsely interpreted as a deepening of anaesthesia, EEG is the only means that allows a quantitative assessment of anaesthetics on the brain as the primary target organ during general anaesthesia.
References
1.
American Society of Anesthesiologists Task Force on Intraoperative Awareness (2006) Practice advisory for intraoperative awareness and brain function monitoring. Anesthesiology104, 847–64
2.
AngelA (1993) Central neuronal pathways and the process of anaesthesia. British Journal of Anaesthesia71, 148–63.
3.
AntogniniJF, SchwartzK (1993) Exaggerated anesthetic requirements in the preferentially anesthetized brain. Anesthesiology79, 1244–9.
4.
AntogniniJF, BergK (1995) Cardiovascular responses to noxious stimuli during isoflurane anesthesia are minimally affected by anesthetic action in the brain. Anesthesia and Analgesia81, 843–8.
5.
AntogniniJF, KienND (1995) Potency (minimum alveolar anesthetic concentration) of isoflurane is independent of peripheral anesthetic effects. Anesthesia and Analgesia81, 69–72.
6.
AntogniniJF, CarstensE (1999) Isoflurane blunts electroencephalographic and thalamic-reticular formation responses to noxious stimulation in goats. Anesthesiology91, 1770–9.
7.
AntogniniJF, WangXW (1999) Isoflurane indirectly depresses middle latency auditory evoked potentials by action in the spinal cord in the goat. Canadian Journal of Anesthesia46, 692–5.
8.
AntogniniJF, WangXW, CarstensE (1999) Quantitative and qualitative effects of isoflurane on movement occurring after noxious stimulation. Anesthesiology91, 1064–71.
9.
AntogniniJF, CarstensE (2005) Measuring minimum alveolar concentration. More than meets the tail (Editorial). Anesthesiology103, 679–80.
10.
AntunesLM, GolledgeHD, RoughanJV, FlecknellPA (2003a) Comparison of electroencephalogram activity and auditory evoked responses during isoflurane and halothane anaesthesia in the rat. Veterinary Anaesthesia and Analgesia30, 15–23.
11.
AntunesLM, RoughanJV, FlecknellPA (2003b) Effects of different propofol infusion rates on EEG activity and AEP responses in rats. Journal of Veterinary Pharmacology and Therapeutics26, 369–76.
12.
AntunesLM, RoughanJV, FlecknellPA (2003c) Excitatory effects of fentanyl upon the rat electroencephalogram and auditory-evoked potential responses during anaesthesia. European Journal of Anaesthesiology20, 800–8.
13.
ArduiniA, ArduiniMG (1954) Effect of drugs and metabolic alterations on brainstem arousal mechanism. Journal of Pharmacology and Experimental Therapeutics110, 76–85.
14.
Berg-JohnsenJ, LangmoenIA (1987) Isoflurane hyperpolarizes neurones in rat and human cerebral cortex. Acta Physiologica Scandinavica130, 679–85.
15.
BergamascoL, AccatinoA, PrianoL, Neiger-AeschbacherG, CizinauskasS, JaggyA (2003) Quantitative electroencephalographic findings in beagles anaesthetized with propofol. Veterinary Journal166, 58–66.
16.
BimarJ, BellvilleJW (1977) Arousal reactions during anesthesia in man. Anesthesiology47, 449–54.
17.
BischoffP, KochsE, DroeseD, Meyer-MoldenhauerWH, Schulteam EschJ (1993) Topographisch-quantitative EEG-Analyse der paradoxen Arousalreaktion. EEG-Veränderungen bei urologischen Eingriffen unter Isofluran-/N2O Narkose. Anaesthesist42, 142–8.
18.
BreazileJE, KitchellRL (1969) Pain perception in animals. Federation Proceedings28, 1379–82.
19.
BruhnJ, BouillonTW, RadulescuL, HoeftA, BertacciniE, ShaferSL (2003) Correlation of approximate entropy, bispectral index, and spectral edge frequency 95 (SEF95) with clinical signs of ‘anesthetic depth’ during coadministration of propofol and remifentanyl. Anesthesiology98, 621–7.
20.
CampagnaJA, MillerKW, FormanSA (2003) Mechanisms of actions of inhaled anesthetics. New England Journal of Medicine348, 2110–40.
21.
ChortkoffBS, GonsowskiCT, BennettHL. (1995a) Subanesthetic concentrations of desflurane and propofol suppress recall of emotionally charged information. Anesthesia and Analgesia81, 728–36.
22.
ChortkoffBS, EgerEIII, CrankshawDP, GonsowskiCT, DuttonRC, IonescuP (1995b) Concentrations of desflurane and propofol that suppress response to command in humans. Anesthesia and Analgesia81, 737–43.
23.
De BeerNAM, van HooffJC, CluitmansPJM, KorstenHHM, GroulsRJE (1996) Haemodynamic responses to incision and sternotomy in relation to auditory evoked potential and spontaneous EEG. British Journal of Anaesthesia76, 685–93
24.
DetschO, SchneiderG, KochsE, HapfelmeierG, WernerC (2000) Increasing isoflurane concentration may cause paradoxical increases in EEG bispectral index in surgical patients. British Journal of Anaesthesia84, 33–7.
25.
DriessenJJ, HarbersJB, van EgmondJ, BooijLH (1999) Evaluation of the electroencephalographic bispectral index during fentanyl-midazolam anaesthesia for cardiac surgery. Does it predict haemodynamic responses during endotracheal intubation and sternotomy?European Journal of Anaesthesiology16, 622–7.
26.
DunnetJM, Prys-RobertsC, HollandDE, BrowneBL (1994) Propofol infusion and the suppression of consciousness: dose requirements to induce loss of consciousness and to suppress response to noxious and non-noxious stimuli. British Journal of Anaesthesia72, 29–34.
27.
DwyerRC, RampilIJ, EgerEIII, BennetHL (1994) The electroencephalogram does not predict depth of isoflurane anesthesia. Anesthesiology81, 403–9.
28.
EappenS, KisinI (1998) Effect of subarachnoid bupivacaine block on anesthetic requirements for thiopental in rats. Anesthesiology88, 1036–42.
29.
EdmondsHLJr., PaloheimoM (1985) Computerized monitoring of the EMG and EEG during anesthesia: an evaluation of the anesthesia and brain activity monitor (ABM). Journal of Clinical Monitoring and Computing1, 201–10.
30.
EgerEIII, SaidmanLJ, BrandstaterB (1965) Minimum alveolar anesthetic concentration: a standard of anesthetic potency. Anesthesiology26, 756–63.
31.
EgerEIII, StevensWC, CromwellTH (1971) The electroencephalogram in man anesthetized with forane. Anesthesiology35, 504–8.
32.
EgerEIII, KoblinDD, HarrisRA. (1997) Hypothesis: inhaled anesthetics produce immobility and amnesia by different mechanisms at different sites. Anesthesia and Analgesia84, 915–18.
33.
FlecknellPA, HooperTL, FetherstonyG, LockeTJ, McGregorCG (1989) Long-term anaesthesia with alfentanil and midazolam for lung transplantation in the dog. Laboratory Animals23, 278–84.
34.
FlemingRA, SmithNT (1979) An inexpensive device for analyzing and monitoring the electroencephalogram. Anesthesiology50, 456–60.
35.
ForrestFC, TooleyMA, SaundersPR, Prys-RobertsC (1994) Propofol infusions and the suppression of consciousness: the EEG and dose requirements. British Journal of Anaesthesia72, 35–41.
36.
FreyeE, Dehnen-SeipelH, LataschL, BehlerM, Wilder-SmithOH (1999) Slow EEG-power spectra correlate with haemodynamic changes during laryngoscopy and intubation following induction with fentanyl or sufentanil. Acta Anaesthesiologica Belgica50, 71–6.
37.
GlassPS, BloomM, KearseL, RosowC, SebelP, ManbergP (1997) Bispectral analysis measures sedation and memory effects of propofol, midazolam, isoflurane, and alfentanil in healthy volunteers. Anesthesiology86, 836–47.
38.
GolovchinskyVB, PlehotkinaSI (1971) Difference in the sensitivity of the cerebral cortex and midbrain reticular formation to the action of diethyl ether and thialbarbital. Brain Research30, 37–47.
39.
GreeneSA, BensonGJ, TranquilliWJ, GrimmKA (2002) Relationship of canine bispectral index to multiples of sevoflurane minimal alveolar concentration, using patch or subdermal electrodes. Comparative Medicine52, 424–8.
40.
GreeneSA, TranquilliWJ, BensonGJ, GrimmKA (2003) Effects of medetomidine administration on bispectral index measurements in dogs during anesthesia with isoflurane. American Journal of Veterinary Research64, 316–20.
41.
GuéritJM (1998) Neuromonitoring in the operating room: why, when, and how to monitor?Electroencephalography and Clinical Neurophysiology106, 1–21.
42.
GuginoLD, ChabotRJ, PrichepLS, JohnER, FormanekV, AglioLS (2001) Quantitative EEG changes associated with loss and return of consciousness in healthy adult volunteers anaesthetized with propofol or sevoflurane. British Journal of Anaesthesia87, 421–8.
43.
GuginoLD, AglioLS, Yli-HankalaA (2004) Monitoring the electroencephalogram during bypass procedures. Seminars in Cardiothoracic and Vascular Anesthesia8, 61–83.
44.
HaberhamZL, van den BromWE, Venker-van HaagenAJ, BaumansV, de GrootHN, HellebrekersLJ (1999) EEG evaluation of reflex testing as assessment of depth of pentobarbital anaesthesia in the rat. Laboratory Animals33, 47–57.
45.
HagaHA, MoerchH, SoliNE (2000) Effects of intravenous infusion of guaifenesin on electroencephalographic variables in pigs. American Journal of Veterinary Research61, 1599–601.
46.
HagaHA, TevikA, MoerchH (2001) Electroencephalographic and cardiovascular indicators of nociception during isoflurane anaesthesia in pigs. Veterinary Anaesthesia and Analgesia28, 126–31.
47.
HudsonRJ, StanskiDR, SaidmanLJ, MeatheE (1983) A model for studying depth of anesthesia and acute tolerance to thiopental. Anesthesiology59, 301–8.
48.
HughesJR, JohnER (1999) Conventional and quantitative electroencephalography in psychiatry. Journal of Neuropsychiatry and Clinical Neurosciences11, 190–208.
49.
InadaT, ShinguK, NakaoS, HiroseT, NagataA (1999) Electroencephalographic arousal response during tracheal intubation and laryngeal mask airway insertion after induction of anaesthesia with propofol. Anaesthesia54, 1150–4.
50.
JinksSL, CarstensE, AntogniniJF (2004) Isoflurane differentially modulates medullary on and off neurons while suppressing hind-limb motor withdrawals. Anesthesiology100, 1224–34.
51.
JohnER (2001) A field theory of consciousness. Consciousness and Cognition10, 184–213.
52.
JohnER, PrichepLS, KnoxW. (2001) Invariant reversible QEEG effects of anesthetics. Consciousness and Cognition10, 165–83.
53.
JohnER, PrichepLS (2005) The anesthetic cascade. A theory of how anesthesia suppresses consciousness. Anesthesiology102, 447–71.
54.
JohnsonCB, YoungSS, TaylorPM (1994) Analysis of the frequency spectrum of the equine electroencephalogram during halothane anaesthesia. Research in Veterinary Science56, 373–8.
55.
JohnsonCB, TaylorPM (1998) Comparison of the effects of halothane, isoflurane and methoxyflurane on the electroencephalogram of the horse. British Journal of Anaesthesia81, 748–53.
56.
KaadaBR, ThomasF, AlnaesE, WesterK (1967) EEG synchronization induced by high frequency midbrain reticular stimulation in anesthetized cats. Electroencephalography and Clinical Neurophysiology22, 220–30.
57.
KaiedaR, ToddMM, WarnerDS (1989) The effects of anesthetics and PaCO2 on the cerebrovascular, metabolic, and electroencephalographic responses to nitrous oxide in the rabbit. Anesthesia and Analgesia68, 135–43.
58.
KearseLAJrRosowC, ZaslavskyA, ConnorsP, DershwitzM, DenmanW (1998) Bispectral analysis of the electroencephalogram predicts conscious processing of information during propofol sedation and hypnosis. Anesthesiology88, 25–34.
59.
KendigJJ (1993) Spinal cord as a site of anesthetic action (Editorial). Anesthesiology79, 1161–2.
60.
KierseyDK, BickfordRG, FaulconerAJr (1951) Electroencephalographic patterns produced by thiopental sodium during surgical operations: description and classification. British Journal of Anaesthesia23, 141–52.
61.
KingBS, RampilIJ (1994) Anesthetic depression of spinal motor neurons may contribute to lack of movement in response to noxious stimuli. Anesthesiology81, 1484–92.
62.
KishimotoI, KadoyaC, SneydR, SamraSK, DominoEF (1995) Topographic electroencephalogram of propofol-induced conscious sedation. Clinical Pharmacology and Therapeutics58, 666–74.
63.
KiyamaS, TakedaJ (1997) Effect of extradural analgesia on the paradoxical arousal response of the electroencephalogram. British Journal of Anaesthesia79, 750–3.
64.
KochsE, BischoffP, PichlmeierU, Schulte am EschJ (1994) Surgical stimulation induces changes in brain electrical activity during isoflurane/nitrous oxide anesthesia. A topographic electroencephalographic analysis. Anesthesiology80, 1026–34.
65.
KochsE, KalkmanCJ, ThorntonC. (1999) Middle latency auditory evoked responses and electroencephalographic derived variables do not predict movement to noxious stimulation during 1 minimum alveolar concentration isoflurane/nitrous oxide anesthesia. Anesthesia and Analgesia88, 1412–17.
66.
KodakaM, JohansenJW, SebelPS (2005) The influence of gender on loss of consciousness with sevoflurane or propofol. Anesthesia and Analgesia101, 377–81.
67.
KuramotoT, OshitaS, TakeshitaH, IshikawaT (1979) Modification of the relationship between cerebral metabolism, blood flow, and electroencephalogram by stimulation during anesthesia in the dog. Anesthesiology51, 211–17.
68.
KussmanBD, GruberEM, ZurakowskiD, HansenDD, SullivanLJ, LaussenPC (2001) Bispectral index monitoring during infant cardiac surgery: relationship of BIS to the stress response and plasma fentanyl levels. Paediatric Anaesthesia11, 663–9.
69.
LevyWL, ShapiroHM, MaruchakG, MeatheE (1980) Automated EEG processing for intraoperative monitoring: a comparison of techniques. Anesthesiology53, 223–36.
70.
LevyWJ (1986) Power spectrum correlates of changes in consciousness during anesthetic induction with enflurane. Anesthesiology64, 688–93.
71.
MarchPA, MuirWW (2005) Bispectral analysis of the electroencephalogram: a review of its development and use in anesthesia. Veterinary Anaesthesia and Analgesia32, 241–55.
72.
Martín-CanchoMF, LimaJR, LuisL. (2003) Bispectral index, spectral edge frequency 95%, and median frequency recorded for various concentration of isoflurane and sevoflurane in pigs. American Journal of Veterinary Research64, 866–3.
73.
Martín-CanchoMF, LimaJR, LuisL, CrisóstomoV, Carrasco-JiménezMS, Usón-GargalloJ (2006) Relationship of bispectral index values, haemodynamic changes and recovery times during sevoflurane or propofol anaesthesia in rabbits. Laboratory Animals40, 28–42.
74.
MiW-D, SakaiT, TakahashiS, MatsukiA (1998) Haemodynamic and electroencephalographic responses to intubation during induction with propofol or propofol/fentanyl. Canadian Journal of Anaesthesia45, 19–22.
75.
MichenfelderJD, TheyeRA (1975) In vivo toxic effects of halothane on canine cerebral metabolic pathways. American Journal of Physiology229, 1050–5.
76.
MoruzziG, MagounHW (1949) Brain stem reticular formation and activation of the EEG. Electroencephalography and Clinical Neurophysiology1, 455–73.
77.
MurrelJC, JohnsonCB, WhiteKL, TaylorPM, HaberhamZL, Waterman-PearsonAE (2003) Changes in the EEG during castration in horses and ponies anaesthetized with halothane. Veterinary Anaesthesia and Analgesia30, 138–46.
78.
MyersRR, StockardJJ, FlemingNI, FranceCJ, BickfordRG (1973) The use of on-line telephonic computer analysis of the EEG in anaesthesia. British Journal of Anaesthesia45, 664–70.
79.
NakayamaM, KanayaN, EdanagaM, NamikiA (2003) Hemodynamic and bispectral index responses to tracheal intubation during isoflurane or sevoflurane anesthesia. Journal of Anesthesia17, 223–6.
80.
NewbergLA, MildeJH, MichenfelderJD (1983) The cerebral metabolic effects of isoflurane at and above concentrations that suppress cortical electrical activity. Anesthesiology59, 23–8.
81.
OshimaE, ShinguK, MoriK (1981) EEG activity during halothane anaesthesia in man. British Journal of Anaesthesia53, 65–72.
82.
OttoK, ShortCE (1991) Electroencephalographic power spectrum analysis as a monitor of anesthetic depth in horses. Veterinary Surgery20, 362–71.
83.
OttoKA, VoigtS, PiepenbrockS, DeegenE, ShortCE (1996) Differences in quantitated electroencephalographic variables during surgical stimulation of horses anesthetized with isoflurane. Veterinary Surgery25, 249–55.
84.
OttoKA, WeberBP, JacobiM, HedrichH-J (1997) Retrospective evaluation of cardiopulmonary and acid-base variables during long-term balanced anesthesia for experimental surgery in dogs. Laboratory Animal Science47, 624–31.
85.
OttoKA, GerichT, VolmertC (2000) Hemodynamic and electroencephalographic effects of epidural buprenorphine during orthopedic hindlimb surgery in sheep: a comparison with intramuscular buprenorphine and epidural saline. Journal of Experimental Animal Science41, 121–32.
86.
OttoKA, GerichT (2001) Comparison of simultaneous changes in electroencephalographic and haemodynamic variables in sheep anaesthetised with halothane. Veterinary Record149, 80–4.
87.
OttoKA, MallyP (2003) Noxious stimulation during orthopaedic surgery results in EEG ‘arousal’ or ‘paradoxical arousal’ reaction in isoflurane-anaesthetised sheep. Research in Veterinary Science75, 103–12.
88.
PennerfatherSH, DarkJH, BullockRE (1993) Haemodynamic responses to surgery in brain-dead organ donors. Anaesthesia48, 1034–8.
89.
PichlmayrI, LipsU (1980) Halothane-Effekte im Elektroenzephalogramm. Anaesthesist29, 530–8.
90.
PichlmayrI, LipsU, KünkelH (1983) Das Elektroenzephalogramm in der Anästhesie.Berlin: Springer-Verlag, 12–157
91.
PincusSM, GladstoneIM, EhrenkrankRA (1991) A regularity statistic for medical data analysis. Journal of Clinical Monitoring and Computing7, 335–45.
92.
PrinceDA, ShanzerS (1966) Effects of anesthetics upon the EEG response to reticular stimulation. Patterns of slow synchrony. Electroencephalography and Clinical Neurophysiology21, 578–88.
93.
PriorPF (1987) The EEG and detection of responsiveness during anaesthesia and coma. In: Consciousness, Awareness and Pain in General Anaesthesia (RosenM, LunnJN, eds). London: Butterworths, 34–45
94.
Prys-RobertsC (1987) Anaesthesia: a practical or impossible construct? (Editorial). British Journal of Anaesthesia59, 1341–5.
95.
RampilIJ, SasseFJ, SmithNT, HoffBH, FlemmingDC (1980) Spectral edge frequency: a new correlate of anesthetic depth (abstract). Anesthesiology53, S12
96.
RampilIJ, LasterMJ (1992) No correlation between quantitative electroencephalographic measurements and movement response to noxious stimuli during isoflurane anesthesia in rats. Anesthesiology77, 920–25.
97.
RampilIJ, MasonP, SinghH (1993) Anesthetic potency (MAC) is independent of forebrain structures in the rat. Anesthesiology78, 707–12.
98.
RampilIJ (1994) Anesthetic potency is not altered after hypothermic spinal cord transection in rats. Anesthesiology80, 606–10.
RoizenMF, HorriganRW, FrazerBM (1981) Anesthetic doses blocking adrenergic (stress) and cardiovascular responses to incision - MAC BAR. Anesthesiology54, 390–8.
104.
RosenM, LunnJN (1987) Consciousness, Awareness and Pain in General Anaesthesia.London: Butterworths, 186–92
105.
SandinRH, EnlundG, SamuelssonP, LennmarkenC (2000) Awareness during anaesthesia: a prospective case study. Lancet355, 707–11.
106.
SchwenderD, DaundererM, MulzerS, KlasingS, FinstererU, PeterK (1996) Spectral edge frequency of the electroencephalogram to monitor ‘depth’ of anaesthesia with isoflurane or propofol. British Journal of Anaesthesia77, 179–84.
107.
SchwenderD, DaundererM, KlasingS, FinstererU, PeterK (1998) Power spectral analysis of the electroencephalogram during increasing end-expiratory concentrations of isoflurane, desflurane and sevoflurane. Anaesthesia53, 335–42.
108.
SchwildenH, StoeckelH (1980) Untersuchungen über verschiedene EEG-Parameter als Indikatoren des Narkosezustands. Der Median als quantitatives Maß der Narkosetiefe. Anästhesie, Intensivtherapie, Notfallmedizin15, 279–86.
109.
SchwildenH, StoeckelH (1987) Quantitative EEG analysis during anaesthesia with isoflurane in nitrous oxide at 1.3 and 1.5 MAC. British Journal of Anaesthesia59, 738–45.
110.
SchwildenH, StoeckelH, SchüttlerJ (1989) Closed-loop feedback control of propofol anaesthesia by quantitative EEG analysis in humans. British Journal of Anaesthesia62, 290–6.
111.
SchwildenH, KochsE, DaundererM. (2005) Concurrent recording of AEP, SSEP and EEG parameters during anaesthesia: a factor analysis. British Journal of Anaesthesia95, 197–206.
112.
ScottJC, PonganisKV, StanskiDR (1985) EEG quantification of narcotic effect: the comparative pharmacodynamics of fentanyl and alfentanil. Anesthesiology62, 234–41.
113.
ScottJC, CookeJE, StanskiDR (1991) Electroencephalographic quantification of opioid effect: the comparative pharmacodynamics of fentanyl and sufentanil. Anesthesiology74, 34–42.
114.
SiglJC, ChamounNC (1994) An introduction to bispectral analysis for the electroencephalogram. Journal of Clinical Monitoring and Computing10, 392–404.
115.
SleighJW, DonovanJ (1999) Comparison of bispectral index, 95% spectral edge frequency and approximate entropy of the EEG, with changes in heart rate variability during induction of general anaesthesia. British Journal of Anaesthesia82, 666–71.
116.
StanskiDR, VuykJ, AusemsM, ArtsR, KramerC, SpierdijkJ (1987) Can the EEG be used to monitor anesthetic depth for alfentanil with N2O? (Abstract). Anesthesiology67, A401
117.
SteffeyEP, GillespieJR, BerryJD, EgerEIII, RhodeEA (1975) Circulatory effects of halothane and halothane-nitrous oxide in the dog: spontaneous ventilation. American Journal of Veterinary Research36, 197–200.
118.
SteffeyEP, HowlandDJr (1977) Isoflurane potency in the dog and cat. American Journal of Veterinary Research38, 1833–6.
119.
SteffeyEP (1983) Concepts of general anesthesia and assessment of adequacy of anesthesia for animal surgery. In: Animal Pain (KitchellRL, EricksonHH, eds). Bethesda, MD: American Physiological Society, 133–50
120.
SteriadeM (1996) Arousal: revisiting the reticular activating system. Science272, 225–6.
121.
TinkerJH, SharboroughFW, MichenfelderJD (1977) Anterior shift of the dominant EEG rhythm during anesthesia in the Java monkey: correlation with anesthetic potency. Anesthesiology46, 252–9.
122.
TooleyMA, GrantLJ, DaviesAR (1984) A microprocessor based instrument for the spectral analysis of the EEG in anaesthesia. Clinical Physics and Physiological Measurement5, 303–11.
123.
WalterDO (1987) Introduction to computer analysis in electroencephalography. In: Electroencephalography: Basic Principles, Clinical Applications, and Related Fields.2nd edn (NiedermeyerE, Lopes da SilvaF, eds). Baltimore: Urban and Schwarzenberg, 863–70
124.
WeidemannH, MüllerKM, HennigE, MeisslerM, BücherlES (1990) Experience with vascular graft in total artificial heart replacement. International Journal of Artificial Organs13, 288–92.
125.
WhitePF, BoyleWA (1989) Relationship between hemodynamic and electroencephalographic changes during general anesthesia. Anesthesia and Analgesia68, 177–81.