
Abstract
The Quality Assurance Program (QAP) of the Deutsches Krebsforschungszentrum (DKFZ) was a proficiency testing system developed to service the laboratory animal discipline. The QAP comprised the distribution of bacterial strains from various species of animals for identification to species level and antibiotic susceptibility testing (AST). Identification capabilities were below acceptable standards. This study evaluated AST results using the DKFZ compilations of test results for all bacterial strains showing the number of participants reporting the strain as resistant (R), sensitive (S) or intermediate susceptible (I) to each antibiotic substance used. Due to lack of information about methods used, it was assumed that what the majority of the participants reported (R or S) was the correct test result and that an opposite result was a major error (ME). MEs occurred in 1375 of 14,258 (9.7%) of test results and ME% ranged from 0% to 23.2% per bacterial group–agent group combination. Considerable variation in MEs was found within groups of bacteria and within groups of agents. In addition to poor performance in proper species classification, the quality of AST in laboratory animal diagnostic laboratories seems far below standards considered acceptable in human diagnostic microbiology.
Keywords
The Quality Assurance Program (QAP) of the Deutsches Krebsforschungszentrum (DKFZ, Dr Werner Nicklas) was a proficiency testing system developed to service the laboratory animal field. The QAP comprised the quarterly distribution of two bacterial strains originating from various species of animal for identification to the species level and antibiotic susceptibility testing (AST).
In 2007 we compared the identification results reported by QAP participants over the years 1996–2004 with those obtained by the Dutch Bacterial Diagnostics reference laboratory, the only participant that used genetically-based methods for identification. We found that the capabilities of laboratory animal diagnostic laboratories to correctly identify bacterial species was considerably below what is considered acceptable for human diagnostic laboratories. 1
The outcome of the AST over the same period is now reported.
Identification results were available for 71 bacterial strains and a fungus. In the present study the outcome of AST of five of the 72 strains was omitted. In QAP distribution no. 24, the same outcome was reported for Staphylococcus cricetus and CDC EF4a, suggesting an error in record keeping; in QAP distribution no. 26 results of European laboratories could not be separated from those from the USA; and the one strain of QAP distribution no. 42 was omitted, being a fungus. As a consequence AST results on 66 bacterial strains remained.
The bacteria comprised of Gram-positive rods (n = 6) and cocci (n = 21) and Gram-negative rods (n = 38) and a coccus (n = 1). Where possible the bacteria were grouped in bacterial families containing at least three strains. According to their Gram stain characteristics and morphology, the remaining bacteria were assigned to the groups ‘other Gram-negative rods’, ‘other Gram-positive cocci’ and ‘other Gram-positive rods’. In this way 11 groups were formed. The number of strains per group ranged from one (the Gram-negative Neisseria) to 21 (Enterobacteriaceae).
The AST results for each strain were compiled by Dr Nicklas in a list showing the number of participants reporting the strain as resistant (R), sensitive (S) or intermediate susceptible (I) to each antibiotic substance used. All data were included in an Excel file which was used for calculations. The 66 strains included in this study were numbered one to 66.
Antimicrobial substances
During the study period 1996–2004, the participating laboratories reported the use of 43 antimicrobial agents.
Piperacillin, naladixic acid, ofloxacin, metronidazole and spectinomycin were only rarely used and results obtained with these five agents were omitted from calculations.
It was possible so far to group the remaining 38 substances according to their mode of action in nine groups comprising aminoglycosides (n = 6: amikacin, gentamycin, kanamycin, neomycin, streptomycin and tobramycin), beta-lactam antibiotics (n = 11: amoxicillin, amoxicilin/clavulanic acid, ampicillin, bacitracin, carbenicillin, imipenem, oxacillin, penicillin, ticarcillin, cefotaxim and cephalotin), glycopeptides (n = 1: vancomycin), inhibitors of folic acid synthesis (n = 3: co-trimoxazole, sulfonamide and trimethoprim-sulfamethoxazole); lincosamides (n = 2: clindamycin and lincomycin), macrolides (n = 3: erytromycin, spiramycin and tylosin), polymixines (n = 2: colistin and polymixin B), quinolones (n = 2 ciprofloxacin and enrofloxacin) and tetracyclines (n = 3: doxycycline, oxytetracycline and tetracycline). The remaining five agents were included in the 10th rest group comprising chloramphenicol, fucidine, nitrofurantoin, novobiocin and rifampicin. The number of antimicrobials per group ranged from 1 (vancomycin) to 11 (beta-lactam antibiotics).
Laboratories did not provide information regarding the methods used and no information was available regarding which strains were studied by specific laboratories. It must be assumed that most laboratories would have used so-called disc methods, and some may have had minimum inhibitory concentrations (MICs). However, this lack of information meant that only overall results could be described and that it was impossible to evaluate the data for possible statistically significant differences, for instance between participants, methods, groups of bacteria and antibiotic substances.
Each test of the susceptibility of a bacterial strain for an antimicrobial substance yields an individual test outcome which obviously may be scored as either R, S or I. It has been assumed that what the majority of the participants reported is the correct test result, as there is no alternative. If the majority reports a bacterium R or S for a given substance, I results are acceptable. Where bacterium–antimicrobial combinations yielded a majority of I results or an equal number of S and R outcomes, a majority was created by addition of the number of I to either the number of R or S (so R + I > S or S + I > R). The opposite outcome (S and R, respectively) reported by the minority was then considered a ‘major error’ (ME). The total number of test results reported from the use of the 38 agents and 66 bacteria was 14,258.
For each bacterium–antimicrobial combination it may be expected that the lower the number of AST test results the more likely it will be to have no MEs. Conversely, the likelihood of finding disagreement in test results between laboratories increases with the number of test results (data not shown; correlation not calculated).
The ME percentages were classified and, although this may seem arbitrarily, 10% MEs means that one in 10 test results deviates from what was reported by the majority; with 20% and 33.3% MEs one in five and one in three test results, respectively, deviates from the correct test result.
I counted 1375 MEs among 14,258 test results (9.7%). Table 1 shows the ME rates for each of the 11 groups of bacteria and the 10 groups of antimicrobial substances. The ME% ranged from 0 to 23.2. Percentages exceeding 20 were found in seven of 11 groups of bacteria (range of averages 6.7–16.6) and with six of 10 groups of antibacterial substances (range of averages 4–15). Figure 1 shows the average ME% calculated for all successively distributed 66 bacterial strains.
Percentage of major errors in antimicrobial susceptibility testing of 66 bacterial strains successively distributed under the Deutsches Krebsforschungszentrum Quality Assurance Program (1996–2004) Percentage major errors (MEs) in testing susceptibility of 66 bacterial strains for antimicrobial agents Am: aminoglycosides (n = 6); β-L Bacteria grouped in families comprising ≥3 strains or according to Gram stain characteristics. Antimicrobials grouped according to mode of activity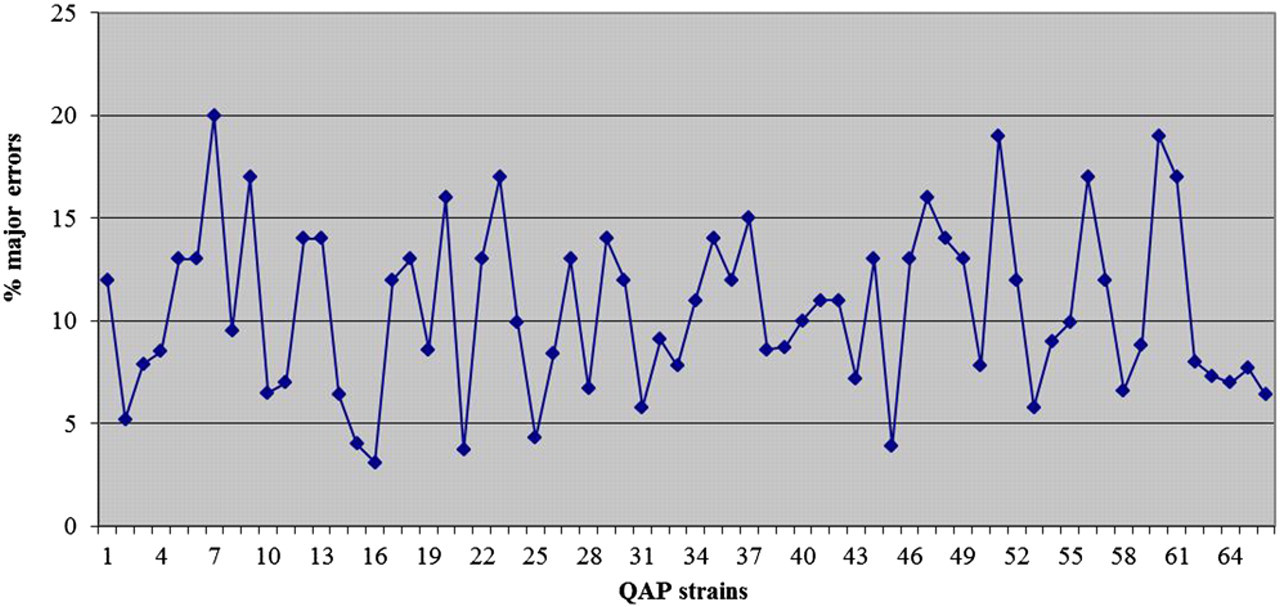
Percentage major errors (MEs) in testing susceptibility of 66 bacterial strains for six aminoglycosides
Differences in the outcome of AST of bacteria have been reported. 2,3 Discrepancies in findings between laboratories have motivated improvement through the publication of standards and guidelines for AST and interpretation of results.
A series of recommendations has been issued by the Clinical and Laboratory Standards Institute (CLSI), 4 as a successor to the (US) National Committee for Clinical Laboratory Standards (NCCLS). Other recommendations, however, exist. 5
The CLSI guidelines provide guidance on the most relevant drugs to test and report on specific organisms, quality control ranges to assure accurate and reproducible results, and interpretative criteria or breakpoints to interpret MICs and disc diffusion zones. The most widely used CLSI recommendations are those for disc diffusion tests (M2) 6 and for the determination of MICs (M7) 7 of various drugs. The CLSI issues cover a wide variety of bacterial species including infrequently isolated and fastidious bacteria. 8 Guideline M37 (version 3) 9 issued in 2008 deals with antimicrobial substances used in the veterinary field. It is unclear whether the laboratory animal diagnostic laboratories that participated in the QAP followed such recommendations.
The data show that AST of bacteria by laboratory animal diagnostic laboratories may frequently yield conflicting results. If most laboratories report a bacterium S to a given antimicrobial agent, an opposite test result (R) should be considered an ME. The percentage of MEs appeared to be about 10, and in various bacteria–antimicrobial combinations tested ME% were above 20. Based on ME percentages (Figure 1) the capability of participating laboratories in AST did not improve over time. According to CLSI recommendation M23A 10 the ME rate should not exceed 3.5%. AST has several pitfalls and an analysis of recently published articles revealed a number of frequently occurring shortcomings in AST of animal bacterial strains, which may have an impact either directly on the quality of the results obtained or on the conclusions drawn. 11
We reported earlier that laboratory animal diagnostic laboratories showed poor performance in proper species classification of bacterial strains. 1 The present evaluation indicates that the quality of AST by laboratory animal diagnostic laboratories participating in the DKFZ-QAP over the period 1996–2004 was also far below standards considered acceptable in human diagnostic microbiology.
In the last 10–15 years, several automated instruments have been developed for identification and AST of bacterial strains considered relevant in human and veterinary infections. 12,13 Their advantages comprise ease of use, reduction of work load and standardization of reading test results. A major disadvantage of all systems is that they require the manual preparation of inocula and inoculation of test panels. Inoculum size has been found to be a primary determinant of the accuracy of AST by the Vitek system. 14 It is unclear to which extent automated instruments are presently used by laboratory animal diagnostic laboratories. Unfortunately, DKFZ-QAP was terminated in 2004. Today the only proficiency testing system to service the laboratory animal discipline is the Performance Evaluation Program (PEP) for Diagnostic Laboratories established in 2006 by ICLAS. 15 The PEP does not however include AST, so no more recent data are available than those summarized here. Until new data are published, one should be concerned by the limited capabilities of laboratory animal diagnostic laboratories in AST of bacteria.