
Abstract
Intracerebroventricular (ICV) route of administration is a useful experimental method to study the effects of chemicals or cellular grafts in the ventricular compartment of the brain after focal ischaemia. However, the induced oedema may cause structural dislocating phenomena and render a stereotaxic ICV invasion difficult and practically unavailable especially during the acute post-ischaemia phase. The aim of this study was to measure these structural ventricular dislocations and set new stereotaxic coordinates for successful and cost-effective ICV invasion 6–18 h after focal cerebral ischaemia. Wistar rats were subjected to 2 h middle cerebral artery occlussion (t-MCAO), were neurologically evaluated (modified Neurological Stroke Scale [mNSS], modified Bederson's Scale [mBS] and grid-walking test [GWT]) and brain slides were studied at 6 and 18 h post-occlusion for infarction volume, hemispheric oedema, middle line dislocation and stereotaxia of the lateral ventricles. Our data indicated that stereotaxic coordinates of the lateral ventricles in the infarcted and contralateral hemispheres significantly (P < 0.05) changed at both time-points and were linearly correlated with the mNSS, mBS and some GWT scores (P < 0.001). This correlation allowed for the calculation of simple (linear) mathematical equations (stereotaxic coordinate = b0 + b1*mNSS, where ‘b0’ and ‘b1’ are fixed number and factor, respectively, calculated by regression analysis) that determined individually new coordinates for each animal. Verification experiments revealed that the new coordinates render ICV invasion feasible in up to 80% of infarcted rats (number needed to treat 1.65), compared with only 19.4% using the classical coordinates for normal rats. Therefore, we propose a new, time- and cost-effective methodology for practically feasible ICV invasion in rats 6–18 h after t-MCAO.
Keywords
Experimental models of ischaemic stroke apply various types of arterial occlusion with different impact on infarct volume, brain oedema and neurological and behavioural outcomes. Among the models used, temporary middle cerebral artery occlusion (MCAO) with reperfusion is considered to be the most commonly used. 1–4
Recently, various novel experimental therapies for ischaemic stroke have been tested, with the intravenous and selective intraarterial routes being the most rationale. 5,6 Nevertheless, the stereotaxic intracerebroparenchymal and intracerebroventricular (ICV) routes are also used to directly administer chemicals or cellular grafts into the brain and further study their effect in the parenchyma or ventricular compartment respectively. 7,8 Importantly, the ICV route has been widely used as a practical approach in pre- or late-treatment protocols, 8–13 but its use is limited at the crucial time window of acute stroke. 11,14 One possible explanation is the acute cytotoxic and vasogenic hemispheric oedema after ischaemic stroke, 15,16 which creates pressure effect phenomena in the brain, 16 leading to structural displacements of various severity.
The purpose of the present study was to evaluate the stereotaxia of the ventricular system in acute ischaemic stroke, in order to apply an efficient and reliable ICV invasion at the oedematous post-infarcted brain. We induced a transient 2 h MCAO model known to result in large and often lethal ischaemic stroke in Wistar rats, 4,16–19 and we sacrificed the animals at 6 and 18 h post-occlusion to study the ventricular coordinates. We sought to clarify whether it was possible to predict the new, modified, ventricular stereotaxic coordinates through the neurological scores of the animals and achieve successful ICV invasion, regardless of stroke severity, at this time-window.
Materials and methods
Animal handling and groups
Male adult Wistar rats (n = 51) of various age (4–10 months) and weight (342–476 g) were purchased from the Hellenic Pasteur Institute (Athens, Greece) and housed in the animal facility of the B' Neurology Department, AHEPA University Hospital, Thessaloniki, Greece. The facility was comprised of an acclimatized windowless indoor room, with light/dark conditions 12:12 h, relative humidity between 40–50% and environmental temperature between 22–24°C. Rats were fed a regular diet and given tap water ad libitum. All experimental procedures were conducted according to institutional guidelines, in compliance with Greek regulations and the European Communities Council Directive of 24 November 1986 (86/609/EEC).
Animals that underwent focal cerebral ischaemia (MCAO) were randomly sacrificed at two time-points: group A (n = 22) at 6 h and group B (n = 24) at 18 h post-ischaemia. Each of groups A and B was comprised of two subgroups: Ac (n = 17) and Bc (n = 19), respectively, which were used for calculations related to the post-ischaemic ventricular dislocations and Av (n = 5) and Bv (n = 5), respectively, which were used for experimental verification of the new stereotaxic coordinates following ischaemia. In addition, five naïve Wistar rats (group N) were used to demonstrate the stereotaxic ICV invasions in normal animals, applying the coordinates described in the section ‘Stereotaxic injections – marking of the lateral ventricles’.
Some animals of subgroup Bc (5/19) with severe ischaemic stroke (modified Neurological Stroke Scale [mNSS] ≥ 12), presenting a moribund state, were anaesthetized with diethyl-ether and were humanely sacrificed 2–3 h earlier. These animals were found to have severe oedema and pressure effect phenomena and were included in the studies of ventricular shift.
Experimental procedures
Focal cerebral ischaemia with reperfusion was induced using the MCAO model, as previously described in detail. 4 Animals that underwent focal cerebral ischaemia were anaesthetized with 4% halothane in a mixture of 70% N2O and 30% O2, were orally intubated and anaesthesia was maintained with 1.5% halothane in the same mixture using mechanical ventilation. Rectal temperature, mean arterial blood pressure, arterial blood gases, plasma glucose and haematocrit values were monitored as previously described in detail. 4 The right MCAO was induced by insertion of a 5–0 modified poly-L-lysine-coated Koizumi suture that occluded the right MCA stem. Reperfusion was allowed 2 h later by suture withdrawal and animals were closely monitored postoperatively.
Stereotaxic injections – marking of the lateral ventricles
Just prior to sacrifice, animals were re-anaesthetized as described above, immobilized on a stereotaxic device (Stoelting Lab Standard Stereotaxic Instrument with rat adaptor), and the skin between the ears was shaved and carefully cleaned with an alcoholic antiseptic solution. A longitudinal incision revealed the skull bones, the skin and underlying tissues were retracted and bregma was recognized as the ‘zero’ point for all stereotaxic coordinates.
ICV injections of 5 µL trypan blue were performed in both lateral ventricles at two sets of coordinates, according to the Paxinos and Watson rat brain atlas 20 for the Ac, Bc and N animals: for the right or left ventricle, at anteroposterior (AP) = −0.12 mm, mediolateral (ML) = 1.6 mm, dorsoventricular (DV) = 4.3 mm (first set) and at AP = −1.0 mm, ML = 2.4 mm, DV = 4.0 mm (second set). The injection needle remained in place for an additional 5 min, the anaesthetized animals were euthanized and their brains were processed as described in ‘tissue processing’. Using this approach we managed to have two blue needle traces in each hemispheric side of the Ac, Bc and N animals as index marks of the ‘theoretical’ ICV injection sites. These marks were used to calculate the AP displacement as described below.
Neurological and motor testing
All group A and B animals were examined at 6 and 18 h post-occlusion using: (1) the well-established 18-grade mNSS, 21 (2) the 7-grade modified Bederson's Scale (mBS) 4 and (3) the grid walking test (GWT). 22 Videos of GWT were studied using the Adobe Premier 1.5 software to calculate the percent fault steps for each of the 4 limbs of the animals.
Tissue processing
All animals (groups A, B and N) were sacrificed under deep halothane anaesthesia immediately after stereotaxic injections. Brains were quickly removed, placed within a rat brain mold and kept at −20°C for 3–4 min to harden. Coronal sections of 1 mm were cut and placed in a glass Petri dish in 2% 2,3,5-triphenyltetrazolium chloride (TTC) solution at 37°C for 30 min. After the incubation, the extra TTC solution was carefully collected and the sections were left to gain their natural dimensions within the remaining solution. The Petri dish (and the sections within it) was scanned at 600 dpi and analysis of the images was performed using the ImageJ software 1.34 s. 4,23
Calculation of infarction and oedema volumes
Infarction volume was calculated as previously described in detail 4 and was expressed as a percentage (‘% hemispheric infarction volume’, %V inf). Calculation of %V inf was performed in order to verify the induction of ischaemia and have a rough estimate of the infarction. Oedema of the infarcted hemisphere was also calculated as previously described in detail 4 and was also expressed as a percentage (‘% oedema of the infarcted hemisphere’, %HE).
Post-ischaemic ventricular dislocation – related calculations
In order to study the post-ischaemic ventricular dislocations in animals of subgroups Ac and Bc, the following parameters were calculated: (1) dimensions of the lateral ventricles, using values such as slide diameter (D max), distances (D 1−4, D R) and depths (d1, d2) as shown in Figure 1; (2) % middle line dislocation (mlD), using values (D max and D R) shown in Figure 1 and (3) optimal site (S) for stereotaxic invasion in each lateral ventricle (S R and S L for right and left ventricles, respectively) (Figure 1) defined by sets of AP, ML and DV coordinates.
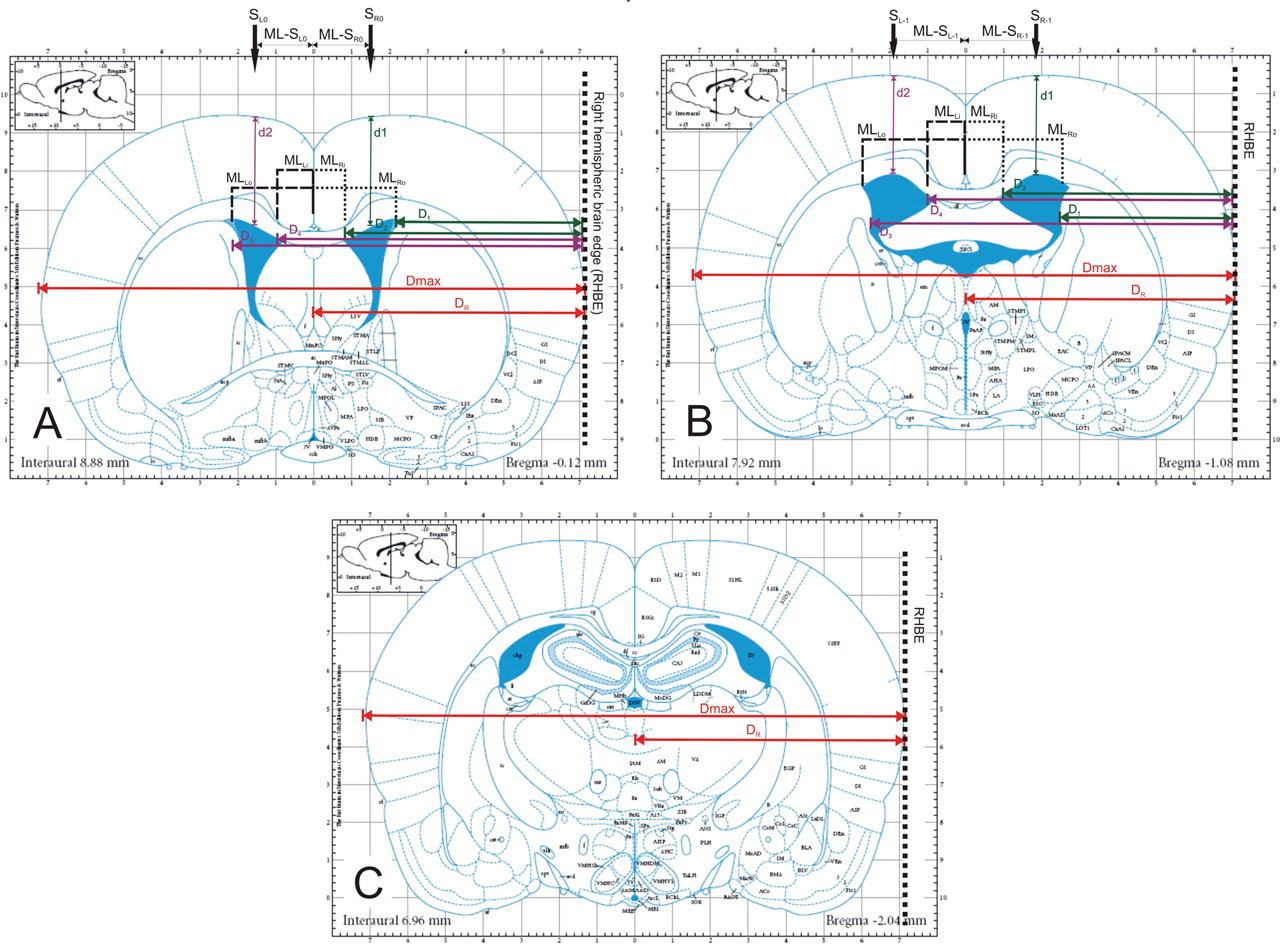
Templates for measurements of ventricular coordinates at the levels −0.12 (A), −1.08 (B) and −2.04 mm (C) from bregma (levels of coronal sections in upper left insets), as described in detail in the text (modified with permission from ‘The rat brain in stereotaxic coordinates’, Paxinos G and Watson C, Figures 34, 42 and 50; © Elsevier Academic Press, 2005). Abbreviations: D max = maximal diameter of TTC section; D R = distance of the middle line from the right hemispheric brain edge (RHBE); D 1 = distance of the outer border of the right ventricle from the RHBE; D 2 = distance of the inner border of the right ventricle from the RHBE; D 3 = distance of the outer border of the left ventricle from the RHBE; D 4 = distance of the inner border of the left ventricle from the RHBE; d1 and d2 = depths of the upper borders of the ventricles to the cortical surface. MLRi and MLRo are the new mediolateral coordinates of the right ventricle's inner (Ri) and outer (Ro) borders as calculated by the mathematical formulae described in the text; MLLi and MLLo are the corresponding coordinates of the left ventricle. ML-S R0 (A) and ML-S R−1 (B) are the final stereotaxic mediolateral coordinates for invasion into the right ventricle (sites S R0 and S R−1). Accordingly, ML-S L0 (A) and ML-S L−1 (B) are the final coordinates for the left ventricle (sites S L0 and S L−1)
Calculation of parameters (1) and (3) was performed on TTC sections that corresponded to AP levels −0.12 (S R0/S L0) and −1.0 mm (S R−1/S L−1) from bregma 20 shown in Figure 1. The level −2.04 was excluded from these calculations because the ventricles are practically inaccessible at this site. For parameter (2) the TTC slides that corresponded to AP levels −0.12 (mlD0), −1.0 (mlD−1) and −2.04 mm (mlD−2) from bregma were used as shown in Figure 1.
In detail, calculation of mlD was performed using the formula: mlD = 100 × (2D R − D max)/D max, where D max is the maximal diameter of each brain section and D R the distance of the middle line from the defined ‘right hemispheric brain edge’ (Figure 1).
This ‘edge’ was also the reference line to measure the distances of the outer (D 1/D 3) and inner (D 2/D 4) ventricular walls as shown in Figure 1. Using these data the walls of each ventricle were defined in a stereotaxic basis, i.e. ML distance in mm. The inner walls of the right and left ventricles (MLRi and MLLi respectively) were calculated using the formulae MLRi = (D max/2) − D 2 and MLLi = D 4 − (D max/2). The outer walls of the right and left ventricles (MLRo and MLLo) were calculated using the formulae MLRo = (D max/2) − D 1 and MLLo = D 3 − (D max/2). These calculated ML distances were used in the end to define the final stereotaxic ML coordinates (ML-S R and ML-S L) in mm for each corresponding ventricle using the formulae: ML-S R = (MLRi + MLRo)/2 for the right invasion site (S R) and ML-S L = (MLLi + MLLo)/2 for the left invasion site (S L) (Figure 1). At this point, it should also be noted that these ML coordinates additionally represented the corresponding ML shifts studied in Figure 2 and Table 1.
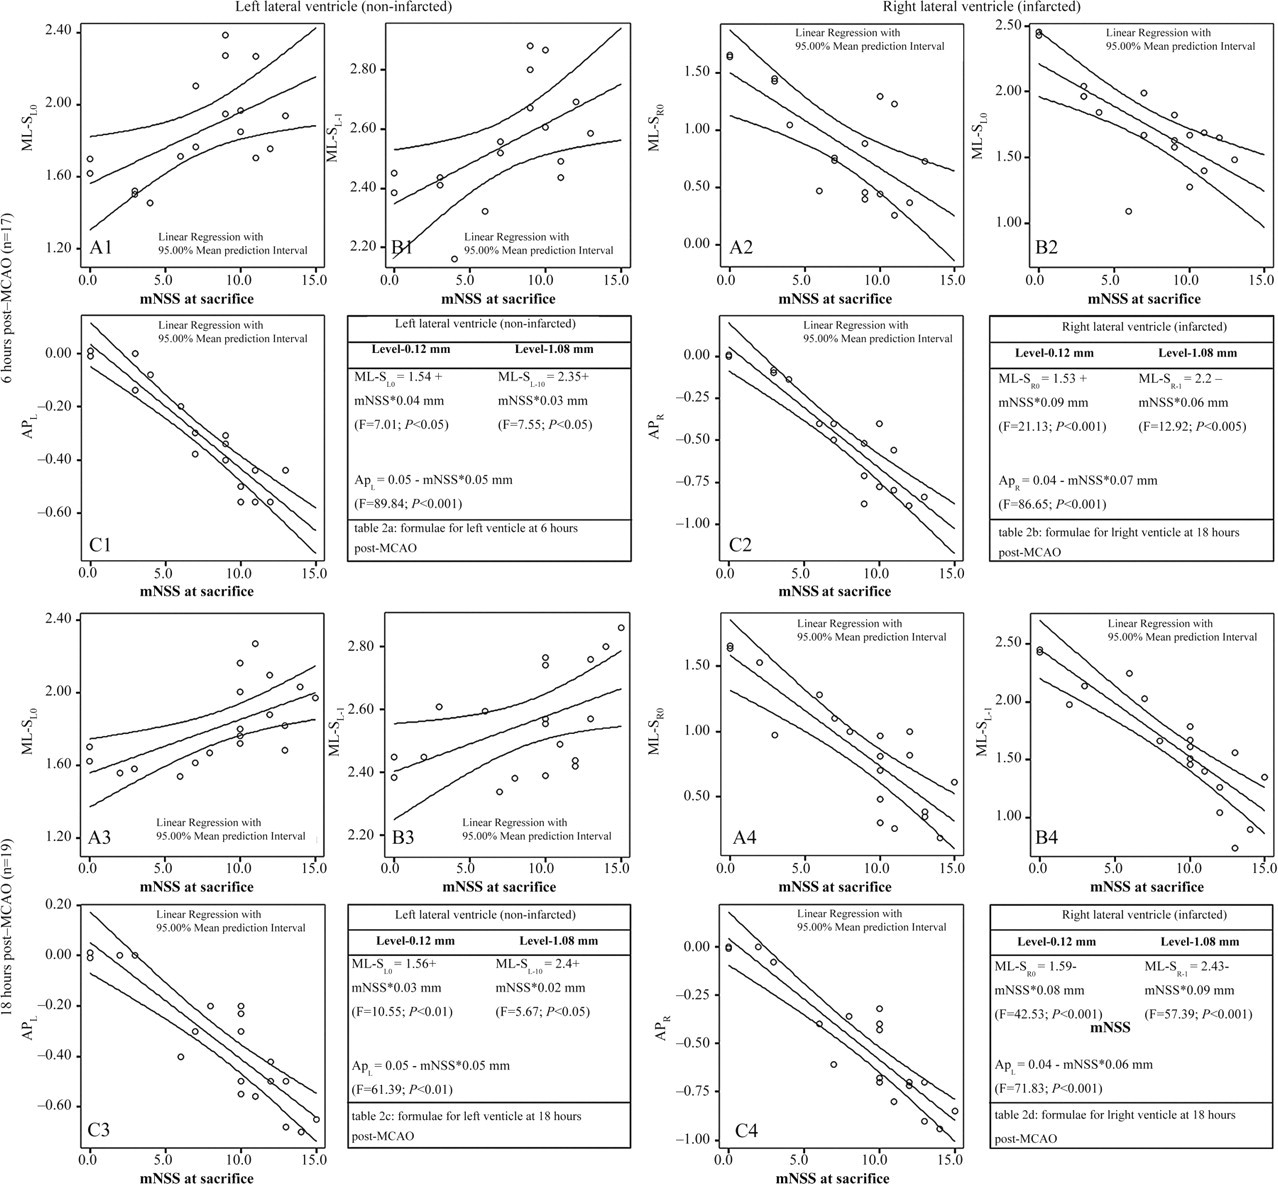
Scatterplots of the mNSS scores to the ML shift at the levels −0.12 (A1, A2, A3 and A4) and −1.08 mm (B1, B2, B3 and B4) from bregma as well as to the AP shift (C1, C2, C3 and C4), at 6 (subgroup Ac, upper panel) and 18 h (subgroup Bc, lower panel) post MCAO. Inset tables 2a, 2b, 2c and 2d present the corresponding formulae used for calculation of the new stereotaxic coordinates. The right ventricle (right panel) is significantly affected at both time-points and laterally displaced towards the left side (A2, B2 and A4, B4). The left ventricle (left panel) is also displaced at the left, however, in a lesser degree (A1, B1 and A3, B3). Abbreviations: mNSS = modified Neurological Stroke Scale; ML = mediolateral; AP = anteroposterior; and F is the score of linear regression analysis
Correlations between ventricular shifts (dislocations) and neurological scores
Values display Pearson's r score indicating positive or negative significance (*P ≤ 0.05; † P ≤ 0.01; ‡ P ≤ 0.001). NC: no correlation between the two values. ML-SR0, ML-SR−1 and APR are the final stereotaxic mediolateral (ML) and anteroposterior (AP) shift for the right ventricle (sites S R0 and S R−1). Accordingly, ML-S L0, ML-S L−1 and APL are the final shift for the left ventricle (sites S L0 and S L−1). mNSS: modified Neurological Stroke Scale; mBS: modified Bederson's Scale; GWT: grid-walking test
AP displacement (shift) of the right and left ventricles (APR and APL) was estimated as the distance between the trypan blue index marks (‘theoretical’ position) and the actual position of the trace in the tissue, as defined in the Paxinos and Watson rat brain atlas. 20 Using these shifts (Figure 2, inset tables) the final AP stereotaxic coordinates for sites S R and S L were calculated by the following formulae: AP-S R0 = 0 + APR (right ventricle) and AP-S L0 = 0 + APL (left ventricle) for ICV invasion at the level of ‘−0.12 mm’ and AP-S R−1 = −1 + APR (right ventricle) and AP-S L−1 = −1 + APL (left ventricle) for ICV invasion at the level of ‘−1.08 mm’.
The depths (d1 and d2) of each ventricle (distance of the ventricular roof from the cortical surface) at the optimal sites for stereotaxic invasion were measured directly in mm (Figure 1).
The addition of ‘zero (0)’ or ‘−1’ as subscripts in all prementioned abbreviations, where applicable throughout the text, indicates the corresponding AP level according to the Paxinos and Watson atlas. 20
Verification of the new post-ischaemic stereotaxic coordinates
To verify the tenability of our approach we tested the new coordinates by injecting 5 µL of trypan blue in the lateral ventricles of animals with MCAO at 6 h (subgroup Av, n = 5) and 18 h (subgroup Bv, n = 5) post-occlusion. For this purpose, stereotaxic injection was performed as described in the section ‘Stereotaxic injections – marking of the lateral ventricles’ but new coordinates were used, using the data of the stereotaxic ventricular shifts according to Figure 2 (inset tables 2a, 2b, 2c and 2d). Thus, for injections at the level of −0.12 mm the set of coordinates were defined as follows:
Right ventricle AP = 0 + APR mm, ML = ML-S
R0 mm and DV = 4.0 mm; Left ventricle AP = 0 + APL mm, ML = ML-S
L0 mm and DV = 4.0 mm. Right ventricle AP = −1 + APR mm, ML = ML-S
R−1 mm and DV = 4.0 mm; Left ventricle AP = −1 + APL mm, ML = ML-S
L−1 mm and DV = 4.0 mm.
Accordingly, for injections at the level of −1.08 mm:
Statistical analysis
All data are given as mean ± standard deviation (SD). Statistical analysis was performed using the SPSS 11.5 package. Student's t-test was used for comparisons between two groups. Correlations between neurological scores (mNSS, mBS and GWT) and ventricular shifts, (ML-S R, ML-S L, APR and APL shifts) at each AP level (−0.12 and −1.08 mm) were performed using the Pearson correlation coefficients. Curve estimation for the best-fit neurological score was performed using regression analysis (Figure 2, scatterplots). Based on this, the mathematical equations for calculation of the new ICV coordinates for each individual animal (Figure 2, inset tables) were set. Number needed to treat (NNT) for a successful infarction was calculated using the formula: NNT = 1/|risk reduction|, where the vertical bars in the formula appoint the absolute value of risk reduction. 24 Minimal statistical significance was set at P < 0.05.
Results
Physiological variables and mortality
All measured physiological variables remained within normal limits with no statistically significant differences pre- or post-occlusion (data not shown). Mean body weights were 384.0 ± 61.5, 373.0 ± 28.0 and 362.1 ± 72.3 for groups A, B and naïve, respectively. During anaesthesia, rectal temperature remained at 37.0 ± 0.2°C. Direct post-ischaemia temperature was slightly raised at 37.4°C to 38.1°C in some animals, within the total 18 h of observation. No subarachnoid hemorrhage was observed in any animal of the study.
Neurological deficits
Most MCAO animals developed moderate to severe ischaemic stroke. Groups A and B developed mNSS scores of 7.7 ± 3.3 and 9.8 ± 3.6 and mBS scores of 4.8 ± 2.1 and 5.5 ± 1.9, respectively. The GWT revealed 46.1 ± 31.0% and 56.4 ± 29.4% left forelimb fault steps and 21.1 ± 14.4% and 24.2 ± 23.8% left hindlimb fault steps for groups A and B, respectively. Five animals of group Bc with severe stroke and oedema (mNSS ≥ 12) were at a moribund state with no spontaneous activity and reduced response to stimuli. No statistically significant differences were observed between the two groups (Student's t-test, P > 0.05).
Infarction and oedema volumes
Extensive ischaemic brain infarction was found in most MCAO animals. For groups A and B, estimated %V inf was 22.9 ± 14.8% and 24.4 ± 13.7%, respectively. The %HE was 10.4 ± 6.7% at 6 h and was slightly increased at 18 h (11.4 ± 7.3%) post-occlusion. No significant differences were observed between the two groups for any of the above variables (Student's t-test, P > 0.05).
Post-ischaemic ventricular dislocation – correlations with neurological scores
Ischaemic infarction caused significant dislocations of the middle line. At 6 h (subgroup Ac), the mlD at the AP levels of −0.12, −1.0 and −2.04 mm was mlD0 = 5.7 ± 3.5%, mlD−1 = 5.8 ± 3.2% and mlD−2 = 4.8 ± 2.8%, respectively. At 18 h (subgroup Bc), mlD at the same AP levels was 6.0 ± 3.0%, 6.3 ± 2.7% and 3.8 ± 3.1%, respectively. However, no significant differences were observed between the two time-points (Student's t-test, P > 0.05).
Correlations and scatterplots of the ventricular coordinates with the neurological scores of the animals at the time of sacrifice are shown in Table 1 and Figure 2, respectively. At 6 h (subgroup Ac), the ML coordinates of the right (infarcted) and the left (non-infarcted) ventricles strongly correlated (P < 0.05) with the neurological scores of the animals (mNSS, mBS and most GWT scores), i.e. the severer the stroke was, the more dislocated the ventricles were (Table 1). At 18 h (subgroup Bc), the stereotaxic ML coordinates of the right and left ventricles also highly correlated (P < 0.001) with mNSS and mBS scores but not with most of the behavioural indexes of GWT (Table 1).
AP shift of the ventricular system was significant (P < 0.05) and consistent for both sets of coordinates at the levels 0 and −1 mm from bregma, at each hemispheric side. Moreover, this shift was present at both hyperacute (6 h, subgroup Ac) and acute (18 h, subgroup Bc) phases of ischaemic stroke (Table 1). Depths were not affected at either time-points (data not shown).
Verification of the new post-ischaemic stereotaxic coordinates – success rates and NNT
Using the new AP and ML coordinates, calculated by the mathematical equations described in the section ‘Post-ischaemic ventricular dislocation – related calculations’ and the data from Figure 2 (linear equations in inset tables), we achieved 80% (8/10) success of ICV invasion in both ventricles (subgroups Av and Bv). In contrast, using the ‘theoretical’ injection sites in the 17 animals of subgroup Ac and the 19 of subgroup Bc, the success of ICV invasion in both ventricles was 19.4% (7/36). In addition, the NNT for the proposed new coordinates was significantly low (1.65), meaning that in order to successfully achieve ICV invasion acutely after ischaemic stroke in 10 animals, one should use approximately 51 animals using the classical Paxinos coordinates (‘theoretical’) compared with approximately 13 animals using the proposed corrected coordinates. Representative results are shown in Figure 3.
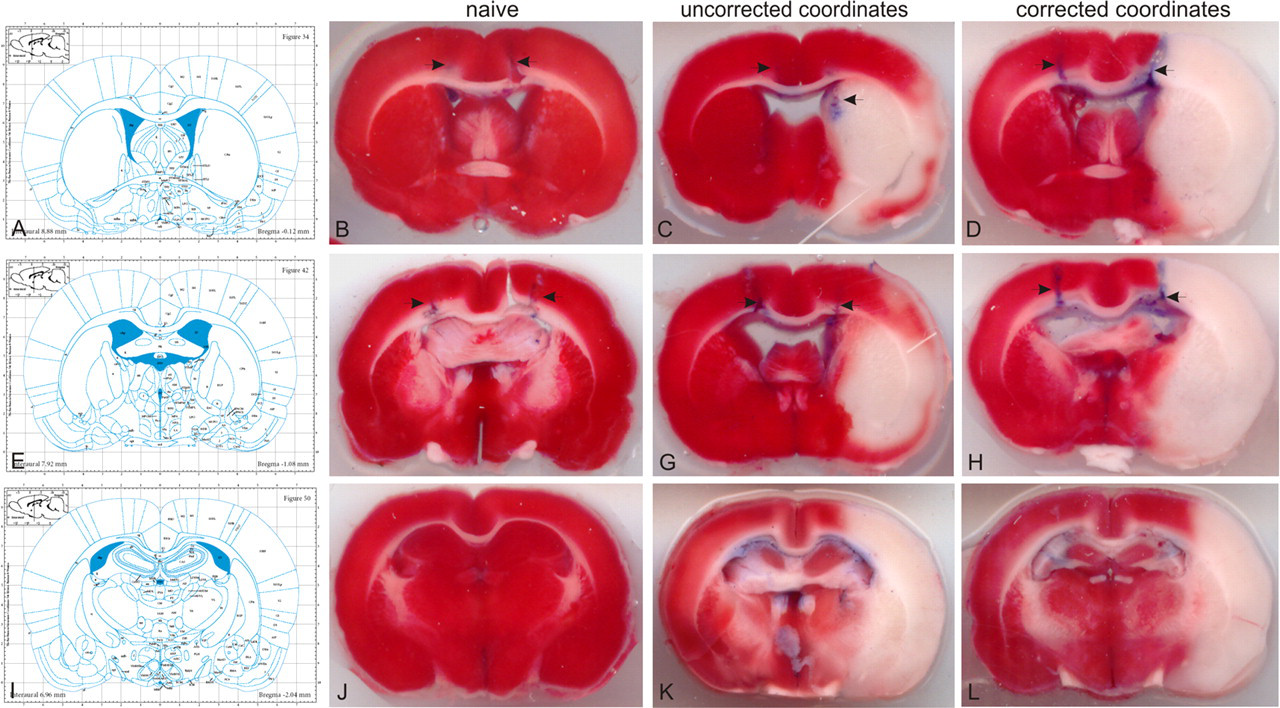
The corresponding Paxinos brain atlas' plates (A, E and I with permission from ‘The rat brain in stereotaxic coordinates’, Paxinos G and Watson C, Figures 34, 42 and 50; © Elsevier Academic Press, 2005) and the representative brain TTC-stained sections at the levels −0.12 (B, C, D), −1.08 (F, G, H) and −2.04 mm (J, K, L) from bregma. Blue needle traces on the TTC sections indicate the marking (uncorrected) and verification (corrected) injections of trypan blue at the levels −0.12 and −1.08. Naïve animals (group N) did not need any correction of the Paxinos coordinates (B,F). In MCAO animals (subgroups Ac and Bc) the same coordinates (uncorrected) either missed the lateral ventricles or invaded them by chance (C, G). Application of corrected (new) coordinates (subgroups Av and Bv) successfully reached the targeted ventricle (D, H)
Discussion
In the present study we measured the ventricular shifts after focal cerebral ischaemia, using a model that has been shown to induce severe MCA infarction in Wistar rats, 4 and we evaluated the success and reliability of stereotaxic ICV invasion in these animals. To our knowledge, our data provide, for the first time, measurable proofs that AP and ML stereotaxic coordinates of the ischaemic ventricle significantly changed at 6 and 18 h post-occlusion and linearly correlate with the mNSS, mBS and some GWT scores. These data further explain, at least in the specific animal model used in the present study, that ICV invasion in the lateral ventricles after MCAO is hampered by predictable ventricular displacements. Additionally, these stereotaxic data can be used to calculate new coordinates, based solely on the animal's neurological score, rendering ICV invasion practical, reproducible and applicable in relative acute experimental settings.
Stereotaxic approaches to the rat brain are widely based on the classical Paxinos and Watson atlas of the rat brain, 20 which is considered a highly accurate tool for brain invasion. Using this atlas, ICV invasion in naïve animals of approximately three months old and 290–310 g of body weight can be accomplished using the following coordinates: AP = −0.12 mm, ML = 1.5 mm and DV = 4.5 mm or AP = −1.08 mm, ML = 2.0 mm and DV = 4 mm. According to the authors of the atlas, the above coordinates should be slightly changed for bigger animals 20 like the rats we used (≥4 months old and ≥340 g body weight). Thus, in the present study, we tested our coordinates and adjusted them to AP = −0.12 mm, ML = 1.6 mm and DV = 4.3 mm or AP = −1.0 mm, ML = 2.4 mm and DV = 4.0 mm so as to successfully invade the ventricles in our naïve animals.
Nevertheless, the oedema that follows ischaemic MCA infarction results in significant and sometimes lethal hemispheric dislocations, 16,19,25,26 rendering ICV stereotaxic invasion a difficult task. This ischaemic oedema is mainly dependent on two factors, i.e. the rat strain and the ischaemic period, while other factors in rat focal cerebral ischaemia (gender, anaesthetic and occlusion model used) may contribute as well. In Wistar rats, the same ischaemic period result in faster and significantly higher accumulation of oedema compared with Sprague-Dawley rats. 16,18,27,28 In the same context, the ischaemic period by itself is also critical and therefore shorter occlusion periods followed by reperfusion result in significantly milder infarction and oedema in both rat strains. 17,25,29 However, in any case, various degrees of hemispheric oedema are present after focal ischaemia in the MCA territory and could prevent any ICV therapeutic intervention in a clinically feasible and rationale time-window, such as the one of 6–18 h post-occlusion used in our study.
Indeed, stereotaxic ICV invasion and further infusion has been widely used and attempted under several different ischaemic conditions but rarely at 2–24 h post-occlusion. It has been performed either prior to MCAO where oedema is not a problem, 9–12 early (15–30 min up to 2 h) post-occlusion where oedema starts accumulating 12,30,31 or several days later (3 days up to 2–3 weeks), where most of the oedema has been resolved. 8,13 However, to our knowledge, there have been only four attempts to stereotaxically invade the lateral ventricles within 2–24 h post-MCAO: in 2003, Piao et al. 11 and Kang et al.; 32 in 2005 Jin et al. 14 and in 2008 Lee and Yoon. 33 Considering the rat strain (Sprague-Dawley), ischaemic period (1 h MCAO) and coordinates used (regular ICV coordinates for naïve rats) in the studies of Piao et al. 11 and Jin et al. 14 a successful ICV invasion could probably be feasible at 6, 12 and 24 h post-occlusion using the predefined experimental settings. In contrast, the other two studies 32,33 have reported contradictory results according to the established coordinates 20 and our present findings. More specifically, their animal model (severe ischaemia by 2 h temporary MCAO in Wistar rats) and their reported coordinates used for ICV invasion 24 h post-occlusion (AP = 0.0, ML = 3.0 mm and DV = 3.5 mm) indicate a striatal or corpus callosal and not a lateral ventricle invasion. 20
When interpreting the results in the present study, most of the neurological scores (mNSS, mBS and GWT) well correlated with the ventricular dislocations at 6 and 18 h post-occlusion (Table 1); however, only the mNSS score was finally selected for mathematical calculations, as it is more widely accepted in the literature. 21 Under these circumstances, we achieved successful ICV invasions with a significantly low NNT score (1.65) compared with the uncorrected (‘theoretical’) coordinates. This low NNT score and its interpretation, as shown in the results, signify that the proposed new coordinates are both time- and cost-effective, assigning increased utility and applicability for post-stroke ICV invasion (Figure 3).
Finally, our data for oedema estimation as obtained from TTC brain sections are closely aligned to a magnetic resonance imaging (MRI) study in vivo. 16 These researchers studied the oedema of infarcted Wistar rats induced by a temporary MCAO model very similar to ours, using a 2.35 T MRI scanner. Their results clearly showed that in severe stroke, oedema is present at one hour post-occlusion, it quickly increases up to 6 h later and peaks at 24–48 h. 16 Our data are also in agreement with others who used the wet-to-dry method for oedema estimation. 28
In conclusion, severe temporary MCAO in Wistar rats displaces the brain ventricular system at the AP levels of −0.12 to −2.04 mm from bregma causing significant changes in ventricular stereotaxia, shortly after MCAO. These changes are predictable and new AP and ML coordinates can and should be re-calculated using the proposed simple mathematical equations based on the mNSS score of each individual animal. These new coordinates warrant a more successful route of invasion into the lateral ventricles 6–18 h post-MCAO, with a significantly low NNT score. Evidently, our proposed method renders ICV stereotaxic administration in post-stroke Wistar rats, both cost- and time-effective in a time-window that is clinically rational and desirable for stroke. However, more studies are needed if other rat strains and/or different ischaemic models are considered.
Footnotes
Acknowledgements
The present Project is co-funded by the European Union – European Social Fund and National Resources – (EPEAEK-II) under a ‘Pythagoras-II’ grant. The author AL is holding a PhD scholarship from the Greek State Scholarship's Foundation.