
Abstract
Summary
Objective
To study the career destinations, job satisfaction and views of UK-trained senior doctors.
Design
Postal questionnaire.
Setting
All doctors who qualified from all UK medical schools in 1977; and Department of Health employment data.
Main outcome measures
Career destinations of medical qualifiers from 1977.
Results
72% responded to the questionnaire. Using all available evidence, including that on non-responders, 76% of the cohort, comprising 77% of the men and 74% of the women, were working in the NHS 27 years after qualification. Approximately 18% were in medical jobs either overseas or outside the NHS. Of respondents in the NHS, 89% of men and 51% of women had full-time contracts. NHS doctors rated their job satisfaction highly, with a median score of 19.5 on a scale from 5 (very low satisfaction) to 25 (very high satisfaction). Satisfaction with time off for leisure was much lower, with a median score of 4.6 on a scale from 1 (low) to 10 (high). Of those in the NHS, 67% agreed that they worked longer hours than they thought they should; and 40% agreed that their working conditions were satisfactory.
Conclusions
27 years after qualification, the percentage of women who were working in the NHS was similar to that of men. Although these senior doctors had high levels of satisfaction with the content of their jobs, they were not so satisfied with their working hours and working conditions. Our results can be used as benchmarks, against which the career pathways and satisfaction levels of more recently qualified doctors can be compared.
Introduction
Surveys of senior doctors can provide important insights into doctors' career destinations, job satisfaction, views about their jobs and future plans. We report on a survey of the qualifiers of 1977 from all UK medical schools – as an example of a cohort of doctors from the 1970s – conducted in 2004. In this paper, we focus on career destinations, job satisfaction and views. In an accompanying paper, 1 we report on the doctors' future plans.
Methods
Procedure and population
Since 1975, the UK Medical Careers Research Group has followed the careers of UK doctors by conducting regular postal questionnaire surveys. The Group surveys cohorts of doctors, each consisting of all qualifiers from all UK medical schools in a selected year, at regular intervals after graduation. Our survey methods have been reported in detail elsewhere. 2 The starting point for each of our surveys is the cohort of qualifiers as it was in the first year after qualification (excluding a small number who do not wish to participate). In 1978, the General Medical Council provided a list of all UK medical qualifiers and their addresses. In successive surveys since then, we have tried to trace all the original members of the cohort. Updated addresses have been obtained from the respondents themselves in the course of previous surveys, and from current editions of the Medical Register and the Medical Directory.
The survey instrument
The questionnaire comprised structured, ‘closed’ questions and statements, a few ‘open’ questions, and a request for ‘free text’ comments on any aspect of the respondents' career or work. Topics covered by our questionnaire included current employment, previous jobs since our last survey, levels of satisfaction with their job and with time available for leisure activities, views about different aspects of their jobs, future career plans and retirement intentions.
The statements used to assess job satisfaction and satisfaction with time available for leisure, and the calculation of scores based on them are described in Appendix A. To assess doctors' views on working conditions and career opportunities, we invited them to respond to various attitude statements by scoring their views on a five-point scale from strongly agree to strongly disagree.
Definitions and data analysis
We focus mainly on respondents who were working in the NHS, defined as holding either a substantive or an honorary NHS contract (the latter are predominantly those with substantive clinical academic posts). In the analysis, we aggregate specialties into broad groups based on those initially defined in the Todd Report. 3
Response rates, demographic data and details about posts held were summarised using descriptive statistics. Differences in the distribution of career destinations were assessed using χ2 tests. Distributions of job satisfaction and leisure satisfaction scores were compared using Mann-Whitney U tests. In making multiple similar comparisons, we regarded the attainment of a significance threshold of p≤0.01 as evidence of significant difference.
Data from the Department of Health's employment record; capture-recapture analysis
As we have done previously, 4 data about whether the doctors were currently employed in the NHS were obtained from the Department of Health's employment record. These data, and those from our survey, were analysed using capture-recapture methods. 5 The combined data provide a more reliable whole-cohort estimate of NHS participation than that available from either dataset alone. We have previously demonstrated 6 that this method produces results which are consistent with those obtained by exhaustive tracing of non-respondents by personal follow-up.
Results
Response rates
In 1977, 3135 doctors qualified in the UK. Of these, 67.5% (2116) were men and 32.5% (1019) were women. 54 are known by us to have died, 36 declined to participate in the survey, and 2180 responded, giving an effective response rate of 72% (2180/3045), comprising 69.7% (1430/2051) of men and 75.5% (750/994) of women. The mean and median age of the 1977 cohort at the time of the survey was 51 years.
Career destinations of respondents
Career destinations of the respondents from the cohort of UK qualifiers of 1977 (percentages of all respondents and numbers of doctors)
Percentages may not add up exactly owing to rounding.
Includes doctors known to be working in medicine but who did not state their specialty.
3 women respondents did not provide details of their employment and have been omitted from the table.
Of the 1888 doctors in the NHS, 50.2% (948) were in hospital practice, 45.8% (864) in general practice, and 4.0% (76) in public health medicine or community health. 54.5% of the men and 41.8% of the women were in hospital practice; 43.6% of the men and 49.6% of the women were in general practice; and 1.7% of the men and 8.6% of the women were in public health medicine or community health. Comparing the NHS doctors in these broad career destinations, the differences between men and women were significant (χ2 2=67.5, p<0.001). The percentages of men and women working in medical jobs, but not in the NHS, were similar (men 10.7%, women 10.3% of all respondents).
As shown above, a significantly and substantially higher percentage of men than women respondents were in NHS hospital practice. Furthermore, considering specialty destinations within NHS hospital practice, there were also significant differences between men and women (χ2 10=77.0, p<0.001). For this calculation we included the 11 hospital specialty groups listed in Table 1, that is, all of the categories listed under ‘UK NHS’ except general practice, community health and public health medicine (comprising 682 male and 266 female respondents). The specialties that showed significant male-female differences, based on analysis of adjusted residuals, were the surgical specialties (25.7% of the men were in hospital practice, 5.6% of the women), paediatrics (4.8% of men, 8.6% of women), pathology (8.7% of men, 13.2% of women) and psychiatry (7.3% of men, 19.2% of women).
Career destinations of the whole cohort, using capture-recapture analysis and revised calculations
Career destinations 27 years after qualification: hypothetical cohort of 100 UK qualifiers of 1977 incorporating all available information about non-respondents and respondents
See Appendix B for assumptions and calculations.
In Table 2 we give our best estimates of the career destinations of the whole cohort, not just the responders, expressed per hundred original qualifiers. The basis of the calculations is given in Appendix B. These revised estimates suggest that, of the whole cohort, about 94% were working in medical jobs, with 4% currently not employed in medicine and 2% deceased.
Other posts held by respondents
We asked the doctors to tell us about other posts held, in addition to their main specialty. 133 respondents were medical directors/clinical directors in NHS Trusts, clinical directorates or other NHS organisations. 29 were PEC members or PEC chairs (PECs are Professional Executive Committees in Primary Care Trusts in the UK). 45 held other substantive roles in Primary Care Trusts (e.g. PCT Clinical Governance Lead, PCT board member, PCT chair/committee member, PCT Research and Development Lead). 14 respondents were medical school deans, postgraduate deans, or associate deans.
Full-time and part-time working
Full-time and part-time working for doctors in medical employment (numbers of doctors, percentages of respondents at each level)
1955/2118 (92.3%) of those in medical posts and 1752/1888 (92.8%) of those working in the NHS told us their working pattern.
Achievement of senior career posts
In NHS general practice, 98.0% (534) of the men and 91.4% (288) of the women were principals (χ2 1=18.8, p<0.001). In NHS hospital practice, 98.0% (653) of the men and 73.6% (220) of the women were consultants (χ2 1=140.4, p<0.001). Of women working in hospital practice but not in consultant posts, 19.1% (57) held non consultant career grades and 7.4% (22) held other hospital posts.
Comparisons between early career choice and eventual destination
Early career choices and eventual destinations: percentage of the cohort who chose each specialty at years one, three and five after qualification, and who were working in it at year 27
Notes: The percentages represent concordance within each broad group. Thus, for example, within the hospital medical specialties, if a doctor chose (say) general medicine in year one and practised in cardiology in year 27, the choices count as a ‘match’. The percentages for specialist practice, overall, represent those for the doctors whose original choice and eventual destination were within the same broad specialty group. Numbers include tied and untied first choices for each specialty mainstream. Accident and emergency medicine, community health and public health medicine have been included under ‘Other medical specialties’. Non-medical choices have been excluded. For comparisons of percentages within specialist practice
indicates p<0.01
indicates p<0.001 for the significance of differences from the overall percentage.
A significantly higher percentage of men than of women were working in year 27 in the specialty group that they had originally chosen as junior doctors (χ2 1= 51.6, 32.1, 8.8 for Years 5, 3, 1 respectively; p<0.001, p<0.001, p=0.003 respectively).
Differences were evident between mainstream specialties in the degree to which early choice was related to later career destination (Table 4). Early choices for general practice were more highly predictive of later specialty destination than were choices for specialist practice combined (χ2 1 values gave p=0.02, p<0.001, p<0.001 respectively for Years 5, 3 and 1). Within specialist practice, differences by specialty were statistically significant both overall and separately for men and women in each of the three years (p<0.001 for χ2 9 test in each case). Analysis of standardised residuals show which specialties, within hospital practice, were significantly different from the rest (Table 4).
Satisfaction with job
Job satisfaction and satisfaction with time available for leisure of the medically employed respondents from the cohort of UK qualifiers of 1977; grouped median scores for job satisfaction from 5 (not at all satisfied) to 25 (extremely satisfied) and grouped median scores for satisfaction with time available for leisure from 1 (not at all satisfied) to 10 (extremely satisfied)
Job satisfaction scores: 2106/2118 (99.4%) of respondents in medical employment gave valid replies. Leisure satisfaction scores: 2107/2118 (99.5%) of respondents in medical employment gave valid replies.
Among NHS respondents, the overall median scores for men and women were very similar (p=0.2), as were those for part-time and full-time doctors (p=0.6). Hospital doctors were slightly more satisfied (median 19.7) than GPs (19.3, p=0.006). The difference between hospital doctors and GPs in this respect was more apparent among full-time doctors (p=0.001) than among part-time doctors (p=0.4), and more apparent among men (p=0.002) than among women (p=0.6).
Satisfaction with time available for leisure
The scores of NHS doctors for satisfaction with time available for leisure activities
were distributed bi-modally and were low with a median score of 4.6, on a scale from
1 (very low) to 10 (very high). NHS doctors were significantly less satisfied than
those in UK medicine outside the NHS (7.3) and those in medicine outside the UK (6.4)
(both comparisons p<0.001). Leisure satisfaction scores for NHS doctors: full-timers, part-timers; and
hospital doctors, GPs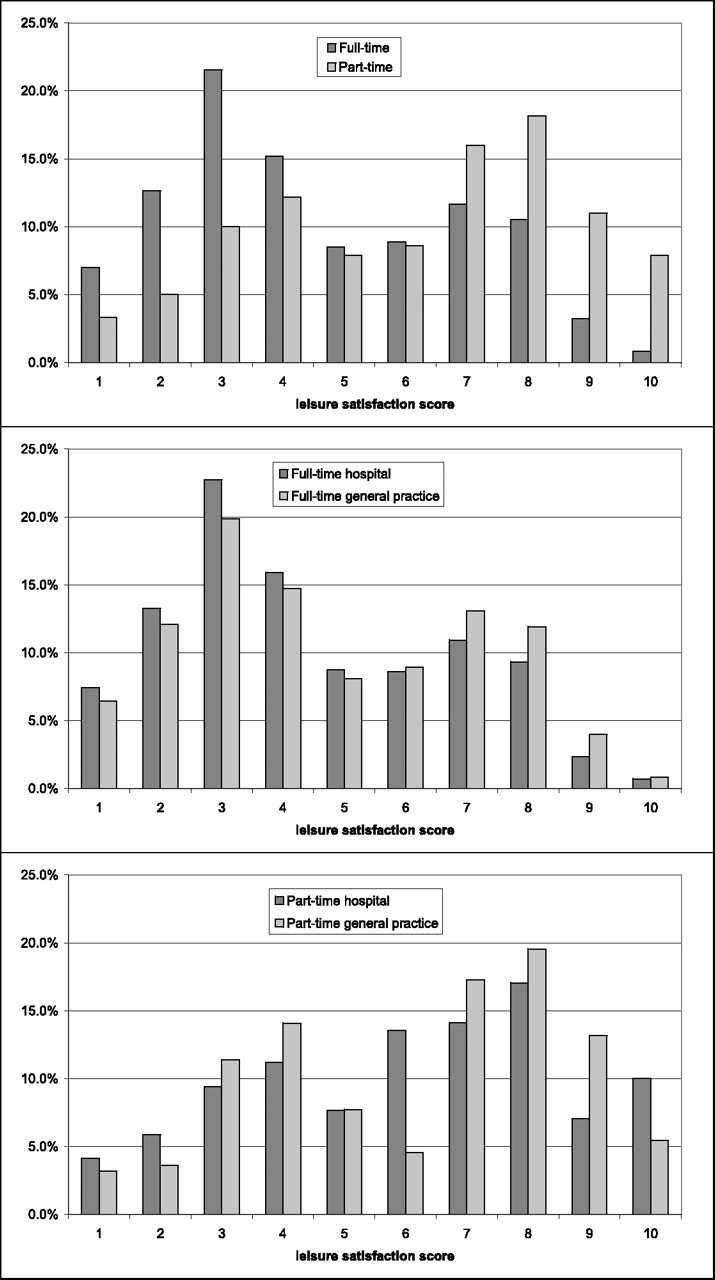
Within the NHS, part-time doctors were much more satisfied with their leisure time (Table 5, median score 6.6, and Figure 1) than were full-time doctors (4.1, p<0.001). Full-time GPs were more satisfied (4.4) than full-time hospital doctors (3.9, p=0.01). Within the group of full-time hospital doctors, the scores for men and women were the same (3.9); and, similarly, within the group of full-time GPs, the median scores for men and women were the same (4.4). Among women part-timers, GPs had a similar level of satisfaction (6.9) to part-time women hospital doctors (6.8, p=0.7). Among male part-timers, GPs appeared more satisfied (6.3) than hospital doctors (5.3) but numbers were small and the difference was not statistically significant (p=0.4). Figure 1 illustrates how levels of satisfaction with leisure time varied for full-time and part-time hospital doctors and GPs working in the NHS.
Views of respondents about their jobs and careers
Views of respondents about their jobs and careers for doctors working in the NHS. Values are percentages
Men's and women's views about working conditions and support did not differ greatly. More respondents agreed that the nursing staff were supportive (78.9% overall) than agreed that management was supportive (45.2%). 67.3% agreed that their working hours were excessive and only 40.2% of respondents considered that their working conditions (e.g. resources available, environment) were satisfactory.
Overall, 69.0% agreed that they had had good career opportunities to date and 65.4% were positive about opportunities for career development. 39.3% agreed that the prospects for improvement of the NHS in their specialty as a whole were good while 34.2% disagreed. Differences between men and women on these statements were small.
Discussion
Principal findings
Our paper provides unique information about senior NHS doctors' career destinations and levels of job satisfaction. For example, 27 years after qualification, the percentage of women who were working in the NHS was very similar to that of men. The doctors had high levels of satisfaction with the content of their jobs, but they were not so satisfied with their working hours and working conditions.
Strengths and weaknesses of study
This is, we believe, the most comprehensive study ever undertaken of a cohort of UK doctors who qualified in the 1970s. It also covers the longest period after qualification that has been studied by our group. Our findings, particularly those using capture-recapture, provide the most comprehensive and precise estimates available on the participation of a cohort from this generation in the NHS. It updates our findings on this cohort when surveyed in 1995. 7
A limitation of our study is that, although the response rates are high for this kind of survey, responder bias needs to be considered. It is evident from the comparison of Tables 1 and 2 that we achieved a higher response rate from those working in the NHS than from others. We are confident that, when the capture-recapture analysis is included, our estimates of NHS participation are accurate. We cannot be so sure about the distribution of the others, notably about the estimates for those working in medicine outside the NHS compared with those not in medicine. Our findings from responders suggest that, of those not in the NHS, a considerably higher proportion is in medicine outside the NHS than are not in medicine at all. This corresponds with evidence from other surveys that, if doctors leave the NHS, they are much more likely to continue to practise medicine (in the UK, outside the NHS, and abroad) than to leave the profession. 10
Policy implications
In addition to documenting the careers of the cohort itself, our results provide findings on career pathways and job satisfaction that could be compared, in future, with the career pathways and satisfaction of later generations of doctors. For example, we have shown that almost four-fifths of the cohort of 1977 who chose general practice in year 3 (roughly the stage at which young doctors now are being encouraged to make their specialty choice in the UK) were working in it 25 years later. In hospital specialist practice, about two-thirds of the cohort who chose a hospital specialty group was working in it eventually. Thus, while in many cases the doctors made early choices that were later sustained, a sizeable minority of doctors followed different paths to their choice in their early years. This is relevant to current debate in the UK about whether the new postgraduate training scheme, Modernising Medical Careers, will provide enough flexibility to accommodate a degree of uncertainty among junior doctors about the careers that they will eventually want to follow.
The percentage of women who eventually practised medicine in the NHS was fractionally smaller than that of men; but the similarities between men and women in this respect are much more striking than the differences. This should allay concerns sometimes expressed about increasing the intake of women to medical school, that many more women than men might give up practice. They do not; and, when they do for family reasons, they generally return to medical work. 7 However, almost half of all women in the cohort – typically now in their early 50s – practised part-time. Clearly, workforce planning needs to take this into account.
Future research
The NHS doctors rated their job satisfaction reasonably highly, but satisfaction with time available for leisure was often fairly low. Dissatisfaction among senior doctors may have important implications because it could provide motivation for them to reduce their working hours substantially and/or retire early. 11, 12, 13 It is also possible that, although the great majority of these doctors are in very senior and distinguished posts, some have further ambitions for the development of their careers. We explore their future plans in the next paper.
Another possible area for future research would focus on the fact that a higher percentage of women than men in hospital practice are not at consultant level. We do not know whether this is by choice or whether some women feel disadvantaged in this respect. This should be a topic for further study, particularly of younger generations.
Not surprisingly, a higher percentage of women than men entered general practice; but the difference, in this generation, is not great. The gap has widened substantially since then: in recent cohorts, about double the percentage of women than men expect to enter general practice. 8 A much higher percentage of men than women entered the surgical specialities: in recent cohorts the gap is narrowing but it is still very wide. 9 The current reasons for the gap between men and women in specialty choice warrant more detailed investigation.
Footnotes
DECLARATIONS
Footnotes
Acknowledgements
The authors are very grateful to each doctor who participated. We thank Janet Justice and Alison Stockfordfor their careful data entry, and Emma Ayres for survey administration