
Abstract
Objective
To explore whether the 17% increase in cervical cancer in England in 2009 was due to the change in cervical screening policy.
Methods
Trends in incidence of cervical cancer and of cervical intraepithelial neoplasia grade 3 (CIN3) were analysed for England, Wales and Scotland. Invasive cervical cancer data on 4079 cancers in women aged 20–39 diagnosed between April 2007 and August 2011 in England were analysed by single year of age.
Results
In England there was a 38% (95% confidence intervals [CI] 18–62%) increase in cervical cancer incidence rates in women aged 25–29 in 2009 relative to 2008, and a 30% (11–51%) increase in women aged 35–39. Compared rates in 2010 are similar to those in 2008. The average increase between 2000 and 2010 in women aged 25–29 was no greater in England than in Scotland and Wales (relative risk 0.98, 95% CI 0.69–1.39). In England there has been a gradual increase in CIN3 (particularly for ages 25–29) since 2003, with a more dramatic increase in 2009, but a fall in 2010. Audit data showed an increase in cancers diagnosed at age 25 in 2009/2010 and 2010/2011 (P ≤ 0.0004). No increase was observed at age 26. For ages 27–29 an increase in cancer was observed for 2008/2009–2009/2010 when compared with 2007/2008–2010/2011 (P < 0.00001), but linear trends were not significant.
Conclusions
The increase in cervical cancer in England in 2009 cannot be attributed to the lack of screening of women aged 20–24, or to a general decrease in the coverage or quality of cervical screening.
INTRODUCTION
Age standardized incidence rates of cervical cancer, in the UK, have halved since the introduction of a national screening programme in 1988 (from 16.2/100,000 in 1988 to 8.3/100,000 in 2007). 1 Rates in 20–29-year-olds have been rising slowly from 1996, and rates in women aged 30–39 have hardly changed. 2 Nevertheless, it was surprising to see recently published 2009 cancer registration statistics for England 3 recording a substantial increase in the rates of cervical cancer in women aged 25–39. Rates in 2009 were 51% greater than those in 2005–2007, due to 371 additional cases.
In late 2003 a change in cervical screening policy was announced, whereby women in England would first be invited at their 25th birthday instead of from age 20. This policy was rolled out in 2004, but was not retrospective, in that women already invited for screening under age 25 would receive a second invitation three years later, even if still under age 25. Thus, it was only from 2009 that substantial numbers of women would have received a first screening invitation at age 25. Despite this policy change being evidence based, 4 there were many who predicted that it would lead to an increase in cervical cancer in young women. 5 We therefore wanted to see whether the rise in cervical cancer in women aged 25–39 was restricted to those aged 25–29, and whether a similar rise was seen in Scotland and Wales, where screening continued to be offered from age 20.
This study explores the observed increase in cervical cancer incidence rates in 2009 in England by comparing incidence rates with Scotland and Wales, including very recently published data for 2010. Additionally, by using data from the national audit of invasive cervical cancer, we explore to what extent the increase is principally in women not invited until they were 25 years old.
METHODS
Information on cervical cancer incidence (ICD-10 C53) from 1990 to 2010 for 20–50-year-old-women was extracted from the Office for National Statistics 6 (series MB1) for England, from the Information Services Division 7 (Cancer Registrations) for Scotland, and from The Welsh Cancer Intelligence and Surveillance Unit 8 for Wales. Rates of cervical intraepithelial neoplasia grade 3 (CIN3) (ICD-10 D06) were also obtained from the MB1 series. 6 Cancer rates by country and five-year age group in women aged 20–35 were smoothed against year of diagnosis using symmetric nearest neighbour smoothing (using the ‘running’ command in STATA).
We also used data from the National Audit of Invasive Cervical Cancers. 9,10 Women diagnosed with cervical cancer were identified by hospital-based programme coordinators across National Health Service trusts in England since April 2007. For 2007, the audit includes 911 cases aged 25–39 compared with 897 registered nationally (the extra cases in the audit may be due to differences in the recorded date of, and therefore age at, diagnosis). For 2009 the numbers are 1111 and 1166, respectively. In June 2010, the audit included 964 cases for 2009. Thus the audit is 80–85% complete within six months of year-end, and eventually becomes almost 100% complete. The audit data are tabulated by UK financial year (April–March). To compensate for the lower number of cases currently available for the 2010/2011 financial year, we have included all cases diagnosed from April 2010 to August 2011 (i.e. 17 months) in 2010/2011.
Because invitations for screening are sent six months before a woman's 25th birthday (stopping and starting six weeks before other test due dates), many women invited from age 25 are actually screened in response to an invitation several weeks before their birthday. We pragmatically present age groups for the audit data 3.0 months before the ages presented (for example, results for age 23 include women aged 22.75–23.75).
Data manipulation and analyses were performed in STATA 11 (StataCorp. 2007. Stata Statistical Software: Release 11. College Station, TX, USA: StataCorp LP). P values and confidence intervals (CI) use the assumption that the number of cases is Poisson distributed.
RESULTS
Trends in England up to 2009
The rate of cervical cancer in women of all ages increased by 17% in 2009 relative to 2008; however, the increase in risk was smaller (7%, relative risk [RR] 1.07, 95% CI 1.00–1.15) in women age 40+ (10.6/100,000 in 2008 versus 11.4/100,000 in 2009). The biggest relative increases were in younger women: for women aged 20–24 RR = 1.57 (95% CI 1.03–2.40); for women aged 25–29 RR = 1.38 (1.18–1.62); for women aged 30–34 RR = 1.30 (1.11–1.51) and for women aged 35–39 RR = 1.25 (1.08–1.45). In 2009 there were an unprecedented 383 cases of cervical cancer in women aged 25–29 in England (corresponding to a rate of 22.2 per 100,000). The previous year there had been 274 (16.1 per 100,000), which itself was a record high. The risk ratio comparing 2009 with 2007 was 1.75 (95% CI 1.47–2.08). Both the increases from 2007 to 2008 (P = 0.009) and from 2008 to 2009 (P < 0.0001) were highly significant. Between 2000 and 2004 the numbers had varied between 147 and 168, and in the early 1970s the rates were much lower (around 6.5 per 100,000).
11
The smaller number of cancers in women aged 20–24 each year means that rates vary considerably, in relative terms, from one year to the next (Figure 1). Although the incidence rate increased by 61% from 2008 to 2009, relative to 2007 the increase in 2009 was smaller and non-significant (RR 1.18, 95% CI 0.80–1.73, P = 0.38). The numbers of deaths from cervical cancer each year in the UK are small in young women, but trends over the last few years give no cause for concern (see Supplementary Table S1).
Rates of cervical cancer in England 2001–2010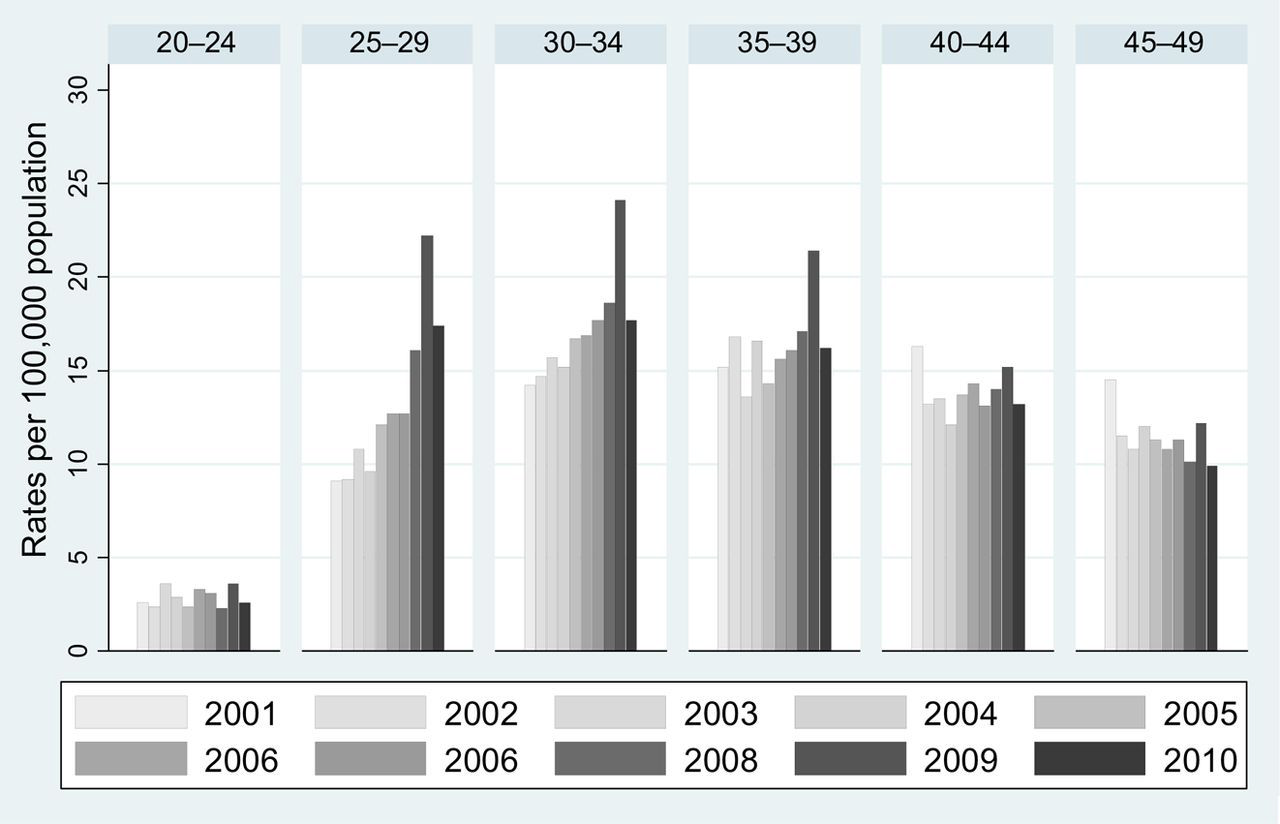
Comparison with Scotland and Wales and with 2010
Figure 1 shows the annual rates of cervical cancer in five-year age bands from 2001 to 2010 in England. The increase in 2008 is largely confined to those aged 25–29, but a dramatic increase in 2009 was seen at all ages from 25 to 39. In 2010 rates in all age groups are similar to those in 2008, and lower than in 2009. Similar graphs for Scotland and Wales (not shown) are harder to interpret because the smaller populations make the rates quite variable. Figure 2, in which the rates are smoothed to ease interpretation of trends, shows that rates (with the possible exception of age 20–24 in England) have increased since 2000 in all three age groups, in all three nations. The increase in incidence of cervical cancer from 2000 to 2010 in women aged 20–24 was not significant in any nation (Table 1). By contrast, the increases were substantial and highly significant in England and Scotland for the three age groups: 25–29, 30–34 and 35–39. While the increases in Wales were not significant in any age group, this was partly due to the much smaller population in Wales, because the magnitude of the increase (per decade) was only somewhat smaller than in England (Table 1). When comparing rates in England with those in Scotland and Wales (combined), a significantly smaller increase (per decade) was observed for women aged 30–34 (0.72, 95% CI 0.54–0.96) and 35–39 (0.68, 95% CI 0.51–0.90).
Cervical cancer rates 1990–2010 by nation and age group Trends per decade in cervical cancer incidence by age group and nation: 2000–2010 RR, relative risk; CI, confidence intervals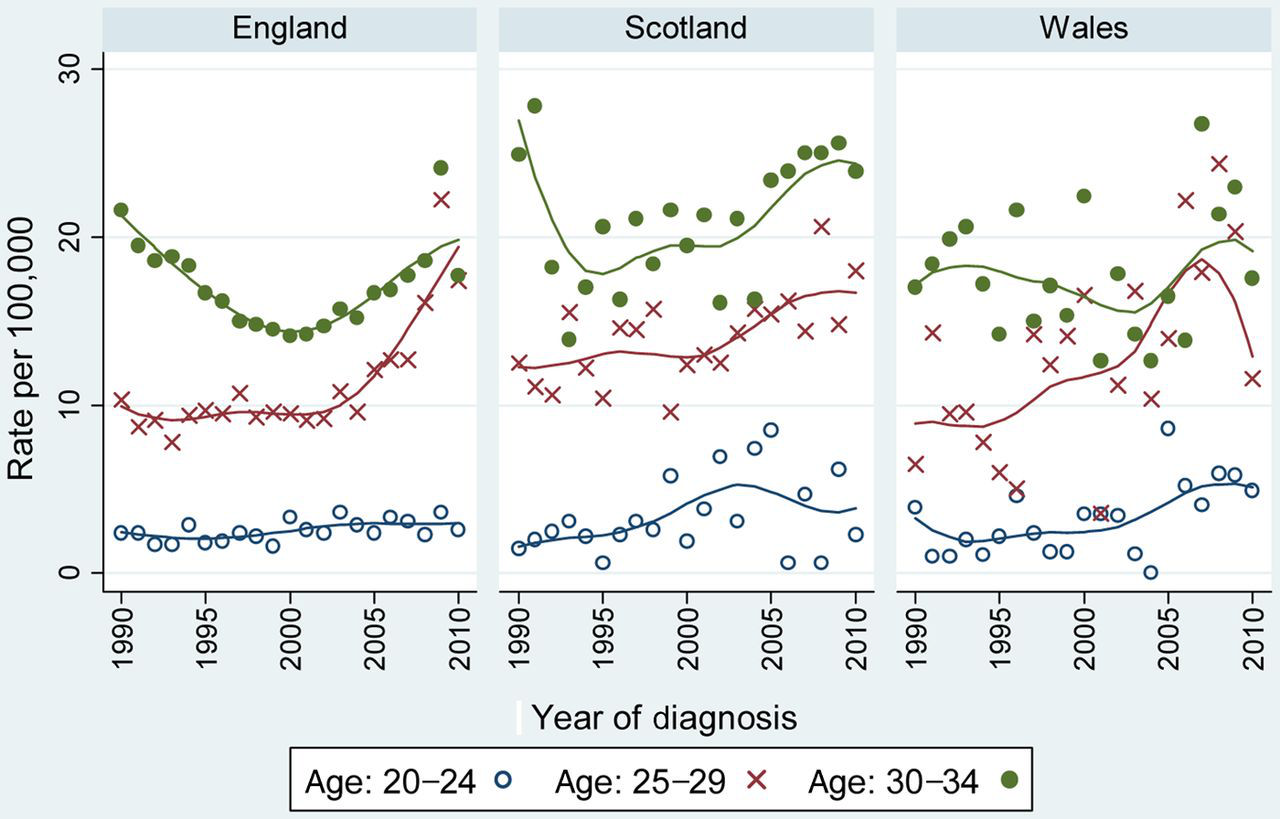
Trends in cervical intraepithelial neoplasia grade 3 in England
Figure 3 plots the annual rates of CIN3 registrations (per 100,000 female population of England: 2003–2010) in women aged 25–39. Trends in incidence are shown in Table 2. For all age groups, there has been a gradual increase in rates since 2003, with a dramatic increase in 2009 followed by a fall in 2010. The average increase per decade was greatest in women aged 25–29 (RR 2.96, 95% CI 2.85–3.07). In each age group between 25 and 39 the relative increase in CIN3 was greater than the relative increase in invasive cervical cancer.
Rates of cervical intraepithelial neoplasia grade 3 in England Trends per decade in cervical intraepithelial neoplasia grade 3 incidence by age group in England: 2003–2010 RR, relative risk; CI, confidence intervals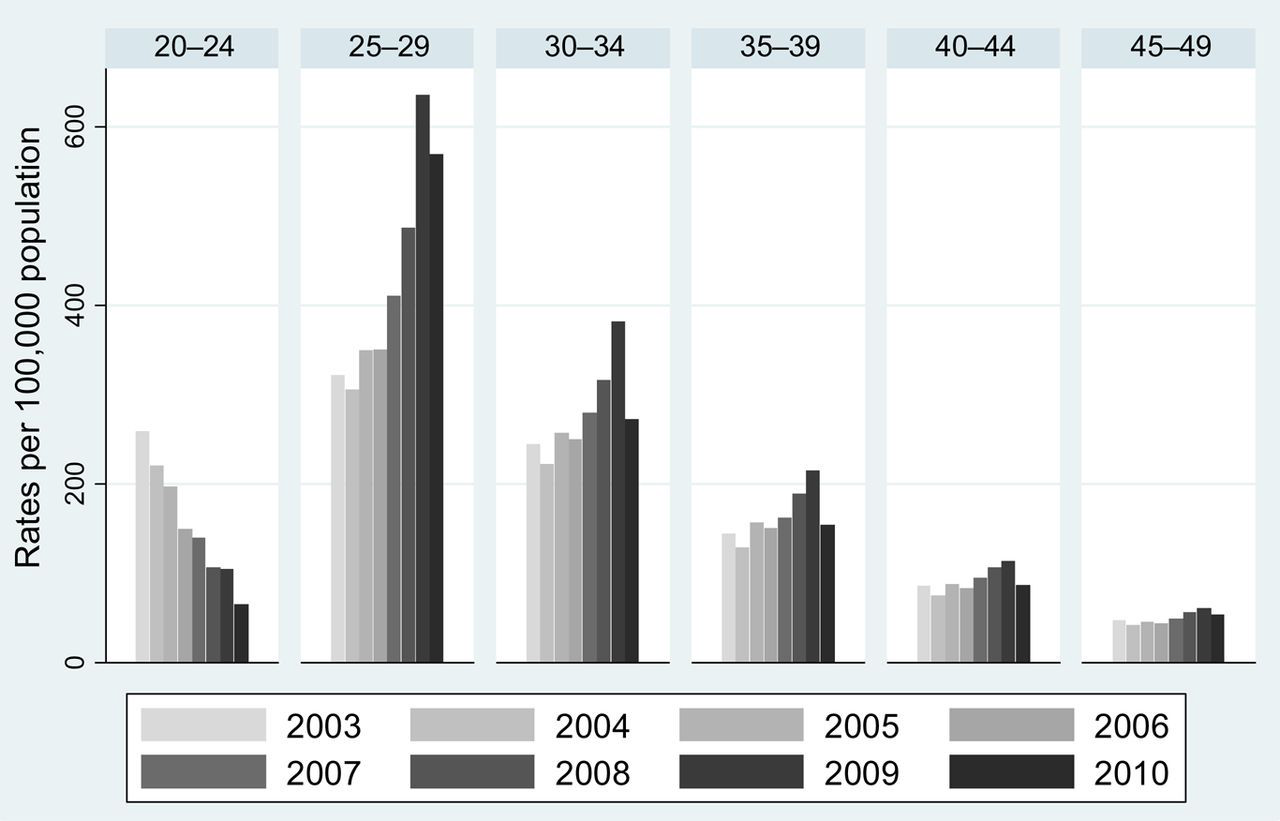
Detailed recent trends from audit data
Number of cancers diagnosed in each financial year by age at diagnosis
Invited for screening at age 25 (values in light gray area); mixture of invited at age 20 and age 25 (values in dark gray area); invited for screening at age 20 (values outside gray area).
RR, relative risk
*Actual age bands start and finish 3.0 months before the shown age (i.e. for age 23 the age band is 22.75–23.75)
†Because the audit is less complete for the last financial year we have extended this year to include cases up to August 2011
DISCUSSION
We found a significant increase in the number of cancers diagnosed between 2000 and 2010 in women aged 25–39 for England. The relative increase in England was no higher than in Scotland and Wales and, in fact, in women aged 30–34 and 35–39 it was significantly less. We also observed a significant increase in the number of women aged 25–39 diagnosed with CIN3. The linear increase in cervical cancer between 2007 and 2011 is mostly limited to new diagnosis in women aged 25.
The increase in cancer incidence between 2000 and 2010 is too great to be solely attributable to changes in screening coverage in women aged 25–34 over the last decade. The 33.7% relative increase in incidence at ages 25–29 between 2000 and 2007 should be compared with the 6.8% decrease in the proportion not recently screened (from 82.0% in 1999 to 76.4% in 2006). 12 Even if all of the cancers were in unscreened women (and they are not), the change in coverage has been insufficient to account for the increase in incidence. It is conceivable that a combination of reduced coverage and reduced quality of screening (for which we have no evidence) would have led to a reduction in the diagnosis and treatment of CIN3 and, consequently, an increase in cancer. However, diagnoses of CIN3 have increased more sharply than have cervical cancer diagnoses.
We attribute the increasing rates of cervical cancer to an increase in the underlying rate of human papillomavirus (HPV) infection, resulting in an increase in the underlying rate of disease in young women 5–15 years later. This is consistent with statistics on sexually transmitted infections such as Chlamydia and genital warts, which increased substantially between 2001 and 2008, 13 and had been increasing during the 1990s. 14,15 Fortunately, the majority of cancers in this age group are diagnosed at stage 1A or 1B (91% in our audit), with excellent prognosis. Among women aged 20–34 in the UK, there were 68 deaths from cervical cancer in 2008 16 compared with 701 diagnoses in 2007. 1 It is only with the maturation of the HPV vaccinated cohort from about 2020 that we will probably see a real reduction in the numbers of deaths from cervical cancer in young women. 17
Our audit data show that, from 2007 to 2011, the yearly increase in cervical cancers was only significant for women aged 25 at diagnosis. This, together with the observed decrease in the numbers of cancers diagnosed between aged 20 and 24, suggests that changes to the screening programme have resulted in an increase of screen-detected cancer in women attending the screening programme for the first time. Whereas cervical screening leads to a substantial reduction of cervical cancer in older women, 18 its lesser impact on cancer incidence in young women 9 may be due to the increase in screen-detected occult invasive disease more than counter-balancing any reduction in cancer from detection and treatment of high-grade disease. Given that stage 1A cancer may be regarded as a success of screening, it is important that stage at diagnosis should be recorded with near 100% completeness and published nationally each year. 10
Although no increased trend was observed in women aged 27–34, by comparing 2008/2009 and 2009/2010 with 2007/2008–2010/2011 we observed a significant increase in the number of cancers diagnosed in 2008/2009–2009/2010, consistent with the exceptionally high rates in the cancer registry data for 2009. We hypothesize that this temporary increase was due to the so-called Jade Goody effect (named after a celebrity who was diagnosed with cervical cancer in August 2008 and who died of the disease in March 2009), and not to the policy changes to the screening programme. Indeed, Lancucki et al. 19 report ‘about half a million extra cervical screening attendances in England between mid-2008 and mid-2009’. The impact of this surge in screening on cervical cancer will be investigated further in a separate study.
CONCLUSION
The 2009 substantial increase in cervical cancer diagnoses in women aged 25–39 in England is not due to a lack of screening. However, the steady increase in disease in young women in the 21st century does reflect an increase of the underlying HPV prevalence in women born between 1975 and 1990.
Footnotes
ACKNOWLEDGEMENTS
This work was supported by Cancer Research UK (C8162/10406 and C8162/12537). The funder had no input in the analysis or interpretation of the data or the writing of the paper. The corresponding author had full access to all the data in the study and had final responsibility for the decision to submit for publication.
References
Supplementary Material
Please find the following supplemental material available below.
For Open Access articles published under a Creative Commons License, all supplemental material carries the same license as the article it is associated with.
For non-Open Access articles published, all supplemental material carries a non-exclusive license, and permission requests for re-use of supplemental material or any part of supplemental material shall be sent directly to the copyright owner as specified in the copyright notice associated with the article.