
Abstract
Background
Risk of future cardiovascular disease (CVD) events is typically estimated from risk factors such as age, sex, blood pressure and cholesterol. Many ‘risk algorithms’ exist to estimate CVD risk. All should have similar screening performances because of the dominant effect of age in predicting who will and will not have a CVD event, regardless of the accuracy of CVD risk estimation. Six CVD risk algorithms were compared (Framingham 1991, Framingham 2008, Reynolds risk, ASSIGN, SCORE and QRISK2), each differing in the risk factors used and in CVD outcomes.
Methods
The six algorithms were applied to a simulated sample of 500,000 people aged 40-74, based on the population of England. CVD risk was calculated for each individual using all risk algorithms, and who did and did not have a CVD event in 10 years was simulated according to those estimated risks. Screening performance was assessed by estimating the detection rate (sensitivity) and false-positive rate (1 – specificity) at a range of cut-off values of CVD risk for each algorithm. The accuracy (calibration) of risk estimation was compared across the six algorithms.
Results
At a 20% false-positive rate the detection rates of the six algorithms ranged from 72% to 79%. The estimated risk cut-offs to achieve the same false-positive rate varied five-fold, from 4% to 21% because of the different risk factors and outcomes considered.
Conclusions
All six risk algorithms had similar screening performances. The accuracy (calibration) of CVD risk estimation does not materially affect screening performance. In distinguishing who will and will not develop CVD it is screening performance that matters rather than the accuracy of the risk estimation.
Introduction
Most publications proposing a new risk algorithm, however, have not focused on determining the screening performance of that algorithm. They have, instead, sought to demonstrate how well the algorithm is calibrated; that is, how close the predicted CVD risks are close to the observed risks of having a CVD event in the population. An accurate (i.e. well calibrated) risk algorithm, however, will not necessarily have good screening performance. We therefore also compared risk estimation among the six algorithms recognizing that they were likely to vary because of differences in risk factors measured, population selected and clinical outcomes.
Methods
We selected the following six cardiovascular risk algorithms for comparison: the Framingham risk algorithm published in 1991, 5 its 2008 update, 7 the Reynolds risk score,8,9 the Pan European score (SCORE), 10 the ASSIGN Scottish algorithm 11 and the QRISK2 UK algorithm.12,13 Table 1 shows the risk factors measured and CVD outcomes predicted for each algorithm, which vary, for example three include family history of early CVD while three do not and the numbers of CVD outcomes predicted range from one to seven CVD deaths.
Properties of cardiovascular risk algorithms: risk factors measured and events predicted
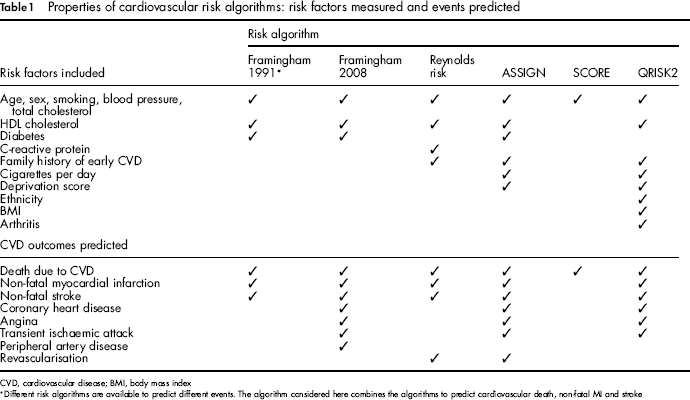
CVD, cardiovascular disease; BMI, body mass index
Different risk algorithms are available to predict different events. The algorithm considered here combines the algorithms to predict cardiovascular death, non-fatal MI and stroke
The screening performance of each algorithm was assessed in terms of the detection rate (or sensitivity) for a given false-positive rate (1 – specificity). The detection rate was defined as the proportion of individuals in the population that had a CVD event during a specified time period with a screen-positive result. The false-positive rate was defined as the proportion of individuals who do not have a CVD event over the same time period with a positive result. The comparison of the different algorithms was achieved by generating a simulated sample of individuals based on the population of England and Wales (age 40–75, the age range recommended by National Institute for Health and Clinical Excellence for screening for cardiovascular disease 4 ).
Generating A Population with Cardiovascular Risk Factors
Data on the age and sex distribution of the population was obtained from Office of National Statistics data. 14 The distributions, given age and sex, of total and HDL cholesterol, systolic blood pressure, body mass index, C-reactive protein (all assumed Gaussian distributed), smoking and diabetes, were obtained from the 2003 Health Survey for England. 15 Distributions of other risk factors were based on data presented in the publications of the relevant risk algorithms.8–11 All risk factors, given age and sex, were assumed to be uncorrelated. Some factors are in fact positively correlated (e.g. smoking status and deprivation score); but the associations are not strong and the risk factors are themselves weak predictors so the impact of ignoring the correlation will be minimal. Appendix Table A1 (Please see http://jms.rsmjournals.com/lookup/suppl/doi:10.1258/jms.2012.012076/-/DC1) gives details of the risk factor distributions. A population of 500,000 people aged 40-75 and values of all the CVD risk factors for each individual were generated using Monte Carlo simulation.
Calculating the Risk and Incidence of CVD
The risk of having a CVD event within one year and within 10 years was estimated for each individual in the simulated population according to the Framingham 1991 algorithm. This risk estimation was repeated for each year of a 10-year ‘follow-up’ period. CVD risks were similarly calculated for five further risk algorithms (Framingham 2008, Reynolds risk, ASSIGN, SCORE and QRISK2).
Individuals who had a first CVD event in each year of the simulated 10-year follow-up period were identified using Monte Carlo simulation, with the probability of having a CVD event being equal to the estimate of one-year CVD risk obtained from the Framingham 1991 algorithm. This is equivalent to spinning a roulette wheel for each individual for each year such that the proportion of reds on the wheel is exactly the same as his or her Framingham risk estimate. If the wheel turns up red, the individual is classified as having had a CVD event in that year; otherwise the individual is classified as unaffected. Hence the Framingham 1991 algorithm is perfectly calibrated for these simulated follow-up data because the risk of CVD in each year is exactly the same as the estimated Framingham risk.
We repeated this process of simulating CVD events for the other five risk algorithms, so that, for example, the risk of a CVD event in each year was equal to the Reynolds risk for that year. This generated six data-sets of simulated CVD events for a 10-year follow-up period. We thus considered, in effect, six different populations, each with a different rate of CVD events, in which one of the six risk algorithms was perfectly calibrated.
Estimating Screening Performance
These six simulated populations were each divided into affecteds (who did have a CVD event during the 10-year period) and unaffecteds (who did not). For a specified risk cut-off, for example, a 20% (1 in 5) estimated 10-year risk of a CVD event according to the Framingham 1991 algorithm, the population was divided into those who were screen-positive (with an estimated risk equal to or higher than 20%) and screen-negative (risk less than 20%). Given these data, the detection rate and false-positive rate were calculated for the specified risk cut-off level. This was repeated for the full range of risk cut-offs from 0% to 100% 10-year risk of CVD. This gave a set of detection rates and corresponding false-positive rates for the Framingham 1991 algorithm. The process was repeated to find the screening performance of the other five risk algorithms and repeated again for each of the six sets of simulated CVD events, giving 36 sets of detection and false-positive rates.
Sensitivity analyses were performed to examine the sensitivity of estimates of screening performance to changes in the distribution of CVD risk factors, specifically by assuming that continuous risk factors followed log-Gaussian rather than Gaussian distributions. Code to perform this simulation study in the R statistical software is available from the authors on request.
Results
Figure 1 shows six sets of curves of the detection rate against the false-positive rate (receiver operator characteristic curves), one sub-figure for each of the six CVD risk algorithms, according to which algorithm was used to simulate CVD events; that is, according to which algorithm was perfectly calibrated. The six curves on each sub-figure thus show the screening performance for each of the six risk algorithms. The algorithm used in the calibration, as would be expected, has the best screening performance, but there is little difference in screening performance across risk algorithms.
False-positive rate against detection rate (receiver operator characteristic curves) for each of the six cardiovascular disease (CVD) risk algorithms according to which algorithm was used to simulate CVD events (i.e. which algorithm perfectly estimates risk)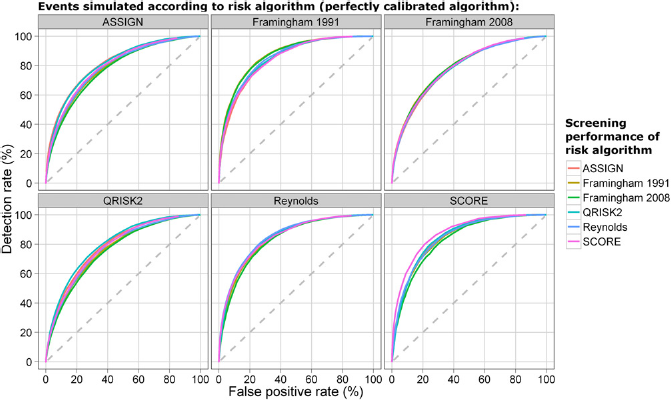
Figure 2 shows the predicted 10-year CVD risk according to the Framingham 2008, ASSIGN, Reynolds risk, SCORE and QRISK2 algorithms compared with the Framingham 1991 algorithm. It shows, for example, a 10-year CVD risk of 20% using the Framingham 1991 algorithm corresponds to a median estimate of risk using the other algorithms that varies from 6% (for SCORE) to 24% (for ASSIGN). The six algorithms produce different risk estimates, for two main reasons. First, different CVD outcomes are predicted: ASSIGN overestimates risk when compared with Framingham 1991 because it is predicting the risk of a wider range of CVD events. Similarly, the SCORE algorithm gives a very low estimate of risk as it predicts only the risk of death due to CVD. Second, the algorithms are calibrated to populations with different incidences of CVD: the Reynolds risk is lower than the Framingham 1991 risk because the Reynolds risk is more recent than Framingham and the incidence of CVD has declined in the US since the Framingham study was undertaken. Similarly, QRISK2 has different risk estimates because it was calibrated for a UK, rather than a US, population.
Median 10-year cardiovascular disease risk according to specified screening algorithm, compared with the Framingham 1991 risk algorithm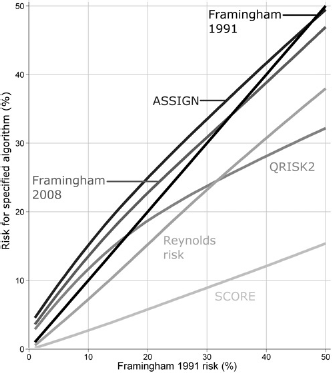
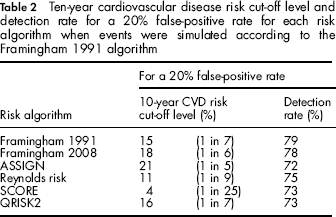
Table 2 shows the detection rate and 10-year CVD risk cut-off level at a 20% false-positive rate for the five risk algorithms when events are simulated according to the Framingham 1991 algorithm. Although the self-calibrated Framingham 1991 algorithm has the highest detection rate, the tables show that differences in screening performance between the algorithms are small even though there is a five-fold difference in risk cut-off levels needed to achieve the 20% false-positive rate across the different algorithms ranging from 1 in 5 for SCORE and 1 in 25 for ASSIGN.
Ten-year cardiovascular disease risk cut-off level and detection rate for a 20% false-positive rate for each risk algorithm when events were simulated according to the Framingham 1991 algorithm
Sensitivity analyses showed that all algorithms are robust to changes in the distributions of CVD risk factors, including modifying the distribution of risk factors for which Health Survey data are unavailable (cigarettes per day, family history and deprivation score) and changing all Gaussian distributions to log-Gaussian distributions. Changing the distribution of the risk factors alters estimates of the detection rate at a 10% false-positive rate by less than ± 1%.
Discussion
Our results show that, as expected given the dominant effect of age in predicting CVD events, all the algorithms have similar screening performances in spite of the different risk factors and CVD outcomes used. This confirms the expectation given that risk factors other than age are poor predictors of CVD.
Our results also show that, as expected, CVD risk estimation varies across the algorithms. It also shows that the accuracy of a risk algorithm is not a good indication of its value in screening. This may appear surprising, but an extreme example shows how it can be true; among people aged 40–75 in the UK the risk of death due to CVD over the next ten years is approximately 3%. This risk could be calculated exactly by counting the number of deaths in the population. Knowing this risk, however, does not permit discrimination between individuals who will and will not die over the next 10 years.
The discordance between risk estimation and screening performance arises because screening performance is dependent on the correct ranking of risk in the population, rather than an accurate estimate of the absolute risk. The SCORE algorithm, for example, estimates the risk of CVD death and so gives a poor estimate of risk of all CVD outcomes, but a person with a high risk of CVD death will also have a high risk of a CVD event, so the ranking of risk by the SCORE algorithm is similar to that obtained using other algorithms and hence so is its screening performance. In general, it does not matter if the predicted risk is, for example, half the true risk; provided the ranking of risk remains the same, screening performance is unaffected.
This study was performed on a simulated population and assumed that, in each of the six cases, one risk algorithm was perfectly calibrated against itself. CVD risk in real populations, of course, will not be perfectly estimated by any risk algorithm. However the findings of this simulation study have also been observed in real populations. Both ASSIGN and QRISK2, for example, have been compared with Framingham using cohorts of individuals from the UK.11,16 Both found that the new algorithms estimated risk more accurately than Framingham, but produced only a marginal improvement in screening performance.
Adding further risk factors to the ones used commonly by all algorithms (such as family history of CVD or C-reactive protein) has little effect on screening performance. For example, when events were simulated according to Reynolds risk, the screening performance using the SCORE algorithm is only slightly poorer than that using the Reynolds risk algorithm, despite using fewer risk factors (a detection rate of 72% for SCORE and 74% for Reynolds risk at a 20% false-positive rate). Indeed, as previously shown, adding risk factors such as blood pressure and cholesterol to age has little effect on screening performance. 6
Absolute risk estimation can be important in informing individuals since it is likely to influence whether they take preventive action. But an individual whose 10-year risk of CVD is 22% is unlikely to act differently if told, incorrectly, that their risk is 19% or 25%. The emphasis on improving the accuracy of individual absolute risk estimation through the development of risk algorithms has attracted disproportionate attention.
Risk estimation is a means to an end, and is not the end in itself. The use of cardiovascular risk algorithms should focus more on risk reduction, for which simple, cost-effective methods for providing lifestyle advice and preventive treatment to those who need it are required. More complex algorithms and risk scores should be put aside since they are not necessary and concentrate too much on measurement instead of on disease prevention.