
Abstract
Background
Evidence that mammography screening reduces breast cancer mortality derives from trials, with observational studies broadly supporting trial findings. The purpose of this study was to evaluate the national mammographic screening programme, BreastScreen Australia, using aggregate screening and breast cancer mortality data.
Methods
Breast cancer mortality from 1990 to 2004 in the whole Australian population was assessed in relation to screening exposure in the target of women aged 50–69 years. Population cohorts were defined by year of screening (and diagnosis), five-year age group at screening (and diagnosis), and local area of residence at screening (and diagnosis). Biennial screening data for BreastScreen Australia were related to cumulated mortality from breast cancer in an event analysis using Poisson regression, and in a time-to-event analysis using Cox proportional hazards regression. Results were adjusted for repeated measures and the potential effects of mammography outside BreastScreen Australia, regionality, and area socio-economic status.
Results
From the adjusted Poisson regression model, a 22% (95% CI:12–31%) reduction in six-year cumulated mortality from breast cancer was predicted for screening participation of approximately 60%, compared with no screening; 21% (95% CI:11–30%) for the most recently reported screening participation of 56%; and 25% (95% CI:15–35%) for the programme target of 70% biennial screening participation. Corresponding estimates from the Cox proportional hazard regression model were 30% (95% CI:17–41%), 28% (95% CI:16–38%) and 34% (95% CI:20–46%).
Conclusions
Despite data limitations, the results of this nationwide study are consistent with the trial evidence, and with results of other service studies of mammography screening. With sufficient participation, mammography screening substantially reduces mortality from breast cancer.
INTRODUCTION
Estimates from randomized controlled trials (RCTs) of the reduction in mortality from breast cancer attributable to invitation to screening mammography have been of the order of 30% if screening participation reaches 70% of the target population. 1,2 Mammography service studies have produced similar overall estimates of screening effect: from 20% 3 to 44% 4,5 in cohort studies, with a non-RCT comparative study showing a breast cancer mortality reduction of 33%. 6 When results of studies with known screening participation rates were combined with those of effects attributable to screening invitations (intention-to-treat analysis), an overall mortality reduction of 32% was estimated in screening participants. 7
In Australia, screening mammography is provided without direct charge to women aged 50–69 years. All women in this age group are actively recruited to screen biennially. Following piloting in 1988–89, the screening programme, known as BreastScreen Australia, was launched in 1991 and reached full geographic coverage across all states in 1995. 8 Nationally, biennial screening participation rates in 1996–97 were 52%, then increased to 57% by 2000–01 and 2001–02, and have remained in the 55–57% range from 1997–1998 to 2007–2008. 9 After reaching screening plateaux following extension of geographic coverage, participation by jurisdiction has been more variable: Western Australia reached peak participation in 2006–07 (58%); Queensland plateaued over 2000–05 (59%); Tasmania plateaued during 1999–2001 (60%), and South Australia in 2001–2003 (64%); NSW peaked in 2007/08 (56%), and in Victoria participation plateaued between 1999 and 2005 (58%). 9–11 In the Northern Territory the programme commenced in 1996 and screening participation peaked in 1997–98 (49%), while in the Australian Capital Territory screening peaked at 60% in 1997–98. Screening rates have since declined from these maxima.
The present study originated as the mortality component of an evaluation of mammography screening in Australia, commissioned by the Australian Government Department of Health and Ageing. 12 A national observational study based on linking individual records of mammography screening with cancer incidence and mortality was not practicable for various reasons, inter alia differing privacy and confidentiality provisions in the various Australian states. Consequently, the authors conducted a whole-of-population aggregate study which used mammography screening, breast cancer and population data which were available by five-year age group, year, and local government area of residence or equivalent.
The question addressed in this study is: to what extent has the BreastScreen Australia programme contributed to the reduction in breast cancer mortality in the Australian female population?
METHODS
Study design
The study was a small-area analysis of the association between breast cancer mortality and biennial mammography screening participation (with BreastScreen Australia) from 1990 to 2004 using an aggregate cohort design. Each breast cancer death was allocated to a cohort population defined by year of diagnosis, five-year age at diagnosis and small area of residence at diagnosis. Counts of deaths in these cohorts were identified with counts in corresponding denominator populations defined for the same small area, five-year age group and year. Breast cancer deaths were analysed in relation to biennial screening participation in the denominator population at the time (year) of diagnosis. The denominator populations were used as offsets in Poisson regression modelling and as censored observations in proportional hazards regression modelling. The main factors included in the analysis which potentially can affect the relationship between aggregate screening participation and aggregate breast cancer mortality by small area of residence were: five-year age group at screening (and diagnosis); an aggregate measure of mammography screening outside the BreastScreen Australia programme, and indicators of remote location and socio-economic status based on area of residence.
Data collation
Small areas were used to define the units of analysis and were based on Statistical Local Areas (SLAs), Local Government Areas (LGAs) and postcodes. SLAs in Australia are usually identical to LGAs, but sometimes two or more may constitute an LGA. The small areas used in the analysis depended on compatibility of geo-coding across datasets and time in addition to changes to SLA/LGA boundaries themselves, including numerous splits, amalgamations and the creation of SLAs and LGAs over time. As a result, combinations of both SLAs and LGAs were used as the units of analysis. These numbered 1,100–1,300 across Australia over the study period, with numbers varying according to each geographical entity at the commencement time for each cohort. A measure of the geographical remoteness of these areas was based on the seven-category Rural, Remote and Metropolitan Area (RRMA) classification system used in the 1990s. 13 This classification was adopted, rather than others which replaced it, because the study was essentially historical and the RRMA classification had been used for resource allocation for health services during the period of this study. Also, the small area entities could be more easily classified by the RRMA system.
BreastScreen Australia data were provided by the Australian Institute of Health and Welfare (AIHW) as de-identified unit records of participation for 1990–2004 by women aged 50–69 years, by SLA or LGA and postcode of residence, sourced from the individual State and Territory mammography screening programmes.
Incidence-linked breast cancer mortality data, as determined at death certification by State and Territory Registrars of Births, Deaths and Marriages were obtained from the National Cancer Statistics Clearing House at the AIHW which linked deaths with incidence data sourced from State and Territory cancer registries. These data were provided by five-year age group, year of diagnosis and year of death for 1990–2004 among women aged 50–69 years at diagnosis, and by SLA/LGA of residence at the time of diagnosis. Of 37,181 breast cancer deaths recorded as occurring in 1990–2004 inclusive, 33,762 (90.8%) were successfully matched to a year of diagnosis. Of these, 23,871 (70.7%) were diagnosed in 1990 or later (following the advent of the screening), of which 21,812 (91.4%) were assignable to a SLA/LGA at diagnosis.
Most of the data losses at this stage were breast cancer deaths which could not be assigned a SLA/LGA from the postcode information available. Of the 21,812 deaths, 8,956 (41.1%) occurred in women who were aged 50–69 years at diagnosis. Due to the privacy provisions, the breast cancer deaths were provided to the investigators in aggregated form.
Population denominators by year, SLA/LGA and five-year age group, based on census data and inter-census estimates, were obtained from the Australian Bureau of Statistics (ABS).
Diagnostic (non-screening) mammography data were obtained from Medicare Australia, the universal health insurance system for all Australian citizens and permanent residents. Medicare is supposed to subsidise only diagnostic mammography, however, it is considered that a proportion of reimbursed bilateral mammograms are de facto screening. Evidence of the de facto screening component of Medicare mammography derives from the decline in trend in Medicare mammography that accompanied the implementation of BreastScreen in NSW. 14
Medicare Australia provided aggregate Medicare mammography data by SLA or postcode of residence by calendar year 1991 to 2007, by five-year age group for women aged 50–69 who had a bilateral mammogram (Medicare item number 59300) at least once in a given year. Biennial rates of Medicare mammography by five-year age group, year of mammogram and small area of residence were estimated from counts of women having a Medicare-subsidised bilateral mammogram at least once in the given year, plus the number for the previous year, divided by the population for the given year. That is, they were derived for the same two-year period as for biennial screening participation in the BreastScreen Australia programme.
Socio-Economic Indexes for Areas (SEIFA) 15 indicating relative socio-economic disadvantage of SLAs derived from census information (1991–2006) were obtained from the ABS. The SEIFA Index of Education and Occupation (IEO) was the area-based socio-economic variable chosen for this study, rather than other indices which focus on income and wealth. Mammography screening through the BreastScreen Australia programme is provided without direct charge and therefore market- or resource-based indicators would be expected to have less bearing on screening participation than indicators relating to education and occupation which might influence knowledge, attitudes and health behaviours.
Breast cancer mortality, BreastScreen Australia screening, Medicare mammography and population denominator data over the study period were originally coded using differing editions of the coding system for Australian SLAs and LGAs (Australian Standard Geographical Classification). Of approximately nine million unit screening records provided by BreastScreen Australia, six million had no SLA/LGA codes but had postcodes that could be mapped to SLA/LGAs for the correct period. Approximately 500,000 screening records could not be assigned a SLA/LGA, mostly due to the postcode corresponding to post offices, postal or occupational centres (e.g. universities), which have no corresponding population denominators.
Small area information was re-coded to be as consistent as possible over time. Approximately 2% of the small areas were excluded because either BreastScreen Australia or Medicare mammography data exceeded 100% of the population estimate.
Statistical analysis
The breast cancer cohorts for each screening/diagnosis year had different maximum periods of follow-up. The cohorts diagnosed in 1990 had a maximum possible follow-up to death of 15 years after diagnosis; the 1991 cohort a possible follow-up of 14 years; and so on to the 2004 cohort, which had a maximum follow-up of one year (2004). The biennial screening rate for a given year was defined as the number of women screened at least once in that or in the previous year, divided by the population for the given year. Subsequent mortality was analysed as a cumulated number of deaths at six years using Poisson regression, and in a time-to-event analysis using proportional hazards regression. The six-year follow-up used in the Poisson approach was the result of preliminary analyses that showed six years to be the period of accumulation with the highest correlation and largest parameter estimate for association between screening participation and breast cancer mortality (Table 1). This allowed for nine annual cohorts covering the years 1990–98 to be followed up. The proportional hazards regression approach, by contrast, has the advantage of being able to use all deaths from a diagnosis year onward.
Poisson regression estimates of relative risk of cumulated breast cancer mortality1 in relation to BreastScreen Australia participation2
1In women aged 50–69 years at diagnosis/screening in 1990–2004
2Biennial participation rate as a percent
3Adjusted for age and Medicare mammography
4Standard errors from repeated measures analysis
Variables with the potential to affect the results, and included in the analyses, comprised: age at diagnosis; bilateral Medicare mammography; region of residence, as indicated by RRMA classification of the SLA/LGA of residence at diagnosis; and the socio-economic indicator, also based on the SLA/LGA of residence at diagnosis.
Breast cancer mortality was analysed as counts of deaths over subsequent years from the year of diagnosis, with the population of each stratum of SLA/LGA, age group, and year of screening (or diagnosis) used as the offset in Poisson regression modelling, or as censored observations in proportional hazards regression modelling. Breast cancer deaths where the original breast cancer diagnoses occurred outside the given diagnosis/screening year were excluded.
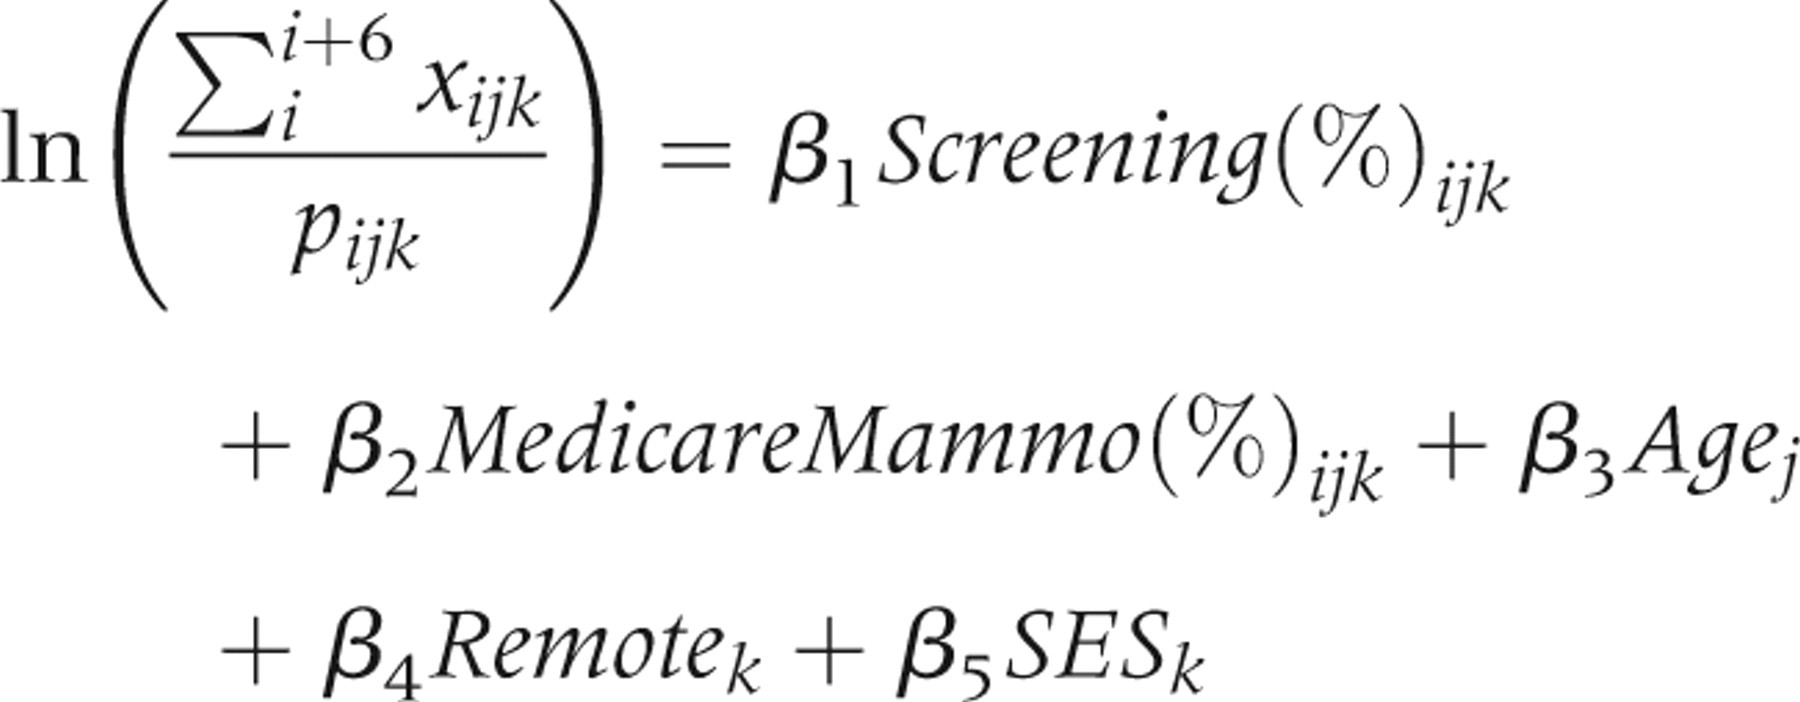
The full Poisson model was,
The proportional hazards approach used was not a survival study of incident breast cancer cases but of denominator populations, as in an actuarial or life-table analysis
16
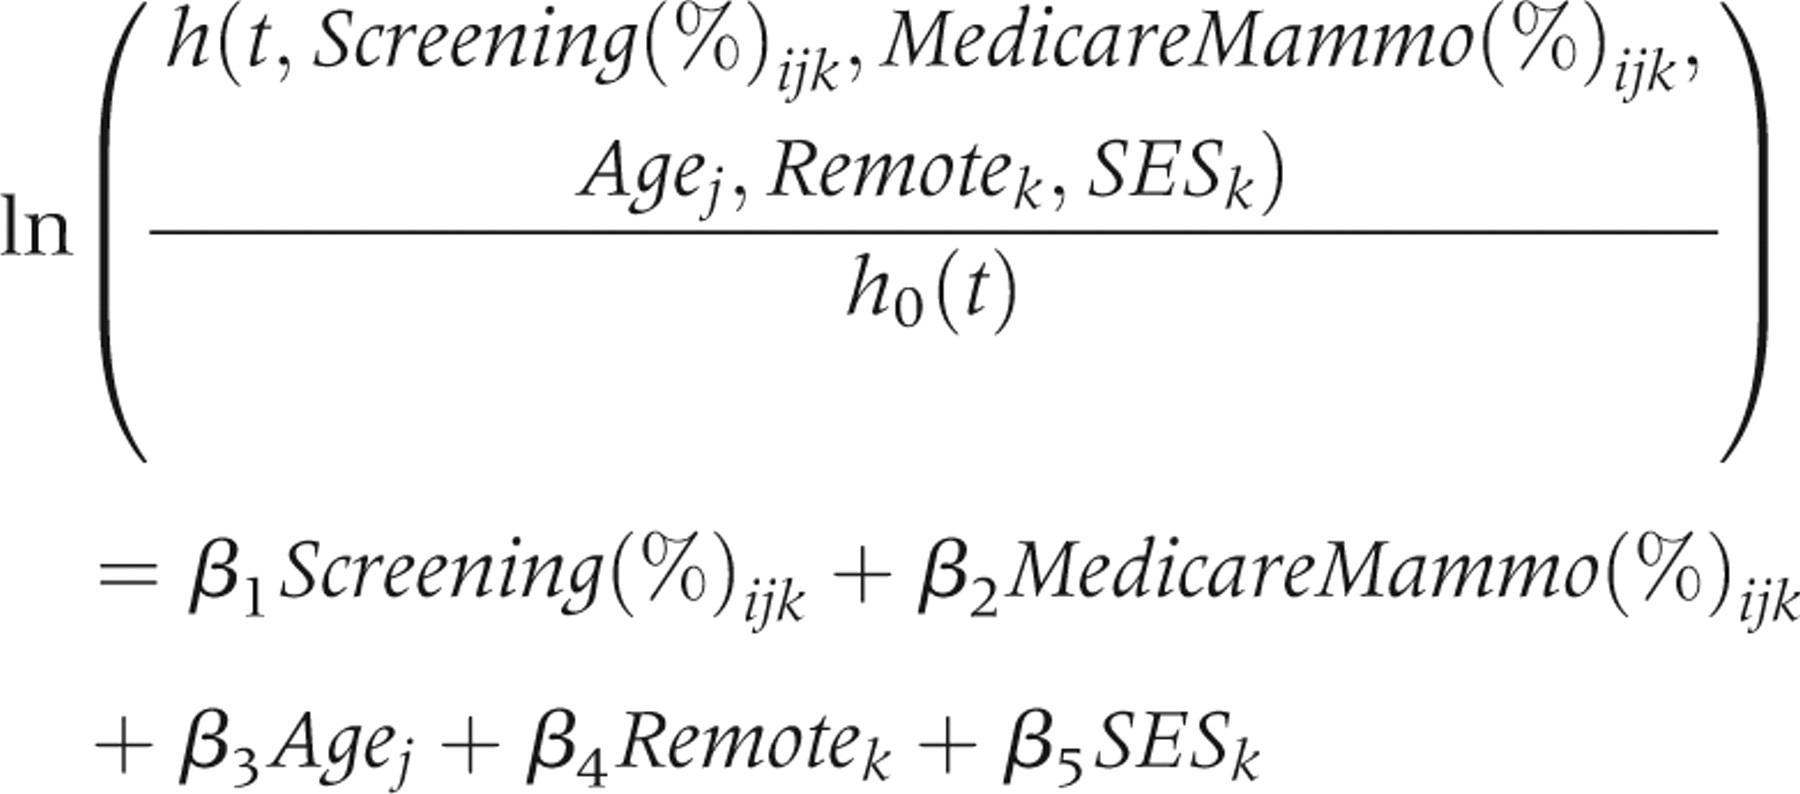
, but with only breast cancer deaths. The explanatory variables were the same as for the Poisson model. Thus the Cox proportional hazards regression model was,
Each time-to-event interval was weighted by the number of breast cancer deaths that occurred from a given diagnosis year in the subsequent year of death defining the interval. For example, if five women diagnosed with cancer in a given SLA/LGA in 1992 had died in 1995, then five would be the weight assigned to the four-year interval 1992–1995. The time-to-event stratum of censored observations comprised the denominator population at the year of diagnosis minus the number of breast cancer deaths occurring in the intervening years prior to each follow-up year. Thus, censored observations comprised all women in the denominator population regardless of their cancer status or death from non-breast cancer causes.
In the Poisson modelling approach approximately 46,800 individual cohorts were available for follow-up and analysis (≈1300 SLA/LGAs × 4 5-year age groups × 9 years of diagnosis), while in the proportional hazards regression approximately 78,000 cohorts were used (≈1300 SLA/LGAs × 4 5-year age groups × 15 years).
As mortality and screening rates were compared repeatedly year by year for a given SLA/LGA, as well as between SLA/LGAs, a repeated measures analysis was undertaken. Six-year cumulated breast cancer mortality was modelled in a generalized linear modelling framework (Proc GENMOD) with a Poisson error distribution using SAS (v. 9.1.3). The Poisson model produced standard errors for the screening effect estimates, both unadjusted and adjusted for repeated SLA/LGA measures, the latter using the generalized estimation equation approach. The proportional hazards regression package (Proc TPHREG) in SAS (v. 9.1.3) lacked a repeated measures adjustment capability, and an alternative approach was adopted: the ratio of the repeated-measures adjusted to unadjusted standard error of the Poisson regression estimate was used to inflate the standard errors of the respective Cox proportional hazard regression estimates, which were then used to produce approximate adjusted 95% confidence intervals for the proportional hazards regression estimates.
Relative risk (RR) or hazard ratio (HR) estimates obtained by exponentiating the estimates for β1 relate changes in mortality, ΔMort(%), to changes in screening participation rate (scrnrate) as follows,

The estimated percentage change in breast cancer mortality is presented for screening rates of 56%, which approximates the most recent BreastScreen Australia participation; 60%, and 70%, the BreastScreen Australia target, equivalent to that achieved in mammography screening trials. Because the small geographic areas used in this study had a wide range of participation rates, extending to close to 100%, estimates for 0–100% screening are also presented graphically.
RESULTS
From the Poisson regression analysis adjusting for age only, the estimated effect of screening on breast cancer mortality was −0.0034 (Table 2). This was equivalent to a RR of ≈ 0.997 (95% CI: 0.995–0.999) for each percent change in screening participation. This corresponds to an 18% (95% CI: 8–28%) reduction in breast cancer mortality for biennial participation of approximately 60%; and a 21% (95% CI: 10–31%) reduction in breast cancer mortality for the 70% screening participation target.
Breast cancer mortality reduction in relation to BreastScreen Australia participation1 using Poisson2 and proportional hazards regression, women aged 50–69 years,3 1990–2004
1Biennial mammography
2Mortality cumulated over six years following diagnosis
3In women aged 50–69 years at diagnosis/screening
†Standard error from repeated measures analysis
‡Approximate standard error from repeated measures analysis
The addition of Medicare bilateral mammograms to the Poisson model increased the estimated screening effect on breast cancer mortality to −0.0041, equivalent to a RR of ≈ 0.996 (95% CI: 0.994–0.998). Addition of remoteness and socio-economic status (SES) variables to the model did not change the screening effect estimate. The fully adjusted model for 50–69-year-old women indicated a reduction in breast cancer mortality of 21% (95% CI: 11–30%) for the most recently reported screening rate of 56%. For 60% screening participation the mortality reduction was estimated as 22% (95% CI: 12–31%), and as 25% (95% CI: 14–35%) for the 70% screening participation target (Table 2). Estimates for other rates of screening participation are shown graphically in Figure 1. Similar estimated effects of screening were obtained for each five-year age group within the 50–69 year age range, with the strongest effect size found in the 60–64 year age group (at diagnosis) of 24% mortality reduction at 60%, and 28% reduction at 70% screening (Table 3).
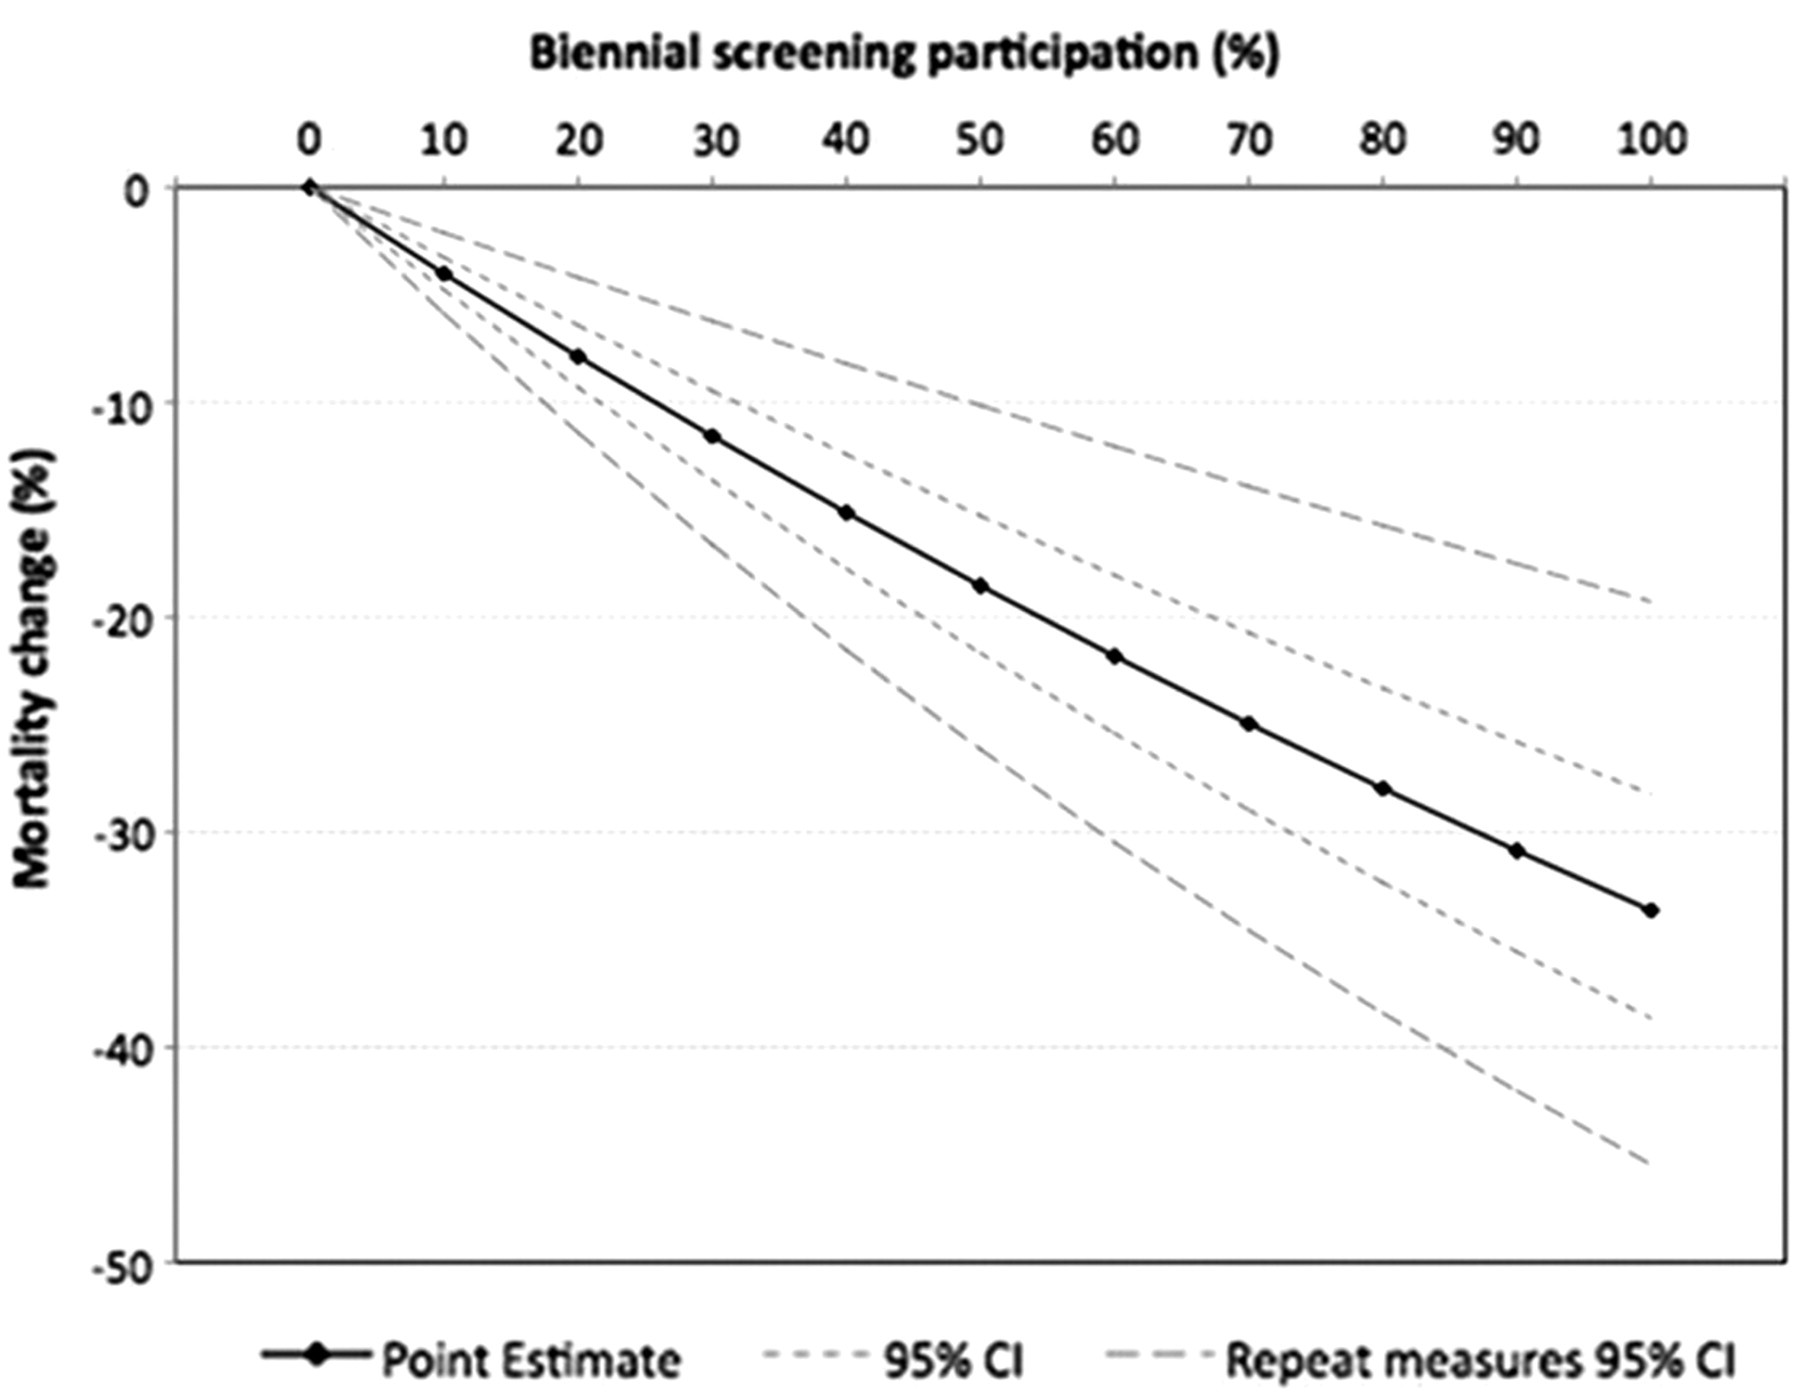
Change in cumulative breast cancer mortality (%) at six years in relation to BreastScreen Australia biennial mammography, 50–69-year-old women, 1990–2004; from Poisson regression.*
Breast cancer mortality reduction in relation to BreastScreen Australia participation using Poisson1 and proportional hazards2 regression, by age group, 1990–2004
1In women aged 50–69 years at diagnosis/screening in 1990–1999, mortality cumulated over six years following diagnosis
2In women aged 50–69 years at diagnosis/screening in 1990–2004
3Adjusted for age, Medicare mammography, region and area-based socio-economic status
4From repeated measures analysis
The Cox proportional hazards regression approach produced larger estimates of screening effect (Table 2). Adjusting for age only, the estimated screening effect was −0.0053, equivalent to a HR of ≈0.995 (approximate 95% CI: 0.992–0.997) for each percent screening participation. This corresponded to a reduction in mortality from breast cancer of 27% (approximate 95% CI: 13–40%) at 60% screening participation; and a reduction of 31% (approximate 95% CI: 14–45%) for the 70% screening target.
In contrast to the Poisson model, the inclusion of Medicare bilateral mammograms in the Cox model had little effect on the screening effect estimate, whereas inclusion of region and SES variables increased the effect size. After adjusting for five-year age group, Medicare bilateral mammograms, region and socio-economic status, the estimated mortality reduction was 30% (approximate 95% CI: 17–40%) at the participation rate of 60%; and a reduction of 34% (approximate 95% CI: 20–46%) for the 70% screening target. Estimates for other screening participation rates are shown in Figure 2. For the most recently reported screening participation of 56%, the estimated breast cancer mortality reduction was 28% (95% CI: 16–38%). Similar findings were obtained for each five-year age group (at diagnosis) within the 50–69-year age span, again with the largest estimated effects occurring for the 60–64-year age group, of 37% for 60% screening participation, and 42% reduction for 70% screening participation (Table 3).
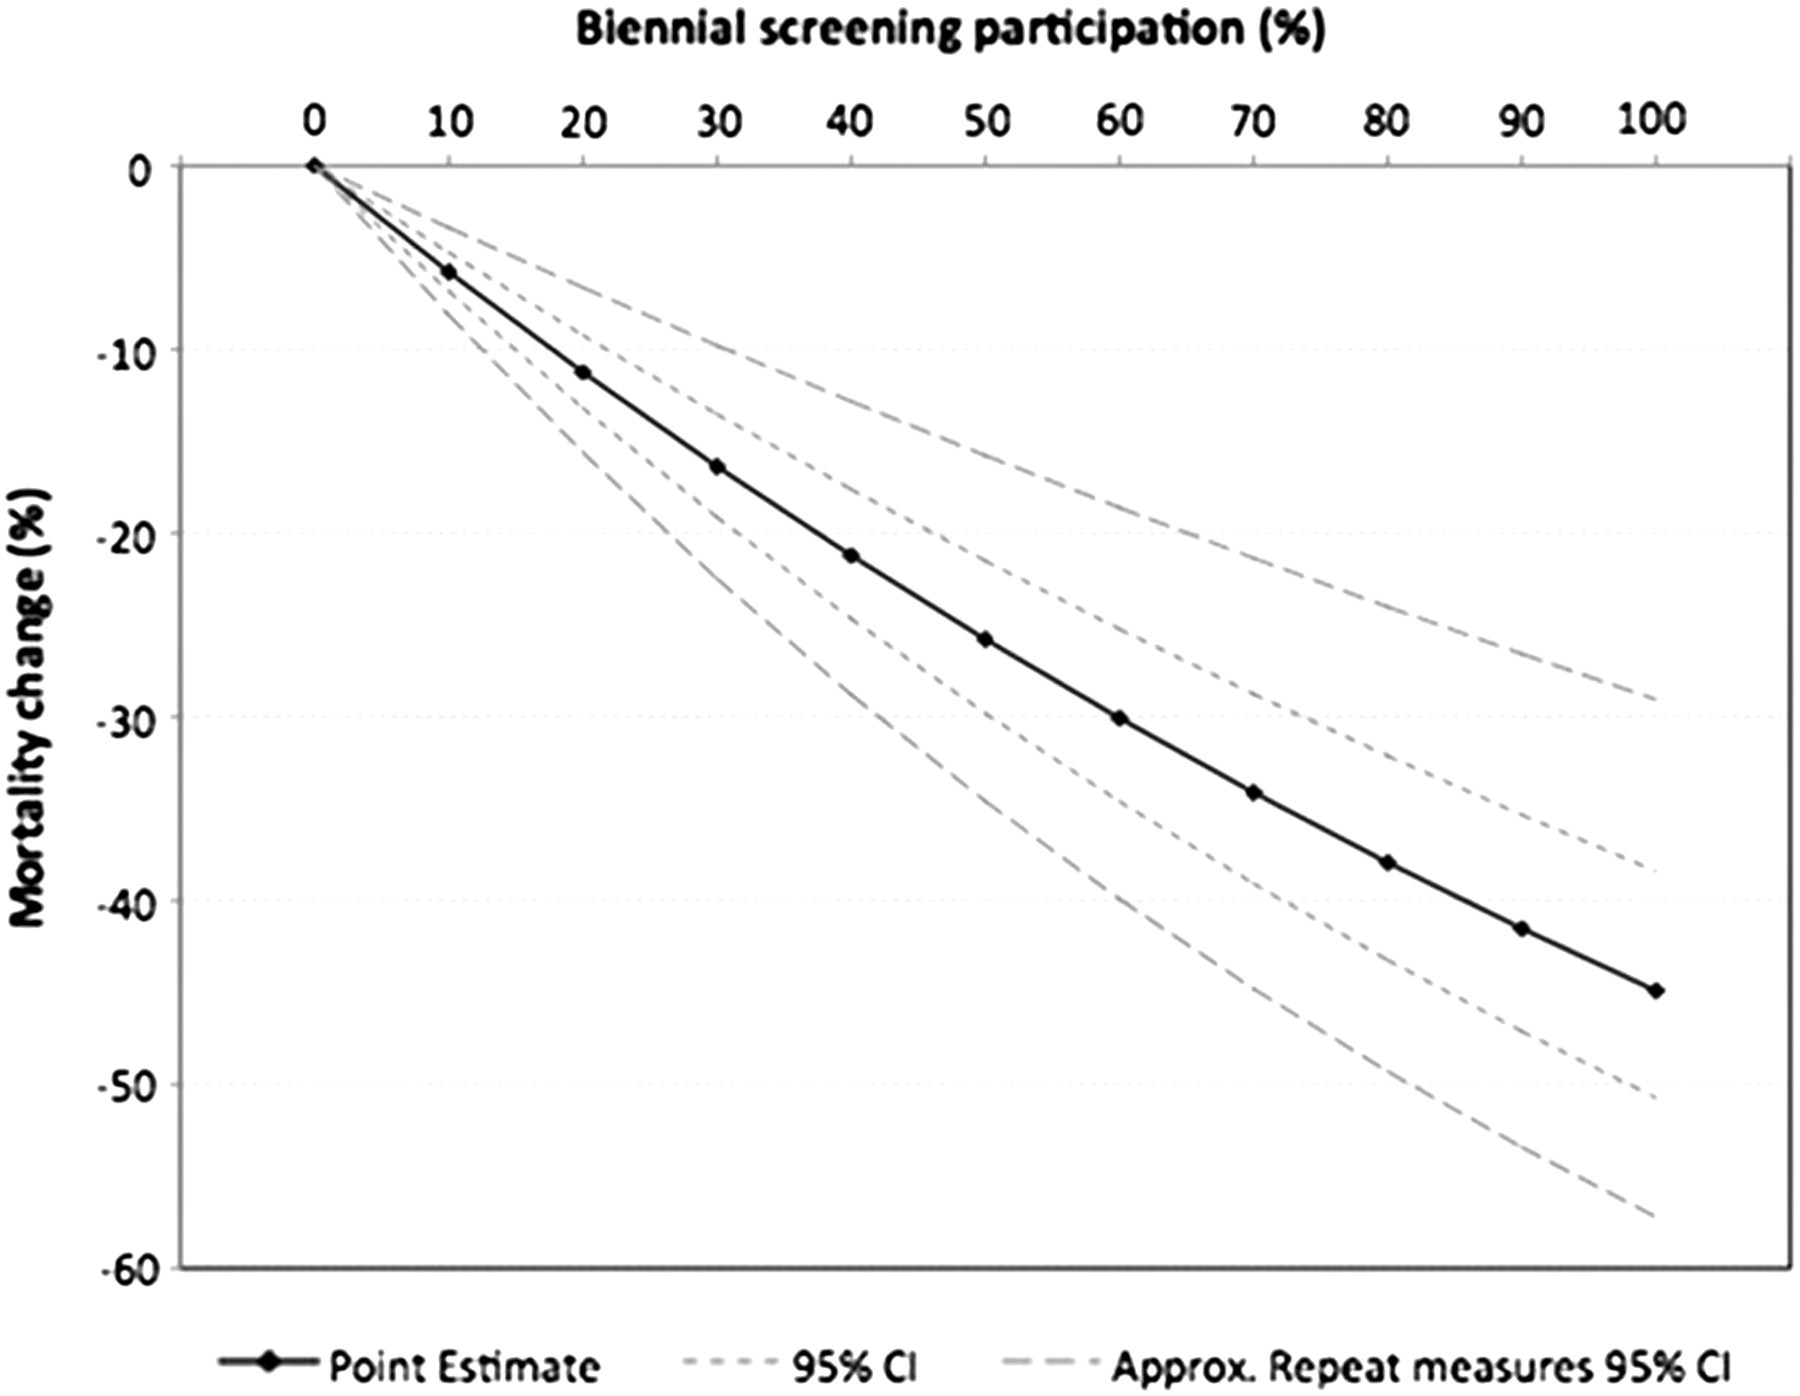
Change in breast cancer mortality (%) in relation to BreastScreen Australia biennial mammography, 50–69-year-old women, 1990–2004; from proportional hazards regression*
Analyses for 1995–2004, after mammography screening was fully implemented in Australia produced similar results, for example an estimated 18% mortality reduction at 60% screening was found using the Poisson approach (results not shown).
DISCUSSION
The results indicate that for 50–69-year-old women, participation in biennial screening through BreastScreen Australia is associated with an approximate 21–28% reduction in breast cancer mortality at the most recent national screening participation rate of 56%. The predicted breast cancer mortality reduction for the screening participation target of 70% is 25–34%. The proportional hazards regression model produced larger estimates of effect than the Poisson model of breast cancer mortality when cumulated to six years after diagnosis.
The present study is an incidence-based aggregate study using annual population cohorts which comprise women diagnosed with breast cancer in that year plus the remaining female population for that year, and the units of analysis are five-year age groups of populations of these women resident in small areas in Australia. The study factor is biennial participation in BreastScreen Australia in these populations, and the outcome factor is subsequent breast cancer mortality in the same population cohorts. Screening was assessed in a given year and area with regard to subsequent breast cancer mortality in cohorts defined by the age of decedent when their breast cancer was diagnosed, not at death. The corresponding living population in the year and area of diagnosis/screening serves as the offset denominator for Poisson regression analysis, and as censored observations in the proportional hazards analysis.
While aggregate studies can provide overall associations in populations, inferences of individual effects must be made with care to avoid cross-level bias. This effect, sometimes termed the ‘ecological fallacy’, 17 occurs when associations at population and individual levels are different, i.e. an effect seen at the population level would not necessarily be observed if the study were conducted using individual data (or vice versa). However, population-level associations may be similar in direction and magnitude to individual associations, especially where there are accurate and appropriate measures of putative causes and effects, and when appropriate adjustment has been made for the effects of factors which may influence the association under investigation. Indications that the present study is not affected substantially by cross-level bias from its aggregate (ecological) design are the consistency of results with individual-based studies.
An ecological survey by Autier et al. of breast cancer mortality reductions in 30 European countries noted significant variation by country in relation to screening, and that the greatest reduction in breast cancer mortality occurred in women <50 years, outside the screening target age range in most countries. 18 A later study by the same authors, of neighbouring European countries with differing implementation times of organized mammography screening, noted similar secular breast cancer mortality trends in the comparison countries despite differing screening implementation and the greater mortality improvement in the younger age group. 19
The main issue not addressed in these broad-brushed country comparisons of breast cancer mortality trends with mammography screening implementation is that the recording of informal mammography screening prior to programme implementation is poor and mammography screening is implicitly assumed to be non-existent prior to the population-based screening programme. Neither of these studies attempted to analyse breast cancer mortality in relation to measures of screening exposure, nor attempted to control for confounders.
The results presented here are consistent with both trials 20 and service studies. 7,21 Also, case-control studies have estimated 37% lower breast cancer mortality in screened women compared with unscreened women. 22–24 From the models used in the present study, a screening participation of 100% would be expected to reduce breast cancer mortality by 33% from the Poisson regression approach (Figure 1), and by 45% from the proportional hazards approach (Figure 2).
Previous Australian studies have estimated breast cancer mortality reductions associated with screening. An aggregate study in New South Wales (NSW) Australia analysed breast cancer mortality rates in 50–69-year-old women using BreastScreen NSW biennial screening participation rates lagged by four years across SLAs/LGAs in the same age group and predicted a breast cancer mortality reduction of 32% (95% CI: 17–45%) if screening participation was 70%, and 43% (95% CI: 23–57%) with 100% screening. 25 This study was not incidence-based and included breast cancer mortality stemming from breast cancers diagnosed prior to screening. Nonetheless it still showed a significant negative correlation between breast cancer mortality and prior screening exposure at a small area level.
A case-control study in South Australia of all breast cancer deaths in 45–80-year-old women recorded for 2002–2005, from cases diagnosed from 1994 following the commencement of screening, also showed significant mortality reduction associated with screening. 23 Each case was compared with three controls selected at random from electoral rolls and matched by date of birth. Screening histories for cases and controls were ascertained individually from the BreastScreen register for the periods preceding diagnosis. This study adjusted for metropolitan/non-metropolitan place of residence, socio-economic status of residential postcode, and geographic remoteness. Results indicated a 41% (95% CI: 26–53%) lower risk of breast cancer death among BreastScreen participants than non-participants. This difference decreased to close to 30% when adjustment was made for possible screening selection bias.
The latest Cochrane systematic review (2011) estimated a reduction in breast cancer mortality in women invited for screening aged ≥50 years of 12% from ‘optimally randomized’ trials after seven years follow-up, 33% from ‘sub-optimally randomized’ trials, and 28% overall. 20 At 13 years follow-up, these reductions were 6%, 30% and 23%, respectively. The low estimates for the optimally randomized trials are due entirely to the inclusion of the Canadian trial in this group, which showed a 3% breast cancer mortality reduction at seven years and a 2% mortality excess at 13 years follow-up. 26,27 A critique of an earlier version of the Cochrane review, conducted by the same authors, remains valid: 28 optimal randomization is no guarantee against compromised study execution. Moreover, the Canadian trial has been the subject of significant criticism for, inter alia, inadequate randomization, particularly where assignment to treatment or control occurred after the results of physical examination were known, 28 and the quality of its radiological reading. 29 Finally, as the control group (in 50–69-year-old women) had breast examination by a trained nurse or practitioner, the Canadian trial should not have been considered for a systematic review of screening mammography versus no screening.
A strength of the present study is that it is Australia-wide and the estimated effect is for the BreastScreen Australia programme nationally. The level of aggregation was fine enough (LGA year x age group) to provide sufficient variability of screening participation and breast cancer mortality to obtain reliable estimates over a wide range of service settings. In the Poisson modelling approach, approximately 46,800 individual cohorts were available for follow-up and analysis, while in the proportional hazards regression approximately 78,000 cohorts were used.
A limitation was the variable quality and consistency of data that had been collected from multiple sources over a long period, often primarily for administrative purposes. However, of breast cancer deaths occurring after 1990, 91% were assignable to an incident case and 91% assignable to a LGA. Approximately 500,000 from ≈9,000,000 screening records (5.6%) could not be assigned a SLA/LGA, mostly due to postcodes corresponding to postal or occupational centres (e.g. universities) which have no corresponding population denominators. If it is assumed that such screens are more likely to be of higher SES or professional women who would be expected to have a higher risk of breast cancer mortality, then this would bias the results toward screening, because mortality from most of these women would have been recorded for a given SLA/LGA but their screening mammography at the time of breast cancer diagnosis would not have been. While it is difficult to quantify the extent of bias from this source, it is also expected to be small due to the relatively small proportion of screens (5.6%) with no matching denominator population.
Another limitation was that data on many potential confounders, for example treatment modality or reproductive factors which may influence breast cancer mortality, were not available in these data sets.
Breast cancer treatment improvements have been cited as contributing more to breast cancer mortality declines occurring since the 1990s than mammography screening, 30 including an estimation in Australia. 31 The Australian study attributed most of the reduction in breast cancer mortality to tamoxifen therapy and not mammography screening. 31 However, this aggregate study examined breast cancer mortality trends overall without regard to when the breast cancers were diagnosed. Consequently a component of the breast cancer mortality in the screening epoch would have been from cancers diagnosed before screening. In the Netherlands, a more sophisticated simulation of the efficacy of tamoxifen attributed its contribution to breast cancer mortality reduction to around 7% compared with the screening's independent reduction of 28–30%. 32 A study of breast cancer mortality, based on individual cases with known tumour status and mode of detection (in Florence and Turin), showed improved prognosis in cases detected from screening to be related to earlier stage at diagnosis and not differences in treatment. 33
The present study has examined breast cancer mortality from cancers diagnosed in the screening epoch only, and because screening participation has varied over small areas and time, treatment advances would also have had to co-vary with participation rates to significantly confound the association between screening and breast cancer mortality found here. Moreover, as indicated in the results section above, similar results were found for 1995–2004, after tamoxifen therapy in Australia had become widespread.
A source of measurement error is that Australian data show lower breast cancer incidence and mortality in women born in non-English speaking countries than in Australian-born women, 34 but BreastScreen Australia data show that women who speak a non-English language at home also have lower screening participation. 11 Such lower screening participation and lower breast cancer mortality in areas with higher non-English speaking populations would tend to bias estimates of the screening effect downwards.
Other effects associated indirectly with screening may also have contributed to the reductions in mortality from breast cancer and may also co-vary with screening participation. For instance, promotional and ripple effects of the BreastScreen Australia programme may lead to increased awareness of breast cancer, higher rates of clinical detection and diagnosis, and consequent improved treatment outcomes, which could well vary in the same way that screening participation varies. Higher awareness in some women and/or their GPs might increase the likelihood of having a (de facto) screening mammogram through Medicare (outside BreastScreen Australia). Such indirect effects, however, are difficult to measure.
Poisson regression is a conventional approach for analysing such data, however, it has the disadvantage of excluding more recent screening and diagnosis events. Proportional hazards regression, also using aggregate data, allowed analysis of breast cancer mortality cumulated for all periods from the year of diagnosis. This approach has the advantage of including all data with adjustment for variation in follow-up times. Censored observations were the denominator population, regardless of cancer or dead/alive status by non-breast cancer causes. The proportional hazards approach used was not a survival study of incident breast cancer cases, but rather it modelled population survival using an actuarial approach for a single cause of death. Although deaths from causes other than breast cancer were disregarded in the analysis, this is unlikely to have caused bias if rates of these deaths were unrelated to aggregate participation in mammography screening.
One disadvantage of the proportional hazards approach was that adjustment for repeated measures for the same small areas was not possible with the SAS module employed in this study (Proc TPHREG, SAS version 9.1), and consequently an approximation was used to estimate standard errors.
Another potential disadvantage is that no allowance for lead time effects was made when modelling time-to-event outcomes. Women diagnosed with breast cancer through screening are more likely to have their survival time artefactually increased by mammographic lead time. However, the cases of breast cancer used in the present study were only those that resulted in death from breast cancer, not all diagnosed breast cancers. Nonetheless, it is possible that this has inflated the effect size estimated by Cox proportional hazards analysis somewhat compared with Poisson regression due to higher proportions of screen-detected cancers in areas with higher screening rates, but this is difficult to ascertain without individual-level data on screening and cancer detection. The proportional hazards estimates can be considered upper level estimates of the screening effect on breast cancer mortality.
Although randomized population-based trials have suggested that measurable effects on breast cancer mortality may not arise for 10 years or more, 23,26,27,35–42 Otto et al. 43 found almost immediate effects of population-based mammography screening in a service study in the Netherlands. Other studies of mammography services have also shown earlier effects than expected from trial data, 44 including the previous NSW study. 25 This is also evident in the present study, where the estimates of screening effect for each period of follow-up were similar (Table 1). Thus, a detectable effect on mortality of screening after six years of follow-up is plausible. Factors responsible for earlier effects estimated in studies of mammography screening services may include: greater statistical precision in large population-wide evaluations than in the trials; inclusion of more symptomatic cases in service studies, but also more immediate benefits from improved treatment environments since the original trials. 4 Longer survival durations in response to treatment improvement for relatively advanced disease is particularly relevant in this regard. 4 Based on the Netherlands experience, and other evaluations of screening services, a detectable effect on mortality of screening after six years of follow-up is plausible.
Service evaluation studies like the present provide only an indication of outcomes attributable to the service, not definitive results. They need to be interpreted with caution in the context of plausibility and against collateral evidence available from original trials and the totality of other service evaluations. However, the estimated mortality reductions associated with screening participation in the BreastScreen Australia programme are broadly consistent with the original trial results 1,2,42,45 and with other evaluations of screening services using differing study designs, 7 including two earlier Australian studies. 23,25 If the BreastScreen Australia programme were to meet its target screening level of 70%, it is estimated that the reduction in breast cancer mortality would be 25–34%.