
Abstract
Objectives
To evaluate the relationship between FAST peak percentage by adapted Bio-Rad Vnbs analysis using the valley-to-valley integration and genotypes with the aim to improve differentiation between severe α-thalassaemia forms (HbH disease) and the milder disease types.
Method
DNA analysis for α-thalassaemia was performed on 91 dried blood spot samples presenting normal and elevated FAST peak levels, selected during three years of Dutch national newborn screening.
Results
Significant differences were found between samples with and without α-thalassaemia mutations, regardless of the genetic profiles. No significant difference was demonstrated between HPLC in -α/αα and -α/-α, between -α/-α and –/αα and between –/αα and –/-α genotypes.
Conclusion
This study confirms that the percentage HbBart's, as depicted by the FAST peak, is only a relative indication for the number of α genes affected in α-thalassaemia. Based on the data obtained using the modified Bio-Rad Vnbs software, we adopted a cut-off value of 22.5% to discriminate between possible severe α-thalassaemia or HbH disease and other α-thalassaemia phenotypes. Retrospectively, if this cut-off value was utilized during this initial three-year period of neonatal screening, the positive predictive value would have been 0.030 instead of 0.014.
Introduction
The clinical pathology of α-thalassaemia varies depending on the number of genes affected and on the type of mutation causing the disease. 3 The most severe type of α-thalassaemia, HbBart's hydrops fetalis (–/–), generally leads to perinatal death with often life-threatening complications for the mother. This form of α-thalassaemia is generally identified during pregnancy. Subsequently, HbH disease or α-thalassaemia with three out of four affected α-globin genes (- -/- α), may cause severe anaemia shortly after birth and may lead to transfusion dependency later in life.4,5 Especially children with a non-deletional HbH disease (Hb Constant Spring) may have growth delay, severe anaemia during infectious illness and require blood transfusion with consequent iron overload. 6 Early detection of this severe disorder by newborn screening leads to improvement of parental information, allows anticipatory prevention, supportive therapy and treatment in case of infectious disease. 7
The association between HbBart's at birth and α-thalassaemia genotype was described in 2006, using HPLC analysis on umbilical cord blood. 8 Based on this observation, newborn screening for HbH disease is included in neonatal screening programmes in several countries. To identify children with HbH disease a cut-off value (COV) of 25% for the HbBart's containing FAST peak is used in California as well as in the United Kingdom, resulting in a positive predictive value (PPV) of 0.88 and 0.36, respectively. However, false-negative cases were not mentioned in these studies9–11 (personal communication; J. Henthorn). The cut-off values used in California and the United Kingdom are based on results of the original software on the Bio-Rad Vnbs. The original software uses valley-to-valley integration and drop-line integration at random and this may cause differences in the estimation of the haemoglobin fractions between two separate analyses of the same sample, resulting in relatively high within and between run coefficients of variation. 12
The Dutch newborn screening programme for haemoglobinopathies was initiated in January 2007 and has a participation of 99.5%, at an annual birth rate of about 185,000. 13 It utilizes the Bio-Rad Vnbs with an adapted integration software to improve the calculation of the haemoglobin fractions, by using only valley-to-valley integration. 12 From 2010 onwards, this adjusted integration will be used worldwide and may influence established cut-off values. Because of the small differences between the two software versions an initially lower COV was chosen in the Netherlands to prevent false-negative results. During the initial three years of neonatal screening in the Netherlands, children with a FAST peak ≥ 20% were referred to the paediatric haematologists for confirmation of the screening result, resulting in 137 positive screening results, with only two children with HbH disease. Most of the false-positive results involved α-thalassaemia trait (-α/-α or –/αα) instead of HbH disease.
The aim of this study is to improve the differentiation between HbH disease and the milder α-thalassaemia forms during newborn screening by evaluating the relationship between the percentage FAST peak based on a Bio-Rad Vnbs analysis using the valley-to-valley integration and established genotype. This knowledge may optimize future screening for HbH disease.
Materials And Methods
Bio-Rad Vnbs
The Bio-Rad Vnbs classifies 14 retention time windows. HbBart's elutes in the ‘FAST’ window, at the beginning of a run as a sharp and narrow peak (peak height total area ≥ 0.0600). Figure 1 shows a typical HPLC result with a FAST peak indicating HbH disease. The peak percentage is calculated by dividing the peak area by the total area of all peaks.
HPLC-chromatogram with Vnbs; result indicates presumptive HbH disease. The chromatogram shows the 14 retention time windows. Gestational age is 38 weeks and three days, blood taken four days postpartum, DBS three days at time of analysis. Left axis = intensity of the peak (Volts); right axis= pump pressure. The characters at the top of the windows indicate the common variants. B = FAST peak HbBart's; F = HbF; A = HbA; E = HbE, D = HbD, S = HbS, C = HbC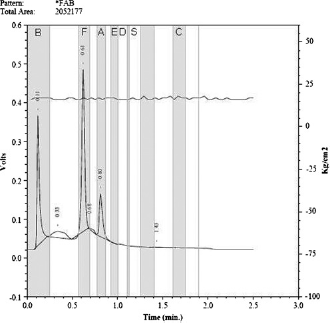
Study Design And Samples
This study was designed to include samples of the entire range of FAST peak percentages. Sample selection resulted in DNA analysis of 91 samples, of which 42 had a FAST peak of at least 20%, 27 had a FAST peak between 10% and 20% and 22 had a FAST peak of less than 10%. The first cohort is over-represented in our study as it was assumed that the mutations causing HbH disease were to be found in samples with at least 20% FAST peak. Therefore children with a FAST peak ≥ 20% were referred to paediatric haematologists for DNA analysis.
From the period between January 2007 and February 2008, 66 samples from the Dutch national neonatal screening programme were selected for GAP PCR analysis at the laboratory of Ospedale Regionale Microcitemie in Cagliari, Italy. These samples included all dried blood spots (DBS) with a FAST peak ≥ 20.0% (n = 17) and a random selection of DBS with a FAST peak below 20% (n = 49). Furthermore, the results of DNA analysis from 25 children, born in 2008 and 2009, referred to the Academic Medical Center in Amsterdam, the Netherlands (AMC) (n = 12) and the Erasmus Medical Center in Rotterdam, the Netherlands (EMC) (n = 13) because of an elevated FAST peak, were included in this study. This selection represents the entire range of FAST peak percentage found during the screening, but is not representative for the Dutch population. The median FAST peak percentage in 2008 was 6.4%, with a 95 percentile of 9.8%, while the median FAST peak percentage in the study population is 19.2% FAST peak.
Blood for DBS was collected between three to seven days after birth (median = 4 days) and analyzed within seven days at one of the five Dutch newborn screening laboratories (Academic Medical Center, Amsterdam; National Institute for Public Health and the Environment, Bilthoven; IJsselland Hospital, Capelle a d IJssel; St. Elisabeth Hospital, Tilburg; Isala Clinics, Zwolle).
Dna Analysis
All samples were analyzed for -α3.7, -α4.2, –MED, –SEA, – α20.5, which are among the seven most prevalent deletions in the Netherlands,14,15 following the protocol for DNA analysis described by Chong et al and Liu et al at the AMC and EMC.16,17 The protocol used at the Cagliari laboratory was published in 1998. 18 Finally, complete sequencing of the α globin gene and/or multiplex ligation-dependent probe amplification (MLPA) was performed on five unexplained samples with an elevated FAST peak and a low MCV at the Hemoglobinopathies Laboratory of Leiden University Medical Center.19,20
Categories
The genetic profiles were divided into five categories:
Median FAST peak percentages found per sample category
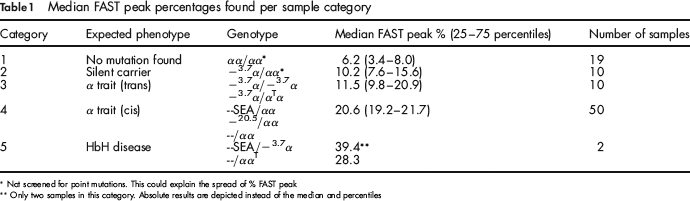
Not screened for point mutations. This could explain the spread of % FAST peak
Only two samples in this category. Absolute results are depicted instead of the median and percentiles
αα/αα No mutation (wild type)
– α/αα Silent carrier α+ heterozygous
– α/– α α trait (trans) α+ homozygous
– – /αα α trait (cis) α0 heterozygous
– –/– α HbH disease α+/α0 compound heterozygous
Statistics
An ANOVA in combination with a Bonferroni test was used to analyze the difference between the results of the genetic profiles. Differences resulting in a P value < 0.05 were considered significant. To create a normal distribution we used the log-FAST-peak percentages for statistical analysis.
Results
Genotyping
The results of genotyping are summarized in Table 1.
In nineteen samples, with a FAST peak between 2.4% and 24.6%, no a globin deletions were found. Ten children (FAST peak 7.3–20.9%) were heterozygous for the – 3.7α deletion, while nine children were homozygous for the same deletion (FAST peak 8.9–35.9%). One α trait (FAST peak = 21.3%) was caused by a combination of the – 3.7α deletion and a new point mutation named Hb Rotterdam. 21 Most samples (n = 46; FAST peak 12.2–30.3%) had a heterozygote –SEA deletion, while one had a -20.5 deletion (FAST peak = 20.9%). Furthermore one child had a deletion between HS-40 and 3.7kb downstream HBA1 (FAST peak = 24.5%) and two children had a deletion between HBA2P and 0.5kb downstream HbA1 (FAST peak 21.7% and 24.1%). Only two children were diagnosed as affected with HbH disease; one with genotype –SEA/-α3.7 (FAST peak = 39.4%) and one with –/ααT (FAST peak = 28.3%) caused by the mutation IVS-I-117 (G- > A) (HBA1:c.96–1G > A) and a deletion between HBZ and 3.7kb downstream HBA1.
Relation Fast Peak And Genotype
To establish the relation between the FAST peak (HbBart's) and the type of α-thalassaemia the differences between the FAST peak percentages for each genetic profile were studied.
The logarithm of the FAST peak percentages of the five genetic profiles were plotted against the categories (Figure 2). From this figure it is clear that the mean log-FAST peak increases with every α globin gene affected. There were significant differences (P < 0.05) between the samples with HbH disease (–/- α) and the categories αα/αα, – α/αα and -α/- α. The differences between the categories -α/αα and -α/-α (P = 1.000), categories -α/-α and –/αα (P = 0.103) and between –/αα and –/-α (P = 0.683) were not significant.
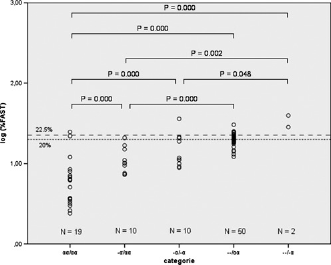
The FAST peak percentages found per genetic profile. The logarithm of the percentages is represented on the Y-axis. The cut-off value of 20% and 22.5% are indicated by a dotted and a dashed line, respectively. Only statistically significant differences (P ≤ 0.05) are shown
Discussion
Our data confirm that, using HPLC technology, the percentage FAST peak, containing HbBart's, can be indicative in neonatal screening programmes for the putative diagnosis of HbH disease. An elevation of the FAST peak percentage correlates with the number of affected α genes. However, probably due to the limited number of – -/-α (n = 2) samples, statistical analysis shows that the – -/-α genotype (HbH disease) cannot be recognized with absolute certainty unless a higher COV is used, which on the other hand may increase the chance of false negatives. In the initial three years of the neonatal screening in the Netherlands a COV of 20.0% FAST peak was used. Using data from a nationwide registration of newly diagnosed patients with a haemoglobinopathy by the Dutch Paediatric Surveillance Unit (DPSU) we can conclude that the sensitivity for HbBart's as well as for sickle cell disease is 100%.13,22,23 The total number of referrals for suspected HbH disease from 2007 through 2009 was 137 with a specificity of 99.99%, with a PPV of 0.014. In the Netherlands, the prevalence of HbH disease is very low and therefore a substantiated specificity and sensitivity is difficult to provide. Unfortunately, no information about the specificity or sensitivity of the BioRad Vnbs regarding HbH screening is provided in the literature. Based on the results of this study and the screening results of the 2007–2009 cohorts the COV for HbH disease was adjusted from 20.0% to 22.5%. This new COV would have lead to a PPV of 0.030 in the cohorts 2007–2009, instead of 0.014 that was found with the cut-off value of 20%.13,22,23 Even a COV of 22.5% is low compared with other international screening programmes, that use a COV of 25%. Reports on these screening programmes do not mention false-negative results. As the screening methods in these programmes are different from the Dutch, a COV of 25% will not be easily accepted in the Netherlands. A COV of 22.5% in the Dutch programme resulted in the referral of 46 children in 2010 and still none of these children had HbH disease. In its initial phase, for the Dutch screening programme a low false-negative rate is preferred over a low false-positive rate, at the expense of more false-positive results, with concomitant issues of parental anxiety and counselling (with the current COV, only 1 in every 68 screen positives is an HbH disease). By strict monitoring, more results will become available in the future, leading to an even more substantiated COV and possibly a better PPV.
Out of the 91 cases reported in this study, 72 were found to be a carrier of one or more α-thalassaemia mutations. No deletions were found in 19 samples, in spite of an elevated FAST peak in some of the samples. The elevated FAST peak in these samples may be caused by one of the many α-thalassaemia point mutations currently found in the Netherlands. 14 High bilirubin (≈275 μmol/L blood and higher) causes an elevation of 1–2% (data not published). Unfortunately, no information on the bilirubin levels of these samples is available.
Furthermore, it is known that degradation of haemoglobin causes a high but broad FAST peak and an elevated baseline, which may hamper the test results. Samples included in this study were analyzed within seven days after blood withdrawal. The degradation during this period can be considered acceptable, with no significant effect on the peak percentages (data not published). During regular screening in the Dutch programme 94% of the samples are received at one of the five screening laboratories and analyzed within four days diminishing the possible influence of degradation. 24
Conclusion
The results of this study show that the correlation between the percentages of the FAST peak, using the Bio-Rad Vnbs with modified integration mode, and the number of affected a genes is a useful tool to screen for HbH disease.
A cut-off value of the FAST peak of 22.5% should allow the identification of HbH disease at birth at a PPV of 0.030.
The small number of true positive cases in this study demands monitoring of the validity of this threshold in the future until sufficient samples with HbH disease are diagnosed to set a substantiated COV.
Footnotes
Acknowledgments
We are grateful to Dr. Wendy Koster (RIVM) for help with the statistical analysis. This study was partially supported by Bio-Rad (Bio-Rad Laboratories, Hercules, CA, USA) who facilitated the DNA analysis done at the laboratory of Ospedale Regionale Microcitemie in Italy.