
Abstract
Background
Self-selection bias is considered to be a problem when evaluating the effectiveness of breast cancer service screening in case-control studies.
Objective
Using the incidence-based mortality method (IBM), a correction factor for the potential influence of self-selection can be derived from a group of non-screened women and a group of not-invited women.
Methods
Breast cancer patients, diagnosed in 1990–1995 and between the ages of 50 to 70, were selected from the Netherlands Cancer Registry and five screening regions in the Netherlands. Person-years were calculated for non-screened and not-invited women by using population data available on the number of women invited, the number of women screened and the total population. Incidence-based breast cancer mortality rates according to screening status were calculated for the five screening regions.
Results
Between 1990–1995, 15,541 patients were diagnosed with breast cancer. An analysis of ten-year follow-up after diagnosis resulted in 3903 breast cancer deaths, of which 2631 were not-invited and 345 were non-screened. Poisson regression analysis showed heterogeneity between the regions with a range of IBM ratios from 0.64 (95% CI: 0.46–0.90) to 1.08 (95% CI: 0.82–1.43).
Conclusions
Heterogeneity between the regions stresses the importance of a country- and/or region-specific estimate of self-selection. Adjusting for self-selection bias in the regional case-control studies would not change the breast cancer mortality reduction in three regions and would result in an even larger effect in two regions. Looking at the range of IBM ratios the overall influence of self-selection in the Netherlands is minor.
Introduction
Results from the literature on the direction of self-selection are, however, inconsistent. Friedman and Dubin found that women who refused screening were at lower baseline risk for breast cancer death compared with a control group. Adjustment for this difference in baseline risk causes a larger screening effect (OR further from 1.0) In contrast, Moss
It is to be expected that the factors underlying self-selection may be different in each country or even region that has implemented service screening. However, several studies have applied a correction factor based on estimates calculated from data from the Swedish and Canadian randomized controlled trials (RCT) by Duffy
When nationwide screening is offered to all women in the target group, a well-defined control group is no longer available. In this situation, the only period from which a control group can be created is directly before the start of the implementation of a screening programme or during the implementation of the screening programme, when part of the target group is still not-invited. The purpose of this study is to estimate a correction factor for self-selection bias from the implementation period of the service screening programme in five regions of the Netherlands, using the incidence-based mortality method (IBM). 15
Methods
Service screening in the Netherlands started in 1989, initially inviting women in the age group 50–69 biennially, and was fully implemented in 1997. In this period nine screening organizations were responsible for the organization of the screening programme. In this study we included five of the regions, namely Stichting Kankerpreventie en – screening Limburg (SKsL), Stichting Kankerpreventie IKA (SKP IKA), Stichting Bevolkingsonderzoek Noord-Nederland (BBNN), Stichting Vroege Opsporing Kanker Oost-Nederland (SVOKON) and Stichting Bevolkingsonderzoek Borstkanker Zuidwest Nederland (SBBZWN). The regions were chosen based on their differences in urban and rural areas, and early and late implementation of the screening programme. These regions included 57% of the breast cancer patients in the age group 50–69 registered in the Netherlands Cancer Registry in the years 1990–1995.
An incidence-based mortality (IBM) rate can be calculated by dividing the number of breast cancer deaths resulting from incident breast cancer cases diagnosed in a specific period with the accompanying number of person-years. The calendar period for calculation of the IBM rate included the years 1990–1995. During the implementation phase of the Dutch screening programme, the female population in the targeted age group shifted from an uninvited population to an invited population, providing us with contemporaneous groups of not-invited and invited-but-not-screened women.
In order to define the numerator of the breast cancer mortality rates, data of breast cancer patients aged 50–69 and diagnosed in the years 1990–1995 were collected from the Netherlands Cancer Registry. The patient data were linked to the screening registries of the five screening organizations to collect information on screening history and vital status. The data were also linked with the Cause of Death Registry held by Statistics Netherlands to obtain cause of death. The breast cancer patients were divided into three groups according to their screening status: not invited for screening before diagnosis (not-invited), invited and screened before diagnosis (screened), invited and not screened before diagnosis (non-screened). Breast cancer patients were defined as not screened after not participating in the most recent invitation to screening before diagnosis. We followed the breast cancer patients for breast cancer death for a maximum of 10 years after date of diagnosis. Screened patients were not followed since this group does not contribute to estimation of the correction factor.
In order to define the denominator of the breast cancer mortality rates, we calculated the person-years for the period 1990–1995 using aggregated data on the total number of invited women, the total number of screened women derived from the screening organizations, and the age-specific total population derived from Statistics Netherlands. In order to divide the person-years in a group of not-invited and a group of non-screened person-years, we calculated the number of person-years during the implementation period of the screening in each municipality separately. The municipality is the smallest possible unit of which the starting date of screening was known. The population data and starting date of screening were determined and used in a previous study by Otto
Results
In total, 15,541 breast cancers were diagnosed in women aged 50–69 in the period 1990–1995. The complete number of person-years for this period was 5,199,451. Of the 8979 not-invited breast cancer patients, 2631 died of breast cancer, whereas of the 968 not-screened patients, 345 died of breast cancer. Table 1 shows patient characteristics of not-invited and non-screened women. The distributions of age at diagnosis (χ2 = 5.03, df = 3,
Age at diagnosis and stage distribution for breast cancer patients divided into non-screened and not-invited patients
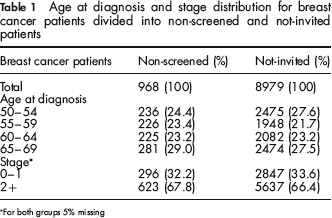
For both groups 5% missing
Data were available from five screening regions in the Netherlands. Poisson regression was used to test heterogeneity between the regions. The model which included the interaction terms of the regions fitted significantly better than the model without the interaction terms of the regions (χ2 = 0.03), which points towards a difference in the degree of self-selection in the five regions.
Table 2 shows an example of the calculation of the IBM ratio in one region, namely the SVOKON region. The IBM rate in the non-screened women, 9.6 per 10,000 person-years, is somewhat higher than the IBM rate for the not-invited women, 8.8 per 10,000 person-years. Dividing those two IBM rates results in an IBM-ratio of non-screened versus not-invited of 1.08 (95% CI: 0.85–1.37), indicating no self-selection in the SVOKON region.
Example of calculation of the incidence-based mortality rates for non-screened and not-invited women in the region of SVOKON
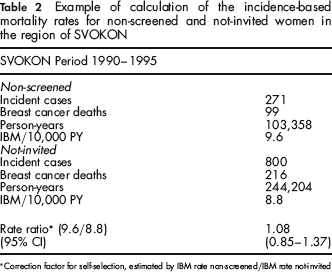
Correction factor for self-selection, estimated by IBM rate non-screened/IBM rate not-invited
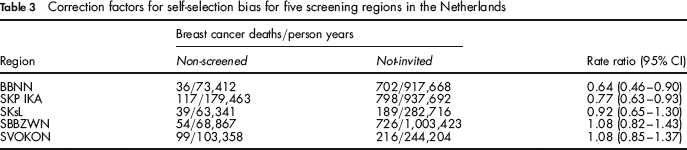
In Table 3, the correction factors and their 95% confidence intervals of all regions are given. As for the SVOKON region, the SBBZWN and SKsL region showed no difference in breast cancer mortality risk between the non-screened and not-invited women. The IBM rate ratio in the BBNN and SKP IKA region is lower than one, indicating a lower breast cancer mortality risk in the non-screened women.
Correction factors for self-selection bias for five screening regions in the Netherlands
Discussion
The heterogeneity between the regions showed that even in a centrally organized screening programme regional differences can be found. Three of the five regions, namely the SBBZWN, SKsL and SVOKON regions, showed no difference in baseline risk in breast cancer mortality in women not participating to the Dutch screening programme compared with a not-invited population. In the BBNN and SKP IKA regions IBM ratios below 1.0 were found, representing a lower baseline breast cancer mortality risk in non-screened to not-invited women. These ratios can be used as regional correction factors for self-selection bias for the odds ratio estimated in a case-control study to evaluate the impact of breast cancer screening on breast cancer mortality. Without correction in these two regions, the estimated breast cancer mortality reduction is slightly underestimated.
Looking at the magnitude of the correction factors and their confidence interval, heterogeneity is most likely a result of the 0.64 (95% CI: 0.46–0.90) in the BBNN region. Reasons why this region is different from the other regions are not known. An explanation may be the higher attendance rate (83.9% compared with 78.9% nationally 17 ) and a difference in underlying background risks for breast cancer mortality; it is the most rural area in this study. Furthermore, the use of aggregated person years could have influenced the heterogeneity. Between 1990 and 1995 many municipal borders were redrawn and municipalities renamed. 16 The precise division of the municipalities in the regions in this period is quite difficult to trace and some (differential) misclassification could have occurred.
The reason for a somewhat lower rate ratio in the BBNN and SKP IKA regions is not known. Studies that explored reasons for non-attendance in the Netherlands mentioned mammograms taken outside the service screening programme, practical reasons, pain, no breast cancer in the family and breast self-examination as reasons for not accepting an invitation to screening.18,19 The possible association between these factors and a lower breast cancer mortality in non-screened women needs further exploration. A population survey performed in Australia also suggested that screening participants would have a slightly higher background risk of breast cancer than non-screened women. The participants were more likely to report a family history of breast cancer a history of breast surgery, and previous use of hormone replacement therapy. 7 Using a proxy for self-selection bias like differences in risk factors or in incidence of breast cancer is a way of coping with self-selection bias. However, caution is needed when interpreting the results. For example, it has been shown that equal breast cancer incidence in non-screened women and a control group does not necessarily lead to equal breast cancer mortality. 12
In the region of SKsL we calculated a correction factor of 0.92 (95% CI: 0.65–1.30) in this study. In a previous case-control study in the same region, we calculated a correction factor of 0.84 (95% CI: 0.58–1.21). 20 There are two factors that might be responsible for this small change. First, we used a slightly different method to calculate the IBM-ratio. Instead of using the date of diagnosis of each patient as the start of follow-up, we had a start of follow-up time independent from date of diagnosis in the previous study. Second, a small difference in the number of breast cancer deaths retrieved through linkage with the Cause of Death Registry of Statistics Netherlands could also be an influence. However, correction with these factors does not lead to a difference in the impact of the breast cancer mortality reduction by breast cancer screening.
Our correction factors for self-selection calculated for the regions in the Netherlands differ from those used in other case-control studies. Duffy
The application of date of diagnosis of each patient as start of follow-up was possible because we included non-screened and not-invited women only. When using a before-and-after the start of screening comparison for the effectiveness of screening, a date independent of diagnosis should be chosen to correct for possible lead time bias. Correction for lead time bias is only necessary if screened women are included in the comparison.14,21,22
Based on our study, the IBM method is an effective tool for calculating the correction factor for self-selection bias in the Netherlands. This is supported by a Swedish study, where they also calculated regional specific correction factors for self-selection bias using the incidence-based mortality method. 23 Our correction factor was based on breast cancer patients diagnosed in the period 1990 to 1995. Correction for self-selection bias of an estimated odds ratio for recent years would assume that the differential between the non-screened and not-invited women does not change over time. This assumption is inevitable, but is supported by the high and stable attendance rate in the Netherlands, which suggests that the non-screened women have not changed over time.
In conclusion, the heterogeneity between the regions shows the necessity for calculating regional or country-specific correction factors, even in a centrally organized screening programme. Looking at the range of IBM ratios in the five screening regions, the odds ratio estimated in a nationally conducted case-control study will show no change or a small increase in breast cancer mortality reduction after correction for self-selection. This indicates that self-selection is only a minor problem in the Netherlands.
Footnotes
Acknowledgements
This work was supported by a grant from the Dutch Cancer Society (project number: KUN 2006–3571). The funding source had no involvement in the study.
We gratefully acknowledge Stichting Kankerpreventie en – screening Limburg (SKsL), Stichting Kankerpreventie IKA (SKP IKA), Stichting Bevolkingsonderzoek Noord-Nederland (BBNN), Stichting Vroege Opsporing Kanker Oost-Nederland (SVOKON), Stichting Bevolkingsonderzoek Borstkanker Zuidwest Nederland (SBBZWN), Netherlands Cancer Registry and Statistics Netherlands for providing the data. We thank Dr. S Otto, Erasmus MC, University Medical Centre, Rotterdam, for providing the population data and the starting dates of screening for the different municipalities.
Calculation of person-years
The calculated number of person-years were based on the number of invited women, the number of screened women and the age-targeted female population for each municipality in the five regions separately. The not-invited number of person-years were calculated by subtracting the number of invited person-years from the total person-years of the targeted population.
The person-years of invited women were estimated based on the number of invited women:
year of the start of screening: half of the number of invited women year + 1: all invited women in the year of start of screening and half of the invited women in year + 1 year + 2: 95% of the total population of that year, assuming that 5% of the eligible population is not-invited
Adding up the number of invited person-years for every municipality for the total period of 1990–1995 resulted in the total number of invited person-years.
In addition, the non-screened person-years were calculated by subtracting the screened person-years from the total number of invited person-years.
The number of person-years of the screened women were based on the number of screened women:
year of the start of screening: half of the number of screened women year + 1: all screened women in the year of start of screening and half of the screened women in year + 1 year + 2: half of the screened women in the year of start of screening, all screened women in year + 1 and half of the screened women in year + 2
Adding up the number of screened person-years for every municipality for the period 1990–1995 resulted in the total number of screened person-years.