
Abstract
Objectives
To study the difference between the disease-specific and excess mortality rate in the European Randomized Study of Screening for Prostate Cancer section Rotterdam.
Methods
A total of 42,376 men were randomized to systematic screening or usual care. The excess number of deaths was defined as the difference between the observed number of deaths in the prostate cancer (PC) patients and the expected number of deaths up to 31 December 2006. The expected number was derived from mortality of all study participants before a possible diagnosis with PC. The disease-specific mortality rate was based on the number of men who died from PC. The excess mortality rate based on the arm-specific excess number of deaths and the disease-specific mortality rate were compared between the two study arms.
Results
The overall mortality rate was not significantly different between the intervention and the control arms of the study: RR 1.02 (95% CI 0.98–1.07). The disease-specific mortality rate was 0.42 men per 1000 person-years in the intervention and 0.48 men per 1000 person-years in the control arm: RR 0.86 (95% CI 0.64–1.17). The excess mortality rate was 0.40 per 1000 person-years in the intervention arm and 0.61 men per 1000 person-years in the control arm, and the RR for excess mortality was 0.66 (95% CI 0.39–1.13).
Conclusions
In contrast to the disease-specific mortality rates an increased difference in the excess mortality rates was observed between the two arms. This observation may be due to a systematic underestimation of the disease-specific deaths, and/or an additional disease-related mortality that is measured by an excess mortality analysis but not by a disease-specific mortality.
INTRODUCTION
The European Randomized Study of Screening for Prostate Cancer (ERSPC) has shown a significant reduction in prostate cancer (PC) mortality due to screening. 1 In the final analysis the ERSPC has compared the number of men who died from PC per unit time at risk in both arms of the study, i.e. the disease-specific mortality rates. Although this is a generally used endpoint of a randomized controlled screening trial, an alternative to this approach exists. It comprises the estimate of the excess mortality rate in the cancer patients in both arms of the study. 2 This excess mortality rate is based on the actually recorded number of cancer patient deaths in excess of the number expected on the basis of a cohort of cancer-free individuals per unit of time.
No differences in the disease-specific mortality and excess mortality rates are expected to be found. This is conditional on PC being the only factor affecting differences in mortality, the accurate ascertainment of the disease-specific mortality and an accurate estimate of the expected mortality. However, if for example screening for PC has non-PC-related effects on the life-expectancy of cancer patients, or the cause of death is not accurately assessed, the outcome of the two mortality analyses may differ. Therefore the question whether the disease-specific mortality rate differs from the excess mortality rate in men who are systematically screened for PC and in men who were not systematically screened is relevant. The absence of a discrepancy confirms the established effect of screening on PC mortality, the presence of a significant discrepancy warrants further research.
MATERIALS AND METHODS
Study population
After signing an informed consent, a total of 42,376 men, aged 55–74 years, were randomized in the Rotterdam section of the ERSPC between 1993 and 2000. 3 Men were allocated to the intervention and the control arm by individual randomization based on the outcome of a random number generator. Men with a prior diagnosis of PC were excluded. Between December 1993 and May 1997 men in the intervention arm were screened with an interval of four years by prostate-specific antigen (PSA) measurement, rectal examination (DRE) and transrectal ultrasound examination (TRUS). A sextant biopsy was initially offered to men with PSA ≥4.0 ng/mL and/or a suspicious finding on DRE and/or TRUS. After May 1997 a biopsy was prompted by PSA ≥3.0 ng/mL only. Treatment decisions were taken by the local urologist and at patient's preference. Details of the screening methodology were reviewed by Roobol and Schröder. 4 Cancers diagnosed between the screening intervals or after the age of 74 years clinically or due to opportunistic screening, transurethral resection of the prostate for benign disease, and cystoprostatectomy specimens, were included as well. These cancers were identified by means of linkage to the national Comprehensive Cancer Registry. 5,6 Follow-up in this respect was complete up to and including 2006. Men in the control arm were not subject to screening and received usual care if diagnosed with PC. The men with PC in the control arm were identified through the same linkage with the Comprehensive Cancer Registry.
Mortality data
Mortality data of participants who died in the period up to 31 December 2006 were obtained by linking the trial database with the Causes of Death Registry of Statistics Netherlands. 7 Linkage to the Causes of Death Registry of Statistics Netherlands was possible by using the personal administrative number of each participant as a linkage key.
Length of follow-up
Diagnostic and mortality data were available until 31 December 2006. Consequently, the date of censoring was at emigration or 31 December 2006.
Disease-specific mortality
For all PC cases in the study who were known to have died, all available information was gathered and anonymized. Subsequently all deceased PC cases were reviewed by a national independent causes of death committee (CODC) using predefined flow charts or by an international committee if no consensus was reached. 8 Patients were determined to have died from PC if they were classified as either ‘definitely PC death’, as ‘possible PC death’ or as ‘PC intervention related death’ 8 . The disease-specific mortality was calculated for both arms of the study.
Excess mortality
The excess mortality was calculated for both arms of the study and was based on arm-specific excess numbers of deaths of the PC patients. In both arms, the observed number of deaths in PC patients diagnosed during the trial was compared with an expected number of deaths. The expected number of deaths was calculated on the assumption that the patients would have had the same mortality by age at and time since randomization as the study population (intervention and control arms) combined before any diagnosis of PC. The excess number of deaths was defined as the difference between the observed and expected numbers. The excess numbers of deaths were used as numerator data, and the number of person-years per study arm was used as denominator in calculating the excess mortality rates for both arms of the study.
General population mortality
The age-specific mortality rates obtained from the study participants were graphically compared with the age-specific mortality rates obtained from nationwide population life tables based on men in the general Dutch population. 9 The mortality rates were expressed in deaths per 1000 person-years at risk per year.
STATISTICAL ANALYSIS
The excess mortality rates were compared between the study arms as shown in the Appendix . The disease-specific mortality rates were compared between study arms using a Poisson regression analysis with an indicator of study arm as a predictor and the logarithm of the number of life years as an offset term (predictor with a coefficient of one). 10 In this paper a two-sided P value <0.05 was considered statistically significant. All analyses were performed with the commercially available STATA package: Data Analysis and Statistical Software, version 10.
RESULTS
Baseline characteristics
A total of 42,317 men of the 42,376 men who signed an informed consent were included in the study (59 men were excluded because of a PC diagnosis before randomization). The median age at randomization was 63 years for both study arms (Table 1). The cumulative PC incidence in the intervention arm was 2.4-fold higher than in the control arm, i.e. 2153 (10.2%) men were diagnosed with PC in the intervention arm and 901 (4.3%) men were diagnosed with PC in the control arm (Table 2). The median age at diagnosis differed significantly between the two groups (P < 0.001); men in the intervention arm were diagnosed at an earlier age. Up to the end of 2006, a total of 4077 (19.2%) men died in the intervention arm (21.67 men per 1000 person-years) and a total of 3977 (18.8%) died in the control arm (21.20 men per 1000 person-years). This resulted in a cumulative all-cause mortality that was not significantly different between the two arms: RR 1.02 (95% CI 0.98–1.07) (Table 3).
Study arms by age at randomization
Prostate cancer patients by age at diagnosis
*Mann-Whitney U test
‡
Mortality outcomes in the intervention and control arm ERSPC, Rotterdam
PC, prostate cancer; rates as the ratio of deaths to 1000 person-years of exposure; RR, rate ratio
Disease-specific mortality rate
Up to the end of 2006, in the intervention arm 0.42 men per 1000 person-years and in the control arm 0.48 men per 1000 person-years died from a PC-related cause of death according to the CODC. This resulted in a non-significant reduction in PC mortality rate of 14% in the intervention population relative to the control arm: RR 0.86 (95% CI 0.64–1.17) (Table 3).
Excess mortality
Up to the end of 2006, the excess mortality rate was 0.40 men per 1000 person-years in the intervention arm and 0.61 men per 1000 person-years in the control arm. This resulted in a non-significant reduction in the excess mortality rate of 34% in the intervention population relative to the control population: RR 0.66 (95% CI 0.39–1.13) (Table 3).
Disease-specific mortality versus excess mortality
The excess mortality rate was slightly lower than the disease-specific rate in the intervention arm of the study. The absolute risk difference was 0.02 men per 1000 person-years. The excess mortality rate was considerably higher than the disease-specific rate in the control arm of this study. The absolute risk difference was 0.13 men per 1000 person-years. The difference between disease-specific and excess mortality rate in the control arm of the study was most evident for the older ages at randomization (Table 4).
Mortality outcomes according to age at randomization
PC, prostate cancer; I, intervention; C, control; rates as the ratio of deaths to 1000 person-years of exposure; RR, rate ratio
Mortality rates study population versus general population
The age-specific mortality rates among study participants were favourable compared with men in the general population (Figure 1). The mortality rates increased with increasing attained age in both populations. The mortality ratio was about 1.4-fold higher among men in the general population for all ages.
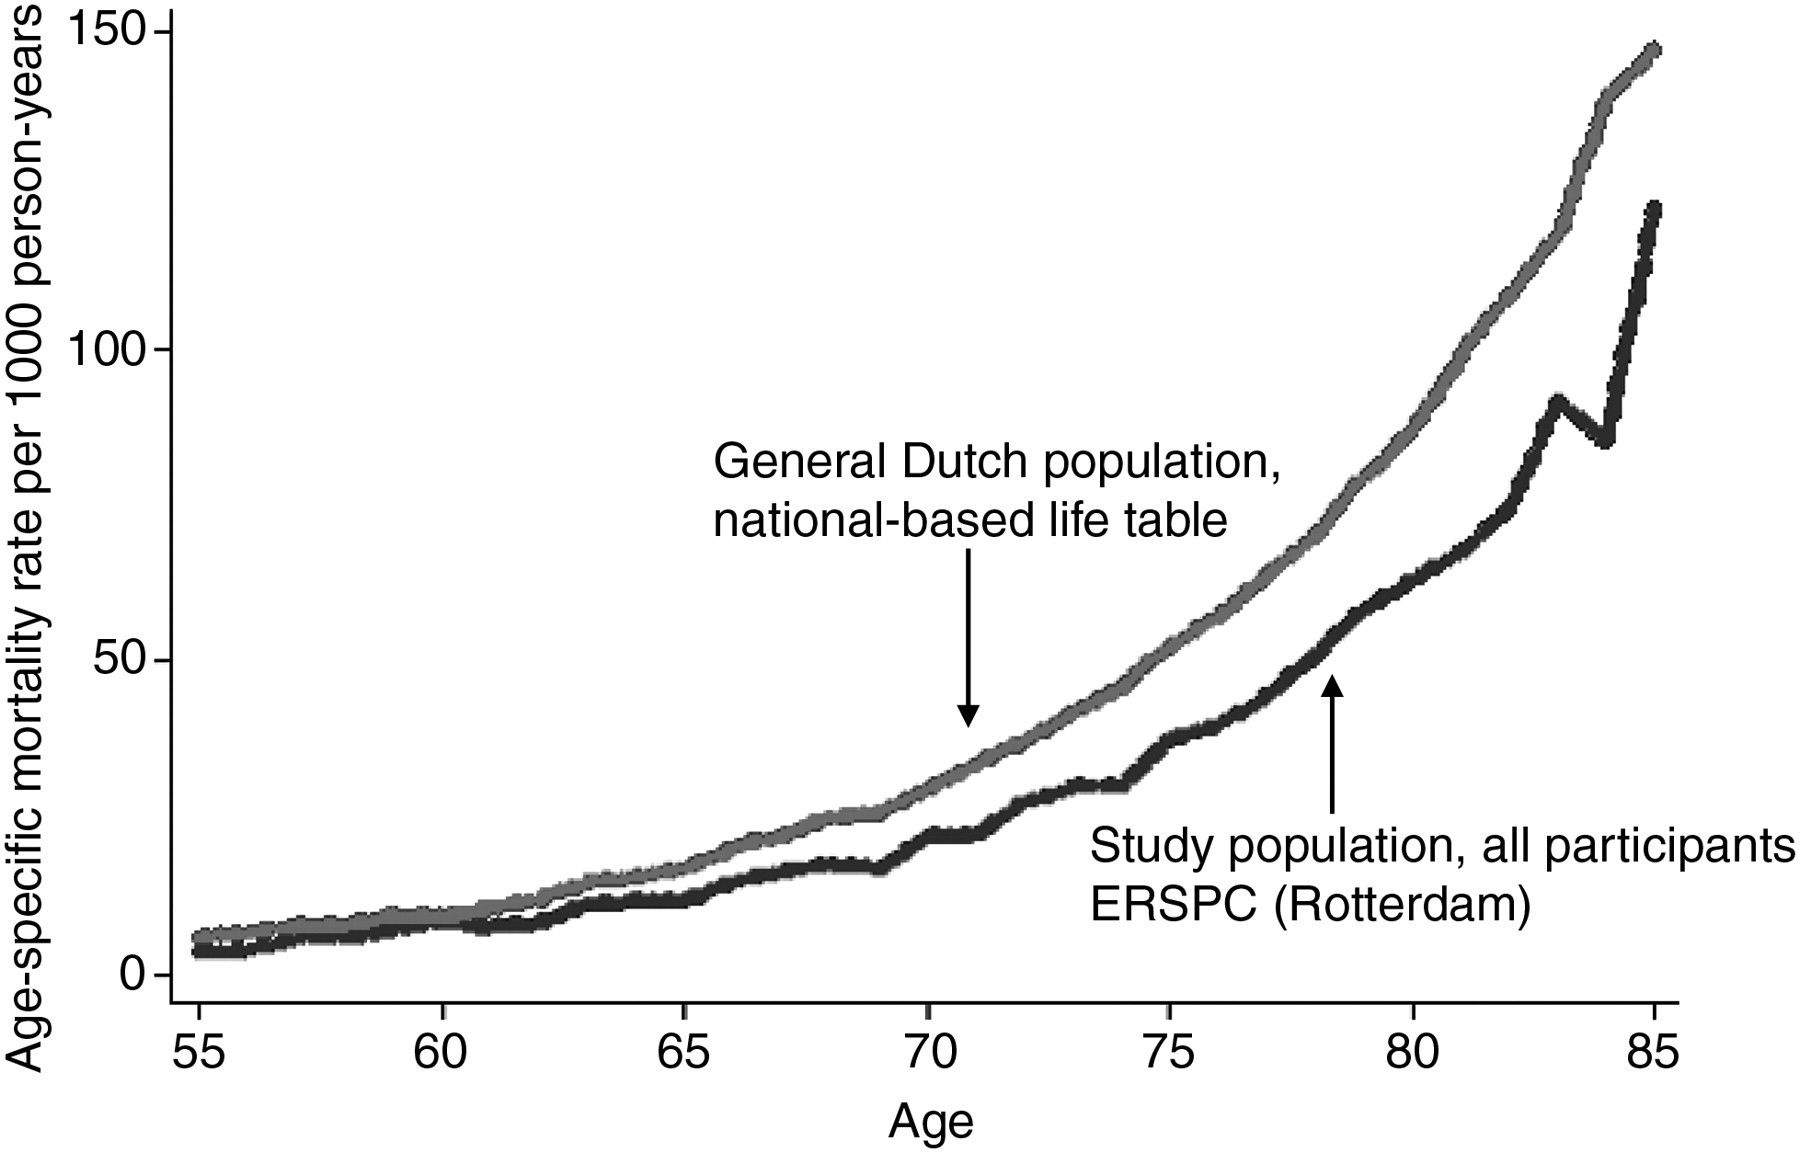
Age-specific mortality rate per 1000 person-years, for men in the general Dutch population and all men participating in the ERSPC (Rotterdam)
DISCUSSION
The ERSPC was initiated to detect the effect of population-based PC screening on PC-specific mortality. The ERSPC (all centres included) was designed with a power of 0.86 to detect a 25% intervention effect in men actually screened if the contamination remained limited and the follow-up was complete up to the end of 2008. 11 As a result, a 20% relative reduction in PC mortality with a significance level of P = 0.04 was reported by the ERSPC based on the data up to the end of 2006; the relative reduction in the men actually screened was 27%. 1 The focus in this first report was the difference in PC-specific mortality rates. 1 In the current report we have studied the excess mortality in addition to the disease-specific mortality in the Rotterdam section of the ERSPC. The excess mortality rate was notably higher than the disease-specific mortality rate in the control arm. As a result, in comparison with the disease-specific mortality rates, an increased difference in the excess mortality rates was observed between the two arms of the ERSPC Rotterdam. Neither of the relative reductions were statistically significant. Therefore results after longer follow-up and complementary data of the total ERSPC are needed to confirm these observations.
Any difference between the excess and disease-specific mortality rate could be due to a violation of the appropriateness of the basic assumptions (accurate estimation of expected mortality in case of excess mortality, accurate classification of cause-of-death in the case of disease-specific mortality and the absence of an intervention related effect on the life-expectancy that is unrelated to PC in case of excess mortality). 2 Since a difference was observed, this difference will be discussed on the basis of the above three possible explanations.
Accurate estimation of expected mortality
Typically, in relative survival analysis, the expected mortality is estimated from nationwide population life tables stratified by age, sex and period. 12 In this screening setting, the general population may not be suitable as a reference population since the people who participate might well be healthier and of higher socioeconomic classes, i.e. subject to healthy screenee bias. 13,14 For this reason, in the present study, it seemed appropriate to obtain the expected mortality from all participants before a possible diagnosis of PC. A comparison of the mortality rates from the Dutch national statistics 9 with the rates derived according to the procedure outlined above, indicated that the mortality rates were considerably lower among study participants than among men in the general population (Figure 1). These results are consistent with a study on socioeconomic status patterns among study participants, which showed that men who participated in the study had higher income levels and lower poverty or deprivation status. 15 Therefore, the national population is not an appropriate reference group for the estimation of the excess mortality in a PC screening trial. Additionally, an excess mortality could be overestimated if PC patients would have characteristics which are related to PC but also carry an increased risk of death other than from PC. For example, patients diagnosed with smoking-related cancers will experience excess mortality, compared with the reference population, due to both the cancer and other smoking related conditions. Such a relation is not known for PC; however, it could be that there is an unknown factor related to clinical diagnosed PC in particular that is carrying a higher risk of death from other causes. In principle, such a confounding effect could be of influence on the observed difference between the disease-specific mortality and excess mortality rates in the current study. Therefore, this has to be considered as an explanation for the observed difference.
Random variation excess mortality
The confidence interval of the rate ratio of the two excess mortality rates between the two study arms was estimated by the delta method, Appendix . 16,17 To examine the appropriateness of the assumptions made in this approach, the confidence interval was also estimated by means of a computer simulation (bootstrap procedure). 18 Using a bootstrap procedure has the benefit of not making assumptions about the distribution of the coefficients. The procedures consist of a repeated sampling with replacement from the data-set under study and carrying out the modelling for each sample thus obtained. The rate ratio of the two excess mortality rates between the two study arms obtained from the bootstrap equalled 0.68 (95% CI 0.28–1.08).
Accurate classification of cause-of-death
In the present study the causes of death of every PC patient are ascertained by a committee. 8 Such committees are based on the experience in breast cancer screening trials where independent committees have reviewed causes of death to ensure a correct interpretation of the mortality results published. 19 It is assumed to be the most optimal method, especially in PC where death on the death certificates differs often from the clinical picture. 20,21 However, it is in practice impossible to blind the arm of the study entirely before the committee reviews the records of deceased men. The records are for example not blinded for stage at diagnosis although this is a very suggestive parameter for the arm of the study. 22 It remains possible that the lack of adequate blinding of the records with respect to the study arm has resulted in a bias in the cause of death ascertainment. Efforts have been made to optimize the accuracy of the assessment of the cause of death, e.g. all PC deaths are reviewed by three persons independently without exchanging opinions. 8 However, despite these efforts, it might be possible that the reviewers have underestimated the PC mortality by being too cautious in stating that a patient has died from PC in the control arm of the study, in order not to overestimate the study outcomes. Furthermore, it might be that due to the study protocol more information could be gathered from patients diagnosed with PC in the intervention arm. Consequently, the CODC made a more valid decision for the deceased men who were participating in the intervention arm. Therefore, this potential bias might be an explanation for the observed difference in both mortality rates in the control population. Finally, any algorithm used for the review of causes of deaths is bound to be based on some arbitrary definitions which are needed to ascertain comparability of decisions but which may lead to discrepancies with the excess mortality.
Absence of an intervention related effect on life-expectancy that is unrelated to PC
Assuming that the observed difference in outcomes between the two mortality rates is not due to the two previously described explanations, the difference may be due to the theoretical difference of the two mortality analyses. Disease-specific mortality is included in excess mortality but is not identical to it, i.e., disease-specific mortality refers to mortality due to only one particular cause of death such as disease progression and treatment-related mortality, and excess mortality measures both the direct and indirect mortality due to the cancer of interest, e.g. cachexia, uraemia, suicide depression and loss of interest in life. For this reason, a screening study may reduce the disease-specific mortality but side-effects of the screening procedure (anxiety) may cause increased death from other causes. In such a case the excess mortality is higher than the disease-specific mortality. On the other hand, the screening procedure may detect health problems unrelated to the disease under study which may lead to effective medical treatment. In this case the excess mortality will be less than the disease-specific mortality. These latter considerations may thus explain the differences between the mortality rates in the intervention arm of the study (Table 3).
Based on the observation that the excess mortality rate exceeds the disease-specific mortality rate in the control arm of the study, the life-expectancy of more men may be negatively influenced than estimated on the basis of a disease-specific mortality analysis. Possibly, in a number of cases, PC-specific mortality has failed to establish to which extent PC is a contributory factor for death. This is a known phenomenon since only 50–85% of men with advanced PC die from their disease, depending on age and the extent of the disease at diagnosis. 23 As a result, in these men with advanced disease who did not die from PC, the advanced disease could have shortened the patient's life by making the patient more susceptible for other causes of death. For example, the death of patients who are physically affected by PC but eventually die from a secondary infection, will be classified as an intercurrent cause of death. In such a case the question remains if the patient would have died when the disease of interest was absent. Based on our results this may, among others, explain the observed discrepancy between the two types of mortality rates, especially in the control arm since the control arm contains more men with a clinically advanced disease.
The main difference between the excess mortality and disease-specific mortality rate in the control arm was observed for the older age group at randomization (Table 4). This observation is in good agreement with the previous excess mortality studies on mammography screening for breast cancer that also observed a more pronounced discrepancy between the excess mortality and disease-specific mortality analysis for the older ages. 24,25 In line with suggestions made in the previous publications, this could be the result of a more uncertain individual cause of death determination in these age groups since the overall mortality in these older ages was higher.
Overall mortality
This study and the total ERSPC were not designed to detect a statistically significant effect in overall mortality. 1,11 We estimated that if the effect of screening were the only between arm difference in the mortality pattern a 30% disease-specific mortality reduction would translate into a 0.7% overall mortality reduction. In order to show this effect of screening on overall mortality at the two-sided 5% level of statistical significance, more than 3 million study participants have to be randomized (assuming a median of 9-year follow-up and a 15% overall mortality over the 9-year period). 26 Therefore, if PC screening has an impact on the overall mortality, this will be very small.
Limitations
This study was performed by a single centre of the ERSPC. However, this centre was not powered to analyse the effect of a significant difference in disease-specific mortality alone. 11 Consequently, final conclusions can only be made after confirmative results based on data of the total ERSPC.
CONCLUSIONS
For the evaluation of PC screening, a study of the excess mortality analysis is of independent additional value to a disease-specific analysis since it measures the effect of screening in the presence of all competing risks. The between arm difference in the excess mortality rates was more than two-fold the between arm difference in the disease-specific mortality rates. Two possible explanations for the observed discrepancy outlined in this paper are: (1) a systematic underestimation of deaths from PC by the CODC in the control arm of the study; (2) an additional disease-related mortality that is measured by an excess mortality analysis but not with a disease-specific mortality. Furthermore, although the effect in terms of excess mortality was larger than the disease-specific mortality, PC screening might have no or a very small effect on the overall mortality.
In any randomized study with a disease-specific mortality reduction as an endpoint, an additional excess mortality study should be mandatory as it may reveal additional important information. In the present study it may imply that the effects of PC screening on mortality are considerably larger than reported in the initial analysis that focused on disease-specific mortality only.
Footnotes
ACKNOWLEDGEMENTS
The authors wish to thank Dr W Hoekstra and Dr J W Merkelbach for reviewing the causes of death of all deceased prostate cancer patients who participated in the study. The ERSPC Rotterdam is supported by grants from the Dutch Cancer Society (KWF 94-869, 98-1657, 2002-277, 2006-3518), The Bonnema Foundation, The Netherlands Organization for Health Research and Development (002822820, 22000106, 50-50110-98-311), 6th Framework Program of the EU: P-Mark: LSHC-CT-2004-503011, Beckman Coulter Hybritech Inc and of Europe against Cancer (SOC 95 35109, SOC 96 201869 05F02, SOC 97 201329, SOC 98 32241). The ERSPC received Erasmus MC and Ministry of Health institutional review board approval.
APPENDIX. Statistical comparison between the two excess mortality rates of the two study arms
The two excess mortality rates are presented as mi = ei /ni , where i = 1, 2 is the study arm (i = 1: intervention arm and i = 2: control arm), ei = arm-specific excess number of deaths and ni = arm-specific number of observed person-years. In this study, the quantities n 1 and n 2 are regarded to be constants since the total numbers of death in the arms are large.
The ei
are not regarded as constants, since ei
depends on Ni
= number of prostate cancer cases per study arm and the chances of patient survival (a source of extra random variation). Furthermore, each ei
is also a difference between two numbers of deaths among the Ni
patients:
In this calculation, the di
and di
* are mathematically related to the Ni
as
In this comparison the quantity of interest is
The 95% confidence limits for ln(RR) based on the delta method are calculated as ln(RR) + 1.96 sqrt (var (ln(RR))) as the upper bound and ln(RR) − 1.96 sqrt (var (ln(RR))) as the lower bound, where sqrt = square root. Consequently, the confidence limits for the RR are obtained by an exponentiation of these upper and lower bounds.
The var (m
1) and var (m
2) are calculated as
Now the Poisson assumption of Ni
, constancy assumption of qi
* and the delta method for variance of a product have been made use of. A binomial assumption for qi
further gives
This can be inserted into the formula of var (mi ), i = 1, 2, in order to give the confidence interval for the RR.