
Abstract
Objectives
Italy was the first European nation to offer free vaccination against human papillomavirus (HPV) types 16 and 18. The vaccination is actively encouraged and is available free of charge to 11-year-old girls. The introduction of new technologies such as HPV DNA testing and HPV vaccination requires cost-effectiveness analysis of cervical cancer strategies in Italy for both vaccinated and unvaccinated women.
Methods
A calibrated Markov model was developed to describe the natural history of HPV infection and cervical carcinogenesis. We performed a microsimulation generating the life histories of 10 million women. Changes in these life histories occur as consequences of prevention strategies. We estimated costs of screening activities using an activity-based costing analysis. We assessed lifetime risk due to cervical cancer, lifetime costs and quality-adjusted life-expectancy (QALE) for 18 scenarios. Strategies varied by screening interval (three and five years), primary and triage test (Pap test and HPV DNA test), and HPV 16 and 18 vaccination.
Results
The current screening policy (Pap test every three years) is more costly and less effective than HPV DNA test and Pap test triage every five years. For unvaccinated women an HPV DNA test every five years with a Pap test triage was cost-effective (ICER €5753/QALE). Vaccination followed by the same screening strategy was cost-effective (ICER €23,951/QALE) for women who are eligible to be vaccinated.
Conclusions
Our findings strongly support changing the Pap screening policy to the use of HPV DNA as a primary test with Pap test triage for both vaccinated and unvaccinated women.
INTRODUCTION
Cervical cancer is the second most common cause of cancer death in women worldwide, with about 493,000 new cases and 274,000 deaths in 2002. 1 In Italy, cervical cancer prevention greatly benefited from an organized screening programme introduced in the early 1990s. 2 Nevertheless, there were an estimated 3400 incident cases and 1200 deaths from cervical cancer in Italy in 2002. 3 Human papillomavirus (HPV) infections, which cause cervical cancer, 4,5 can be classified as high or low risk (hrHPV/lrHPV) types according to the degree of risk in the development of cervical cancer. HrHPV16 and hrHPV18 account for about 70% or more of the cases of cervical cancer worldwide. 1 Currently, there are two vaccines available in Italy: a quadrivalent vaccine (Gardasil) targeted at hrHPV16/18 and lrHPV 6 and 11, which are two low-risk HPVs that cause most cases of genital warts; and a bivalent vaccine (Cervarix) that targets hrHPV16/18.
The availability of new prophylactic vaccines and HPV DNA testing dramatically changed the frontiers of cervical cancer prevention and make it necessary to assess the current best policy for screening.
6,7
The new landscape of cervical cancer prevention triggers three key public health questions:
Is the current cytology screening still cost-effective? What is the most cost-effective combination strategy for screening and vaccination of new cohorts? Should we use the same screening strategy for both vaccinated and unvaccinated women?
Italy was the first European nation to offer free HPV vaccinations. The vaccination is actively encouraged, although not mandatory, and is available free of charge to 11-year-old girls. Each region has its own vaccination programme in addition to the national one and can decide to offer free or discounted vaccinations to a wider target population or can implement free catch-up vaccinations at the start of the programme. 8
Kim et al. 9 developed a model to simulate the natural history of cervical carcinogenesis for a cohort of Italian women in order to assess the cost-effectiveness of incorporating HPV DNA testing into existing screening programmes. Zappa has discussed the impact of vaccination in Italy, 10 and two further papers studied the impact of introducing vaccinations in association with the current Italian screening context. 11,12 Therefore, most of the published models evaluated vaccination strategies in Italy combined with the current cervical screening strategy. A systematic review was undertaken by Marra et al. in 2009. 13
In the current analysis, we developed a mathematical model of HPV infection and cervical carcinogenesis to evaluate the cost-effectiveness of newer strategies for cervical cancer prevention in Italy.
METHODS
Natural history model structure
We developed a Markov model to describe the natural history of infection and carcinogenesis. The natural history of cervical cancer was defined by a sequence of transitions between a set of mutually exclusive health states: healthy, HPV infection, precancer lesions (two degrees of severity: low and high) and cancer (local, regional and distant). Health states were further stratified by three HPV categories: lrHPV, hrHPV 16/18 and hrHPV non-16/18. 9,14–16
In the microsimulation individual women enter the model at birth and their histories are individually simulated throughout their lives. All health states represent the underlying true states. Women move through the health states on a one-year cycle. Each year a healthy woman is at risk of becoming infected with lrHPV, hrHPV 16/18 or hrHPV non-16/18. Women with HPV infections have a chance of clearing their infection by developing lifelong natural immunity. Natural immunity is type-specific and reduces the susceptibility to future same-type HPV infection, i.e. it does not necessarily prevent future same-type infection.
Lr- and hrHPV infections may lead to precancer lesions. Precancer lesions can progress to local cancer or they can regress. We combined published data with the opinion of local experts to estimate the proportion of regressions from low-grade lesions to healthy states (90%) or to estimate the proportion of HPV infection (10%). High-grade lesions can regress to healthy states (50%) or they can regress to HPV infection (25%) or to low-grade lesions (25%). 14,15 We assumed that only women with hrHPV infection develop cancer. Women with cancer can be detected by their symptoms or can progress to a more severe stage of cancer. Transition from the undetected to the detected cancer state is defined by the stage-dependent probability of the developing symptoms. 14,16
Women with detected cancer received stage-specific treatment. Non-cancer death can occur in all health states. A woman with cancer has an additional stage-specific risk of dying from cervical cancer.
Natural history transitions probabilities
The transitions among health states occur with probabilities that are age-specific and HPV-type-specific. Baseline parameter values for model inputs relating to the natural history were defined by previous models and published literature (Appendix A, Table A1). 15–19
Probabilities of death
Probabilities of death are based on the Tuscan Cancer Registry data and on the Italian life table. The Cancer Registry provides relative survival rates for local, regional and distant cancer. We used the approach described in Cronin and Feuer 20 to calculate the crude probability of dying from cervical cancer.
Calibration
To assure consistency with key endpoints we used a formal calibration procedure. We defined a plausible range of values for each transition probability from previous models, published literature and preliminary analysis. 16–19 The model was then calibrated in a two-stage approach. First, we calibrated probabilities of HPV infection to match predicted age-specific hrHPV prevalence with observed data from the New Technologies for Cervical Cancer (NTCC) study. 21 Second, we calibrated probabilities of low- and high-grade lesions to age-specific incidence as reported by the Italian Cancer Registries Network. 3
For each set of parameter values, we performed simulations and computed an overall goodness-of-fit score as the average of absolute values of percentage variation. We chose the best set of parameter values. Calibration methods ensured that the age-specific hrHPV prevalence and incidence of cervical cancer predicted by our model approximated the available nationwide data.
Scenarios
The main aim of this study was to evaluate the comparative impact of screening strategies with or without the vaccination of young girls. We defined 18 preventive strategies determined by the primary screening test, triage test, screening frequency (every 3 or 5 years) and vaccination. Specific screening protocols that we evaluated included: (i) no intervention but treatment of symptomatic cervical cancer; (ii) Pap test screening; (iii) HPV DNA testing (hybrid capture II); (iv) Pap test screening followed by HPV DNA testing for positive Pap test results (ASCUS+); (v) and HPV DNA testing followed by a Pap test for positive HPV DNA results. Women with a positive triage test were given an immediate colposcopy.
The screening parameter values are shown in Table 1.
16,22,23
We made the following assumptions:
All screening programmes start at age 25 years and end at age 65 years, as per the Italian screening guidelines;
2
Average compliance with the screening schedule is 70.9%.
24
We defined three groups: women who never undergo screening (20%), women who always undergo screening (44%) and women for whom the compliance increases with age (36%); All women with a confirmed histology of CIN2-3 are treated according to guidelines;
2
Preadolescent vaccination occurs by age 11 years (100% coverage); Vaccine is 75.9% effective in preventing one-year persistent hrHPV 16/18 infection.
25,26
Vaccine efficacy was defined as (1–rate ratio) × 100%, which is the ratio of the event (one-year persistent infection with HPV 16/18) rates between the vaccinated and control groups; Vaccinated girls may be infected with HPV non-16/18 types according to the same probabilities that would have governed these infections in the absence of vaccination;
Selected model variables
HPV, human papillomavirus; ABC, activity-based costing
*We assumed three doses of vaccine at €90 each administered within the primary care setting
Cost parameters
We used an activity-based costing (ABC) method to determine the costs of screening invitation, Pap and HPV DNA testing, colposcopy, treatments and vaccination. 27 The economic information used for the ABC analysis of screening activities comes mainly from the Tuscan Region's cervical screening programme. Additional data needed for the ABC calculation was estimated from local hospitals. We interviewed health personnel in order to derive the indirect costs by using personnel time allocation among the various activities. The costs in euros were indexed for the year 2006 (Table 1).
Sensitivity analysis
Given the uncertainty about some vaccine parameters, we evaluated the implications of alternative assumptions in sensitivity analyses. We varied one parameter, holding all other parameters constant, to examine the robustness of our cost-effectiveness results with respect to: lifelong vaccine efficacy of 85% and 95% (base case 75.9%); vaccine cost per dose of €70, €50 and €30 (base case €90), and the need of a booster shot (€90) after 10 and/or 20 years from vaccination.
Cost-effectiveness analysis
According to assumptions concerning the natural history model, we simulated 10 million individual life histories to provide stable results. Life histories were then subjected to prevention programmes according to assumptions on screening and/or vaccination policy. Some of the life histories were changed by this simulated strategy. These changes constitute the simulated effect of the strategy. Alternative strategies were measured using the Incremental Cost-Effectiveness Ratio (ICER), which is defined as the additional cost of a specific screening strategy divided by its additional health benefit measured in years as quality-adjusted life-expectancy (QALE). We computed QALE assuming a multiplicative relationship between age-specific quality-of-life weights and stage-specific weights (Table 1). The discount rate per year for costs and health benefits was set at 3%. Strategies that were more expensive and less effective (strongly dominated) or less costly and less cost-effective (weakly dominated) than an alternative strategy were excluded from the ICER calculations.
We charted our results by using the cost–disutility plane: the incremental cost relative to least expensive strategy is plotted versus the incremental QALE relative to the most effective strategy. 28 This plane allows identification of the efficiency frontier and dominance, but also introduces a measure of the degree of dominance or technical inefficiency. This is calculated as ‘the proportion by which costs and disutility can be simultaneously reduced by moving to the efficiency frontier’. 28 The microsimulation was implemented using the software R 2.8.0 (R Development Core Team).
RESULTS
Model calibration
We compared the model predictions based on the best parameter set to nationwide epidemiological data not used in the parameterization. We used about 4000 points (parameter combinations) in a multidimensional grid. Only very close points had goodness-of-fit scores that were indistinguishable from that of the best fitting set, i.e. we can reasonably exclude the presence of local maxima. The model-predicted hrHPV age-specific prevalence curve fit well with the epidemiological estimates obtained by the NTCC study (Figure 1). 21 Although it produces slightly higher estimates of prevalence than those from the NTCC for women aged 40–50 years old, overall the model output is consistent with the general shape of the hrHPV prevalence curve. Model predicted age-specific cervical cancer incidence was comparable with incidences observed in Italy (Figure 1). 3 However, the age-specific cancer incidence tended to be slightly lower than in published epidemiological values for the age span 20–50 years.
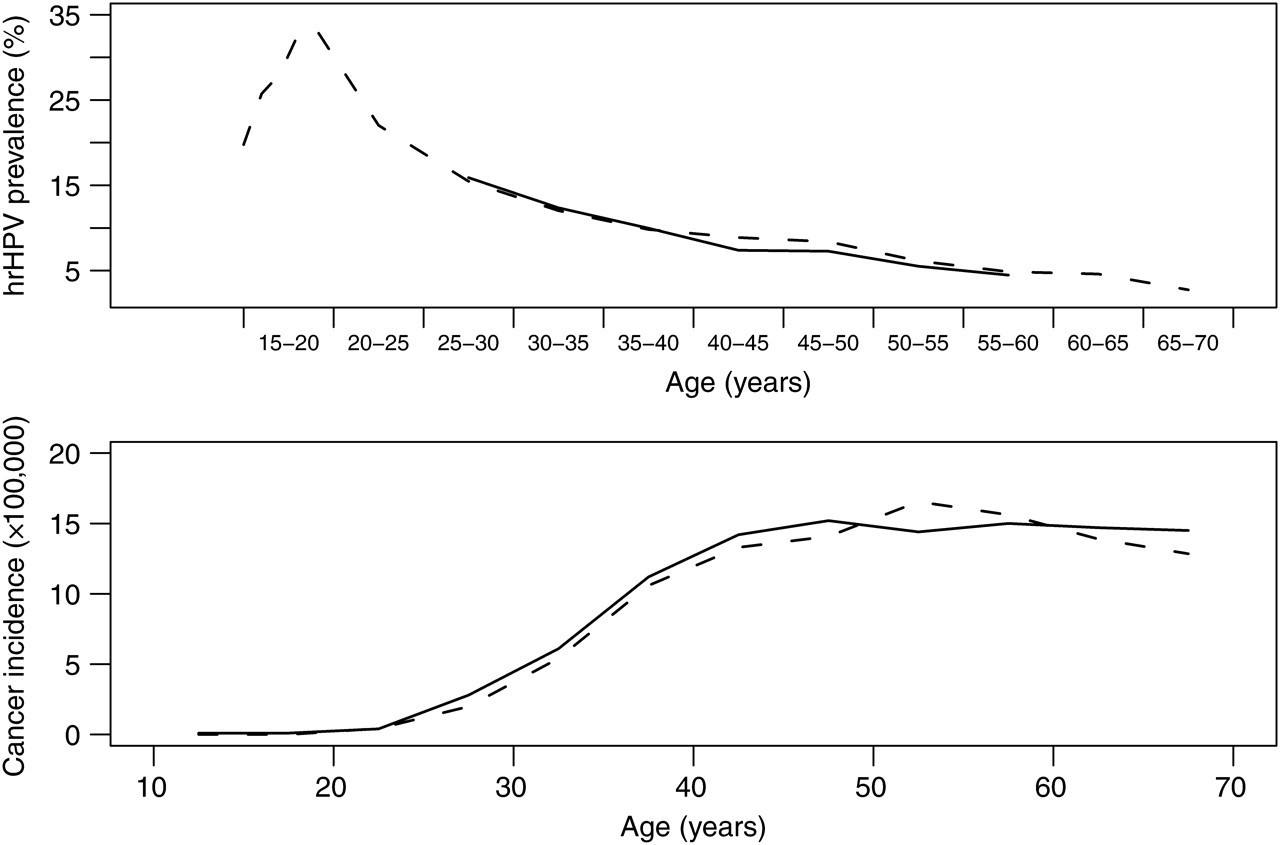
Model calibration model output (dashed curves) fit to observed (solid curves) nationwide epidemiological data. Top: hrHPV prevalence (%). Bottom: age-specific incidence (×100,000) of cervical cancer. hrHPV, high-risk human papillomavirus
Cervical cancer risk
In the absence of screening and vaccination, the absolute lifetime risk of cervical cancer predicted by the model is 138 per 10,000 women (Table 2). Lifetime risk reduces to 65 when a Pap test is adopted every three years (current screening). The substitution of the Pap test with a HPV DNA test every three years has minimal impact on the reduction of lifetime risk. As expected, the impact on risk of the HPV DNA test is not changed by Pap test triage, a strategy aimed to improve specificity. The model predicts that vaccinating girls under the current screening protocol would reduce lifetime risk of cervical cancer to 33 per 10,000 women. For vaccination without screening the expected lifetime risk of cervical cancer (63 per 10,000) was similar to the reductions for Pap test every three years without vaccination (65 per 10,000). The lifetime risk ranges from 28 to 38 per 10,000 women for those who have been vaccinated and followed with any screening protocol.
Lifetime risk of cervical cancer (per 10,000), reduction in cancer risk (%), cervical cancer mortality (per 100,000 women), total discounted quality-adjusted life-expectancy (QALE), total lifetime discounted cost per woman (EURO) and degree of dominance
HPV, human papillomavirus
*The degree of dominance was calculated within the set of all efficient strategies, including screening only, vaccination only, and screening and vaccination used in combination
Evaluating strategies for women who are not vaccinated
First, we assessed the performance of screening strategies by only comparing efficient strategies for women who are not vaccinated. Strategies with a screening interval of five years had an expected ICER of €4495/QALE (Pap test and HPV DNA triage) and €5753/QALE (HPV DNA test and Pap test triage). Accelerating the screening schedule in the latter strategy to every three years had an ICER of €68,330/QALE compared with the next efficient strategy for unvaccinated women. Although there is no universally accepted cost-effectiveness benchmark in Italy, a threshold of €50,000 per QALE is a commonly accepted value below which preventive strategies are considered cost-effective.
Evaluating strategies for women who are eligible to be vaccinated
Next, we compared performance of all efficient prevention strategies including screening only, preadolescent vaccination only, and the combination of screening and vaccination for women who are eligible to be vaccinated. Vaccination followed by the HPV DNA test every five years and Pap test triage was cost-effective with an expected ICER of €23,951/QALE compared with the next best strategy. Reducing the screening interval in this strategy to every three years had an ICER of €114,256/QALE providing a reduction of lifetime risk of cervical cancer from 30 to 28 per 10,000 women (Table 3). Screening programmes every three years (including the current policy) are dominated or not cost-effective.
Cost-effectiveness results (ICER in € per QALE gained) for women who are eligible to be vaccinated: base case and alternative assumptions*
ICER, Incremental Cost-Effectiveness Ratio; QALE, quality-adjusted life-expectancy; HPV, human papillomavirus
*Base case assumptions: vaccine cost per dose €90; no booster; vaccine efficacy of 75.6%
D, strongly or weakly dominated
†Single dose
The degree of dominance for the current strategy (Pap test every 3 years) is 0.192, implying that expected cost in excess of the cheapest strategy and disutility in excess of the most effective strategy could both be reduced by 19% if a combination of vaccinated and unvaccinated women was screened with the HPV DNA test and Pap test triage every five years.
Sensitivity analysis
The need for a booster shot after 10 and/or 20 years has only a limited effect on the results. Vaccination followed by the HPV DNA test every five years with Pap test triage remains cost-effective with an ICER of €36,245/QALE with two boosters after 10 and 20 years. Increasing the vaccine efficacy implies that the HPV DNA test every three years with Pap test triage is dominated. However, the same strategy every five years remained cost-effective with an ICER of €16,517/QALE for a vaccine efficacy of 95%. On the other hand, although the cost-effective strategy does not change, the vaccine cost has a strong effect on the cost-effectiveness results. Assuming a cost of €30 per dose, all strategies without vaccination are dominated by vaccination at age 11 years. In this last case, the ICER for the cost-effective HPV DNA test every five years with Pap test triage strategy is €10,927/QALE.
DISCUSSION AND CONCLUSIONS
Perspectives on cervical cancer prevention are changing due to new opportunities and technological innovations. The impact of the HPV vaccination on the burden of cervical cancer has been the object of several cost-effectiveness analyses published in recent years. Little is known about the costs and benefits of the HPV vaccine and HPV DNA testing in Italy. By applying a general model to Italian data, Kim et al. 9 explored alternative protocols without vaccination and identified that both HPV DNA testing strategies and HPV triage with combination testing were more effective than the current screening policy. Capri et al. 11 and Mennini et al. 12 showed that HPV vaccination within the current screening programme would avoid about 61–63% of cervical cancer cases and it is cost-effective.
Strategies for women who are not vaccinated
We observed that the current strategy of the Pap test every three years has a lifetime risk of 65 per 10,000 women and a lifetime cost €160 and it is strongly dominated by the alternative of a HPV DNA primary test every five years followed by Pap test triage (Figure 2). This is not surprising due to the lower sensitivity and lack of reproducibility of cytological diagnosis in the current strategy of the Pap test every three years. 7 The HPV DNA test every three years with Pap test triage has a lifetime risk of 61 (per 10,000) for unvaccinated women and a lifetime cost of €175. The same strategy every five years has a lifetime risk of 62 (per 10,000) and a cost of €136. This means that by balancing costs and benefits an interval of five years would be preferable. This result strongly supports the position of abandoning the Pap test screening programme in favour of the less frequent tests of the HPV DNA with Pap test triage. In our opinion, two other arguments support the hypothesis of changing the current protocol. The first raises an organizational aspect: a five-year interval compared with a three-year interval would allow for more concentration of resources focused on expanding the coverage of the target population. The second aspect is concerned with what the costs of the programme would be in the future. The HPV DNA testing process consumes fewer resources than the Pap smear and it is probable that in the near future the cost of this procedure would become relatively less costly than the Pap test.
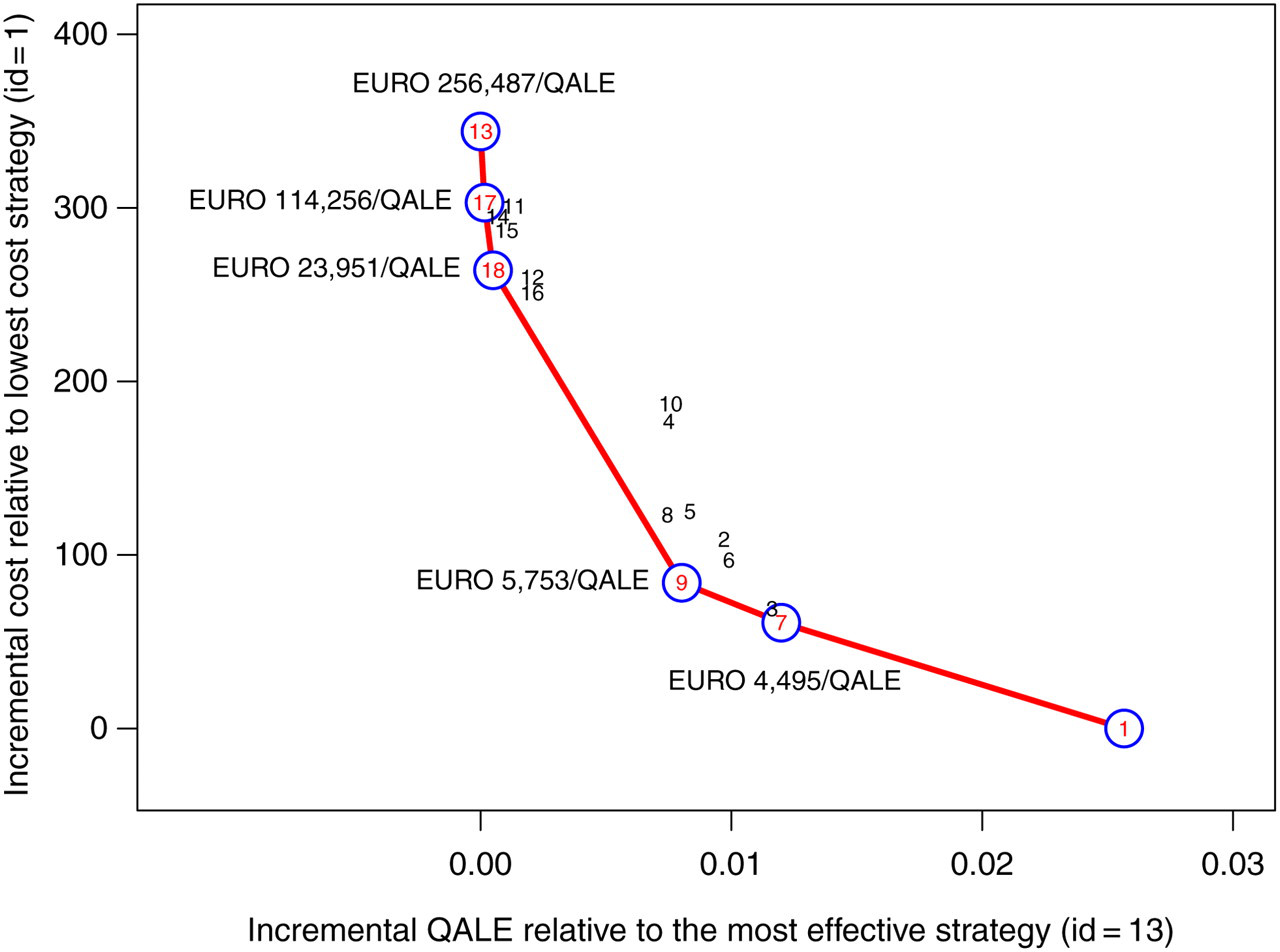
Incremental cost–disutility plane and incremental cost-effectiveness ratios for all strategies, including screening only, vaccination of preadolescent girls and screening and vaccination used in combination. In the cost–disutility plane the incremental costs (€) are relative to the least expensive strategy (id = 1); the incremental QALE are relative to the most effective strategy (id = 13). Strategies that lie on the efficiency red curve dominate those to the right of the curve. ICER (€ per QALE gained) is calculated as the difference in cost divided by the difference in QALE for each strategy compared with the next best strategy. For the identification numbers see Table 2. QALE, quality-adjusted life-expectancy; ICER, incremental cost-effectiveness ratio
Strategies for women who are eligible to be vaccinated
Our results show that the vaccine alone is comparable in terms of lifetime risk with the Pap test every three years. An HPV DNA test every five years with the Pap test triage is cost-effective. The positive predictive value of screening will decrease as the prevalence of cervical lesions decreases with vaccination. This could lead to an increase in unnecessary colposcopy and over treatment of unimportant lesions. 29 As a result, if not counteracted by lengthening screening intervals, the rate of false-positive results will increase. Since positive women will require expensive work-ups, this will have an adverse impact on both health outcomes and costs of the screening programme. Another reason for lengthening screening intervals is that sojourn times for hrHPV non-16/18 are reported to be longer. 30
There are limitations to this analysis. First, even with a good fit, we cannot exclude that searching with more extensive parameter sets might improve calibration of the observed data. Second, the model adopted in this study did not take into account cross-protection against hrHPV non-16/18. There is now evidence that both vaccines also provide some level of cross-protection. 26,31,32 If durable, cross-protection would add an additional 6% protection against cervical cancer to the 70% afforded by preventing hrHPV 16/18. 32,33 Third, we did not model multiple hrHPV infections. Therefore, vaccination seemed to reduce the incidence of hrHPV infections. However, vaccinated women are at risk for acquiring other hrHPV types and the incidence of hrHPV non-16/18 could increase. Fourth, we did not include the averted costs associated with lesions and genital warts attributable to HPV 6/11. Finally, we used available Italian data in our ABC analysis. Costs can vary in the near future and organizational peculiarity among and within countries can contribute to the final cost of each strategy.
Vaccine and screening coverage plays an important role in determining what the overall impact of vaccination and screening will be. In our model, we assumed 100% vaccine coverage and around 70% for screening. If high levels of vaccine coverage are attainable in all preadolescents, screening behaviour might be different. A false sense of security due to vaccination could bring about a decline in the compliance of vaccinated women for cervical screening.
Our results provide evidence to support the change towards the use of primary HPV DNA testing every five years with Pap triage for both vaccinated and unvaccinated women. The next important issue concerns the optimization of a comprehensive programme that includes both primary and secondary prevention with age-based strategies.
Footnotes
ACKNOWLEDGEMENTS
This work was supported by the Italian Ministry of Health, project no. 23070/p/I.9A, ‘Modelli statistici di previsione dell'impatto della vaccinazione dell'infezione per virus HPV nella prevenzione del carcinoma della cervice uterina nell'ambito di un programma di sanità pubblica.’
APPENDIX A
Transition probabilities, base case values and data sources
| Parameters – age (years) | Baseline values* | Data sources |
|---|---|---|
|
|
Myers et al. 17 | |
| 15–16 | 0.09 | |
| 17 | 0.11 | |
| 18 | 0.14 | |
| 19 | 0.16 | |
| 20 | 0.14 | |
| 21 | 0.11 | |
| 22–23 | 0.09 | |
| 24–29 | 0.049 | |
| 30–49 | 0.01 | |
| ≥50 | 0.005 | |
|
|
Kim et al. 15 | |
| 15–20 | 64.9 × 10⁻⁴ (age–15) + 17.98 × 10⁻⁴ | |
| 21–30 | 34.25 × 10⁻³ | |
| 31–40 | 23.74 × 10⁻³ | |
| 41–65 | −9.14 × 10⁻⁴ (age–41) + 23.74 × 10⁻³ | |
|
|
Kim et al. 15 | |
| 15–24 | 0.37 | |
| 25–29 | 0.28 | |
| ≥30 | 0.09 | |
|
|
Kim et al. 15 | |
| 15–40 | 16.05 × 10⁻⁴ (age–15) + 57.24 × 10⁻³ | |
| ≥41 | 97.36 × 10⁻³ | |
|
|
Kim et al. 15 | |
| 15–40 | 9.09 × 10⁻⁵ (age–15) + 58.38 × 10⁻³ | |
| ≥41 | 58.38 × 10⁻³ | |
|
|
Kim et al. 15 | |
| 15–40 | 16.89 × 10⁻⁴ (age–15) + 35.94 × 10⁻⁴ | |
| ≥41 | 45.81 × 10⁻³ | |
|
|
Kim et al. 15 | |
| 15–40 | 33.43 × 10⁻⁵ (age–15) + 11.99 × 10⁻⁴ | |
| ≥41 | 95.58 × 10⁻⁴ | |
|
|
Myers et al. 17 | |
| 15–34 | 0.0165 | |
| ≥35 | 0.0567 | |
| High-grade lesions regression (25% healthy, 25% HPV infection, 50% low-grade lesions) | 0.0567 | Myers et al. 17 |
|
|
Kim et al. 15 | |
| 15–30 | 7.16 × 10⁻⁵ (age–15) + 11.99 × 10⁻⁴ | |
| 31–50 | 30.39 × 10⁻⁴ (age–31) + 11.93 × 10⁻³ | |
| ≥51 | 69.67 × 10⁻³ | |
| Local cancer to regional cancer | 0.2153 | Kim et al. 15 |
| Regional cancer to distant cancer | 0.262 | Kim et al. 15 |
hrHPV, high-risk human papillomavirus; lrHPV, low-risk human papillomavirus
*We derived baseline values from published data sources