
Abstract
Objectives
To analyse cervical screening coverage data by age over time in a number of developed countries throughout the world, with specific emphasis on trends for younger women and on age differentials between younger and older women.
Methods
Routinely collected cervical screening statistics and survey data were collected on the proportion of women who have undergone cervical screening with cytology in seven countries in the period 1995 to 2005.
Results
Data for the 25-29 age group were examined. Coverage fell in most countries, in three by more than 5 percentage points. In two countries while overall coverage rose in the period, the rise was not as steep in the youngest group of women. Data for each available 5-year age group for the different countries shows a similar gradient in most, regardless of the absolute level of coverage. Although the trend is not uniform in every country, it appears that generally the gap between coverage of younger women and coverage of older women increased, sometimes dramatically, between the mid-1990s and the mid-2000s.
Conclusions
There is a general trend in developed countries towards lower coverage in young women (25-29 years old). No common underlying cause has been clearly identified and there is a need for further studies to investigate the possible reasons for this phenomenon.
Introduction
Following publication of the 2008 paper, cervical screening coordinators from several countries across the developed world were contacted with a request for data that could be compared with the data for England.
The questions this analysis sought to answer were: has the fall in coverage observed in younger women in England also been observed in other countries for which data were obtained, and has the differential in coverage between younger women and older women, which has increased in England, also risen in these other countries.
Methods
Data availability and programme statistics
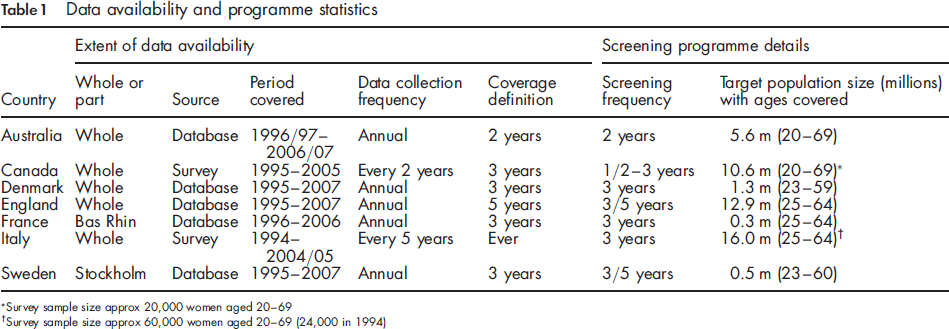
Survey sample size approx 20,000 women aged 20-69
Survey sample size approx 60,000 women aged 20-69 (24,000 in 1994)
Whole country data were available for all countries except France and Sweden. The data came from programme databases except for Italy and Canada, where the estimates came from population surveys. Most countries were able to provide an 11-year span of data commencing in 1995, though for some not every year was covered. Four of the seven countries based their coverage estimates on a three-year participation period; the exceptions were Australia (2-year), England (5-year) and Italy (lifetime).
The differences in the material available from the seven countries make direct comparisons difficult. However, as the principal aim of this analysis was to examine changes and differences in the levels of change between countries, it was considered that simple measures of change would be adequate for our purposes. It was clear from the outset that analysis of the data in cohort terms (as was done in the 2008 paper) would not be possible.
Accordingly, the principal measure chosen for the analysis was the absolute difference in coverage (in percentage points) between 1995 and 2005. Where data for these years were not available, the earliest available start year was chosen together with an end year ten years later, or as close to this as possible.
Results
Coverage of women aged 25-29, 1995 and 2005
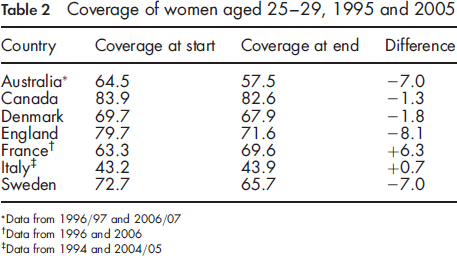
Data from 1996/97 and 2006/07
Data from 1996 and 2006
Data from 1994 and 2004/05
The changes observed in coverage between 1995 and 2005 did not necessarily reflect uniform trends throughout the whole of the period (Figure 1). Data for Sweden, in particular, which are based on the Stockholm area alone, varied considerably from year to year.
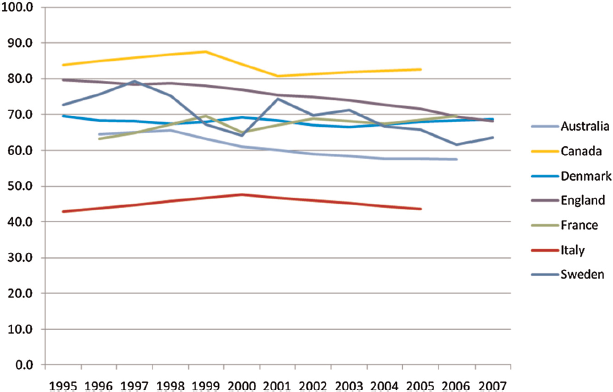
Coverage of women aged 25-29, 1995 to 2007
In Figure 2, it can be seen that the English data showed a lower degree of coverage reduction with each older age group; indeed for age groups 55-59 and 60-64 coverage in England was higher in 2005 than it had been in 1995. Corresponding data for each available 5-year age group for the different countries shows a similar gradient in most, regardless of the absolute level of coverage. Although the trend is not uniform in every country, it appears that generally the gap between coverage of younger women and coverage of older women increased, sometimes dramatically, between the mid-1990s and the mid-2000s.
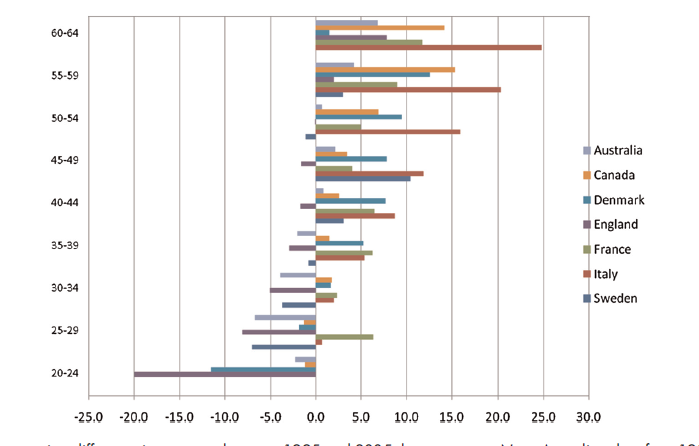
Percentage points difference in coverage between 1995 and 2005, by age group. Note: Australian data from 1996/97 and 2006/07, French data from 1996 and 2006, Italian data from 1994 and 2004/05, Swedish 50-54 and 55-59 data from 1997 and 2007
Discussion
The disparity in cervical screening coverage between younger and older women, discussed previously in relation to England, appears to be part of a broader phenomenon and can be seen in a range of other developed countries. No clear common underlying cause has been identified. Those working in the countries contributing data to this analysis could, in fact, often provide local reasons for the observed trends and differences.
In countries with organized cervical screening programmes in place for many years, local reasons were principally practical or financial. In Denmark, participation rates may have been lower in the 1990s because of difficulties experienced by women in contacting GPs for smear appointments. In Sweden (Stockholm), screening was free in 1995 but became subject to charging from mid-2003 to the end of 2004 after which it became free again; coverage rates, however, did not return to their pre-2003 levels. These reasons, however, are expected to have an impact on all ages, not specifically on the youngest. In Australia, the lack of a national campaign for cervical screening since 1998-99 may have affected later coverage; thus many women first screened in the early stages of the programme were exposed to a message encouraging a two-year screening interval (or were screened annually by their GP) and so were possibly more committed to frequent screening than women who entered the programme subsequently.
In Italy and in France (Bas-Rhin) active invitations to screening started or increased during the studied period. In Bas-Rhin screening began in 1994 and for three years no invitation or advertising took place. From the start, however, all smears taken in the target population (25-64) were registered. 2 The rise in coverage between 1996 and 2006 may well reflect the benefits of organization, particularly for the youngest (25-29) and oldest (55-64) women who were less covered by opportunistic gynaecological screening, while the decrease for women aged 30-34 may follow the pattern of other countries. In Italy organized cervical screening started progressively on a regional basis. In 1996 only a few organized programmes, covering less than 10% of women in the target age (25 to 64 years) were active, while in 2005 67% of Italian women in the target age were included in the target population of organized programmes. 3 Increases in coverage also plausibly reflect the benefits of organization. However, such increases were much larger among older women and very limited among younger women. Therefore the differential in coverage between older and younger women also increased from the mid 1990s to the mid 2000s.
In much of Canada, cervical cytology is delivered in an opportunistic fashion, without letters of invitation or reminders. Nonetheless, a sizeable proportion of women were screened annually, particularly during the earlier years of the study period. Billing record data on uptake from Ontario province suggest a level of uptake about 10% lower than rates self-reported in the national survey. The Ontario data showed a decrease of 3.5% in uptake among 20-29 year olds between 1999-2001 and 2005-07 compared with increases in the older age groups. 4 Similarly, data from the province of British Columbia showed a decline from 78% to 66% in uptake for 20-24 year olds between 1995-97 and 2002-04. 5
The fact that similar patterns were found throughout all the programme statistics suggests the existence of general factors that have affected coverage more widely, though data to substantiate these are difficult to obtain. Possible factors of this kind already raised in the earlier paper 1 in relation to the observations from England include an increasing emphasis on patient choice, greater distrust of health services and screening in particular, disillusion with public services generally, and even the perceived diminution in importance of cervical cancer as a threat to women due to the success of the screening programme itself.
A further factor may be the increasing age of women when they first give birth. In England, about one-third of first-time mothers in 2000 were aged 30 or over, compared with only one-fifth in 1990. 6 Many other countries report a similar trend. Delaying family formation until age 30 or beyond removes many women from regular contact with health services, which would otherwise have prompted them to be screened. Data from a recent English opinion poll show coverage for women who have never had children to be over 10 percentage points below coverage for women who have had children. 7 Delaying family formation could also affect a young woman's personal perception of the biology of her reproductive organs.
It is interesting to note the developing thinking behind the starting age for screening in an environment where human papillomavirus (HPV) vaccination is widely available. With the possibility of a later starting age and longer screening intervals, the impact of a decline in coverage of younger women may become of less importance in the future. Meanwhile, of course, there remain large unvaccinated cohorts of women even in countries such as Australia, Canada, England, France and Italy where HPV vaccination programmes are already under way.
One-off events can also have a part to play. The well-publicized death from cervical cancer of the celebrity Jade Goody (aged 27) in early 2009 prompted a surge in demand among women aged under 30 in England. Recent opinion poll data suggest that an all-ages increase in uptake attributable to the publicity around Jade Goody of about 5 percentage points could be achieved if women's stated intentions in fact result in their being screened, with a possible 10 percentage points increase among women aged 25-29. 7 As the increase in uptake would have taken place over two reporting years, it could be 2010-11 before the full effect is seen in the England annual statistics. There may also have been a similar effect in other countries where there was coverage of Jade Goody's illness and death. It remains to be seen whether these recent events would have a lasting effect on coverage rates in the longer term.
Conclusions
Age differences in the pattern of cervical screening coverage observed in England appear to be part of a more general trend in developed countries. No common underlying cause has been clearly identified and there is a need for further studies to investigate the possible reasons for this phenomenon.
Footnotes
Appendix
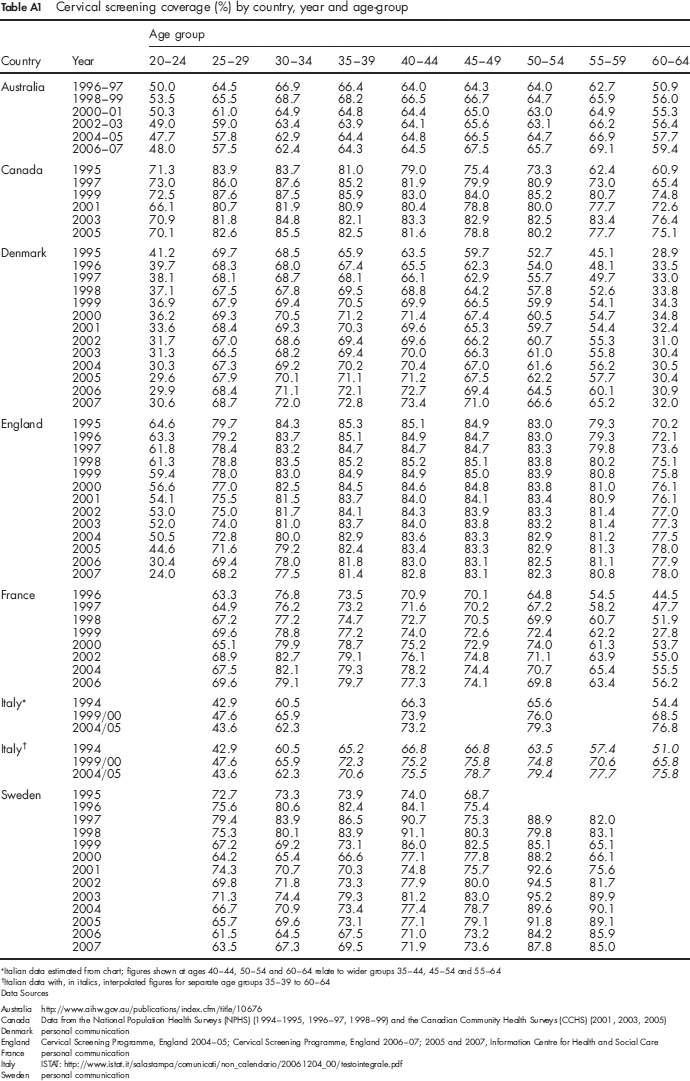
Coverage of women aged 25-29, 1995 and 2005
| Age group |
||||||||||
|---|---|---|---|---|---|---|---|---|---|---|
| Country | Year | 20-24 | 25-29 | 30-34 | 35-39 | 40-44 | 45-49 | 50-54 | 55-59 | 60-64 |
| Australia | 1996-97 | 50.0 | 64.5 | 66.9 | 66.4 | 64.0 | 64.3 | 64.0 | 62.7 | 50.9 |
| 1998-99 | 53.5 | 65.5 | 68.7 | 68.2 | 66.5 | 66.7 | 64.7 | 65.9 | 56.0 | |
| 2000-01 | 50.3 | 61.0 | 64.9 | 64.8 | 64.4 | 65.0 | 63.0 | 64.9 | 55.3 | |
| 2002-03 | 49.0 | 59.0 | 63.4 | 63.9 | 64.1 | 65.6 | 63.1 | 66.2 | 56.4 | |
| 2004-05 | 47.7 | 57.8 | 62.9 | 64.4 | 64.8 | 66.5 | 64.7 | 66.9 | 57.7 | |
| 2006-07 | 48.0 | 57.5 | 62.4 | 64.3 | 64.5 | 67.5 | 65.7 | 69.1 | 59.4 | |
| Canada | 1995 | 71.3 | 83.9 | 83.7 | 81.0 | 79.0 | 75.4 | 73.3 | 62.4 | 60.9 |
| 1997 | 73.0 | 86.0 | 87.6 | 85.2 | 81.9 | 79.9 | 80.9 | 73.0 | 65.4 | |
| 1999 | 72.5 | 87.6 | 87.5 | 85.9 | 83.0 | 84.0 | 85.2 | 80.7 | 74.8 | |
| 2001 | 66.1 | 80.7 | 81.9 | 80.9 | 80.4 | 78.8 | 80.0 | 77.7 | 72.6 | |
| 2003 | 70.9 | 81.8 | 84.8 | 82.1 | 83.3 | 82.9 | 82.5 | 83.4 | 76.4 | |
| 2005 | 70.1 | 82.6 | 85.5 | 82.5 | 81.6 | 78.8 | 80.2 | 77.7 | 75.1 | |
| Denmark | 1995 | 41.2 | 69.7 | 68.5 | 65.9 | 63.5 | 59.7 | 52.7 | 45.1 | 28.9 |
| 1996 | 39.7 | 68.3 | 68.0 | 67.4 | 65.5 | 62.3 | 54.0 | 48.1 | 33.5 | |
| 1997 | 38.1 | 68.1 | 68.7 | 68.1 | 66.1 | 62.9 | 55.7 | 49.7 | 33.0 | |
| 1998 | 37.1 | 67.5 | 67.8 | 69.5 | 68.8 | 64.2 | 57.8 | 52.6 | 33.8 | |
| 1999 | 36.9 | 67.9 | 69.4 | 70.5 | 69.9 | 66.5 | 59.9 | 54.1 | 34.3 | |
| 2000 | 36.2 | 69.3 | 70.5 | 71.2 | 71.4 | 67.4 | 60.5 | 54.7 | 34.8 | |
| 2001 | 33.6 | 68.4 | 69.3 | 70.3 | 69.6 | 65.3 | 59.7 | 54.4 | 32.4 | |
| 2002 | 31.7 | 67.0 | 68.6 | 69.4 | 69.6 | 66.2 | 60.7 | 55.3 | 31.0 | |
| 2003 | 31.3 | 66.5 | 68.2 | 69.4 | 70.0 | 66.3 | 61.0 | 55.8 | 30.4 | |
| 2004 | 30.3 | 67.3 | 69.2 | 70.2 | 70.4 | 67.0 | 61.6 | 56.2 | 30.5 | |
| 2005 | 29.6 | 67.9 | 70.1 | 71.1 | 71.2 | 67.5 | 62.2 | 57.7 | 30.4 | |
| 2006 | 29.9 | 68.4 | 71.1 | 72.1 | 72.7 | 69.4 | 64.5 | 60.1 | 30.9 | |
| 2007 | 30.6 | 68.7 | 72.0 | 72.8 | 73.4 | 71.0 | 66.6 | 65.2 | 32.0 | |
| England | 1995 | 64.6 | 79.7 | 84.3 | 85.3 | 85.1 | 84.9 | 83.0 | 79.3 | 70.2 |
| 1996 | 63.3 | 79.2 | 83.7 | 85.1 | 84.9 | 84.7 | 83.0 | 79.3 | 72.1 | |
| 1997 | 61.8 | 78.4 | 83.2 | 84.7 | 84.7 | 84.7 | 83.3 | 79.8 | 73.6 | |
| 1998 | 61.3 | 78.8 | 83.5 | 85.2 | 85.2 | 85.1 | 83.8 | 80.2 | 75.1 | |
| 1999 | 59.4 | 78.0 | 83.0 | 84.9 | 84.9 | 85.0 | 83.9 | 80.8 | 75.8 | |
| 2000 | 56.6 | 77.0 | 82.5 | 84.5 | 84.6 | 84.8 | 83.8 | 81.0 | 76.1 | |
| 2001 | 54.1 | 75.5 | 81.5 | 83.7 | 84.0 | 84.1 | 83.4 | 80.9 | 76.1 | |
| 2002 | 53.0 | 75.0 | 81.7 | 84.1 | 84.3 | 83.9 | 83.3 | 81.4 | 77.0 | |
| 2003 | 52.0 | 74.0 | 81.0 | 83.7 | 84.0 | 83.8 | 83.2 | 81.4 | 77.3 | |
| 2004 | 50.5 | 72.8 | 80.0 | 82.9 | 83.6 | 83.3 | 82.9 | 81.2 | 77.5 | |
| 2005 | 44.6 | 71.6 | 79.2 | 82.4 | 83.4 | 83.3 | 82.9 | 81.3 | 78.0 | |
| 2006 | 30.4 | 69.4 | 78.0 | 81.8 | 83.0 | 83.1 | 82.5 | 81.1 | 77.9 | |
| 2007 | 24.0 | 68.2 | 77.5 | 81.4 | 82.8 | 83.1 | 82.3 | 80.8 | 78.0 | |
| France | 1996 | 63.3 | 76.8 | 73.5 | 70.9 | 70.1 | 64.8 | 54.5 | 44.5 | |
| 1997 | 64.9 | 76.2 | 73.2 | 71.6 | 70.2 | 67.2 | 58.2 | 47.7 | ||
| 1998 | 67.2 | 77.2 | 74.7 | 72.7 | 70.5 | 69.9 | 60.7 | 51.9 | ||
| 1999 | 69.6 | 78.8 | 77.2 | 74.0 | 72.6 | 72.4 | 62.2 | 27.8 | ||
| 2000 | 65.1 | 79.9 | 78.7 | 75.2 | 72.9 | 74.0 | 61.3 | 53.7 | ||
| 2002 | 68.9 | 82.7 | 79.1 | 76.1 | 74.8 | 71.1 | 63.9 | 55.0 | ||
| 2004 | 67.5 | 82.1 | 79.3 | 78.2 | 74.4 | 70.7 | 65.4 | 55.5 | ||
| 2006 | 69.6 | 79.1 | 79.7 | 77.3 | 74.1 | 69.8 | 63.4 | 56.2 | ||
| Italy* | 1994 | 42.9 | 60.5 | 66.3 | 65.6 | 54.4 | ||||
| 1999/00 | 47.6 | 65.9 | 73.9 | 76.0 | 68.5 | |||||
| 2004/05 | 43.6 | 62.3 | 73.2 | 79.3 | 76.8 | |||||
| Italy† | 1994 | 42.9 | 60.5 | 65.2 | 66.8 | 66.8 | 63.5 | 57.4 | 51.0 | |
| 1999/00 | 47.6 | 65.9 | 72.3 | 75.2 | 75.8 | 74.8 | 70.6 | 65.8 | ||
| 2004/05 | 43.6 | 62.3 | 70.6 | 75.5 | 78.7 | 79.4 | 77.7 | 75.8 | ||
| Sweden | 1995 | 72.7 | 73.3 | 73.9 | 74.0 | 68.7 | ||||
| 1996 | 75.6 | 80.6 | 82.4 | 84.1 | 75.4 | |||||
| 1997 | 79.4 | 83.9 | 86.5 | 90.7 | 75.3 | 88.9 | 82.0 | |||
| 1998 | 75.3 | 80.1 | 83.9 | 91.1 | 80.3 | 79.8 | 83.1 | |||
| 1999 | 67.2 | 69.2 | 73.1 | 86.0 | 82.5 | 85.1 | 65.1 | |||
| 2000 | 64.2 | 65.4 | 66.6 | 77.1 | 77.8 | 88.2 | 66.1 | |||
| 2001 | 74.3 | 70.7 | 70.3 | 74.8 | 75.7 | 92.6 | 75.6 | |||
| 2002 | 69.8 | 71.8 | 73.3 | 77.9 | 80.0 | 94.5 | 81.7 | |||
| 2003 | 71.3 | 74.4 | 79.3 | 81.2 | 83.0 | 95.2 | 89.9 | |||
| 2004 | 66.7 | 70.9 | 73.4 | 77.4 | 78.7 | 89.6 | 90.1 | |||
| 2005 | 65.7 | 69.6 | 73.1 | 77.1 | 79.1 | 91.8 | 89.1 | |||
| 2006 | 61.5 | 64.5 | 67.5 | 71.0 | 73.2 | 84.2 | 85.9 | |||
| 2007 | 63.5 | 67.3 | 69.5 | 71.9 | 73.6 | 87.8 | 85.0 | |||
Italian data estimated from chart; figures shown at ages 40-44, 50-54 and 60-64 relate to wider groups 35-44, 45-54 and 55-64
Italian data with, in italics, interpolated figures for separate age groups 35-39 to 60-64