
Abstract
Background
The recently published European Randomized Study of Screening for Prostate Cancer (ERSPC) reported prostate specific antigen (PSA)-based screening to have reduced the prostate cancer death rate by only 20%. However, this is an underestimate caused by (i) including in the 20% the years before the impact of the first screen becomes manifest, and (ii) not having full information for the follow-up years where the effects of the screening are most apparent. This paper provides a re-analysis of the results using time-specific measures, which avoid the first of these sources of error.
Methods
Mortality rate ratios for follow-up years 1-12 were derived from the yearly numbers of prostate cancer deaths and numbers of men being followed in each arm of the ERSPC. To reduce statistical noise, they were based on moving three-year intervals, and a smooth rate ratio curve was fitted to the yearly data, in order to measure the steady state reduction in mortality and to identify the time at which it reached this level.
Results
The re-analysis suggests that the sustained reduction in prostate cancer mortality may be more than 50%.
Conclusion
Re-analysis of the ERSPC data suggests that if screening is carried out for several years, and if follow-up is pursued until the reduction becomes manifest, the reduction in mortality will be 50-60%. An analysis that includes the 2007-2008 follow-up data is required to quantify more precisely the impact of this intervention.
Introduction
However, the 20% reduction is a substantial underestimate, for two reasons. First, there is a considerable delay between the time screening starts and the time the effect is expected to be observed; the estimated 20% is an average of the null reductions in years 1-7, before benefits could become apparent, and the substantial reductions that began to appear from year 8 onwards. Second, the (proportional-hazards-type) summary measure (the 20%) is sensitive to the duration of follow-up, which closed at the end of 2006, after an average of just nine years of follow-up (range 3-15). A re-analysis of these ERSPC data that uses yearly rate ratios to avoid these two sources of error suggests a mortality reduction, due to screening, of more than 50%. However, a more precise measure will not be available until the critical data from 2007 and 2008 (and beyond) are included in the analysis.
Methods
Five randomized trials of prostate cancer screening have now been reported. The numbers of men invited to the screening arm in the two Swedish studies2,3 were 1500 and 2400, respectively. The Quebec 4 and USA 5 studies enrolled a combined total of 123,000 men (69,000 in the combined screening arms), but in each of these two studies the actual screening activities in the screening and control arms differed so little that at best only a small difference in prostate cancer mortality could be expected. The ERSPC enrolled 162,000 men aged 55-69 years at intake. The larger sample size and substantial difference in the participation rates in the two arms meant that it has considerably greater resolving power.
In the ERSPC report, the effect of screening on prostate cancer mortality was expressed as one number, derived from the numbers of prostate cancer deaths over the entire period of observation available for each man (range 3-15, average 9 years). Over this period, there were 214 prostate cancer deaths in 643,401 man-years of observation in the screening group and 326 in 785,585 man-years in the control group. These are the basis for the reported rate ratio of 0.80, and the conclusion that ‘prostate specific antigen (PSA)-based screening reduced the rate of death from prostate cancer by 20%’ (95% CI: 2-35%). The article in the New England Journal of Medicine 1 (NEJM) also contained a graph showing, for each arm, the ‘cumulative risk’ of death from prostate cancer. The two curves in this key graph are redrawn in the current Figure 1a. On the basis of these curves, the authors did note that ‘the rates of (prostate cancer) death in the two study groups began to diverge after seven to eight years and continued to diverge further over time’. This divergence is here quantified, because it provides a more appropriate and meaningful measure of the reduction in mortality produced by screening than the reported 20% figure.
Comparison of prostate cancer mortality rates in two arms of European Randomized Study of Screening for Prostate Cancer (ERSPC). The graphs and numbers in this figure are based on the individual-patient-data extracted from the individual-level postscript commands used in 2 of the NEJM report. For details on how these individual data were extracted, see the Methods section of the present report. (a) Cumulative mortality curves, presented in the same format as in the original publication. As noted by the authors, ‘the rates of (prostate cancer) death in the two study groups began to diverge after seven to eight years and continued to diverge further over time’. However, they included the years of zero effect in their estimate of a reduction of overall average mortality of 20% (mortality rate ratio 0.80). ‘This is not an appropriate measure of the impact of screening, since the numbers of cures attributable to the screening in year 1 to year T only become apparent (as lower mortality rates in the screened than the control arm) in year (1 + ?) to year (T + ??)’. Note that T varied somewhat across the seven ERSPC countries, and is used in a generic sense here. (b) Yearly prostate cancer mortality rate ratios, used for re-analysis. These are designed to measure the timing and extent of the prostate cancer mortality reduction in years (1 + ?) to (T + ??) as a result of the screening in years 1 to I Each rate ratio was calculated by dividing the observed rate of prostate cancer deaths in the screening arm by the corresponding rate in the control arm. The rate ratio shown above a given year is based on the data for that year together with the data in the years immediately preceding and following it. The upper end of each vertical line denotes the upper 95% limit of the percentage reduction in prostate-cancer mortality: the reductions in the three-year intervals centered on years 9 and beyond are statistically significant. The dotted line, with an asymptote of 67%, beginning at 12 years, was fitted using the method of maximum likelihood (see Appendix A). The two shaded regions represent the 50% and 80% confidence regions for these two parameters. The 80% CI associated with the 67% asymptote, derived from the vertical range of the lighter grey region at 12 years, is 30-89%. The results of the re-analysis using time-specific rate ratios indicate that the cures attributable to the screening in study year t only begin to become statistically apparent by year t + 7 and later. They also indicate that of those in the control arm who died (or will die) of prostate cancer in years 8-12 of the study, possibly as many as half of them would not have died of prostate cancer had they been offered the programme. The 25-60% reductions seen in years 8-12 of the study suggest a much greater numbers of cures attributable to the screening in year 1 to year T than the single overall 20% figure reported in the original article, but further follow-up data are required to make a precise estimate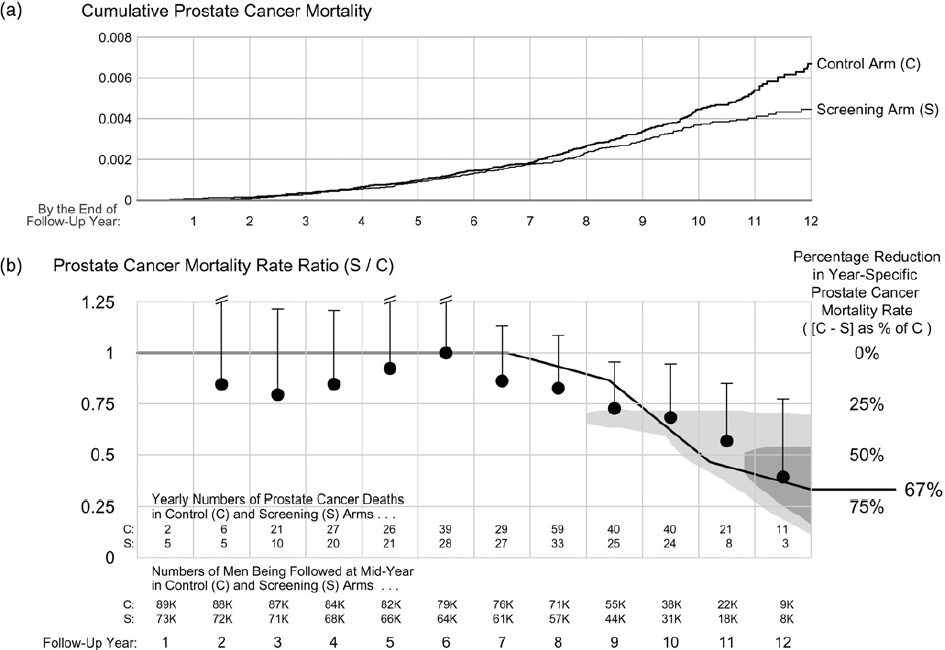
When studying the results of interventions which have virtually immediate effects, such as vaccinations, 6 many medications 7 and screening for abdominal aortic aneurysms, 8 it is logical to cumulate the outcome events from the time the intervention commenced, and to report a single rate ratio derived from a proportional hazards model. However, as is seen in Figure 1a, there is a delay of several years until the benefit of prostate cancer screening becomes manifest and a single average mortality reduction, obtained by cumulating all prostate cancer deaths, will underestimate the effect. 9 11 This underestimation is considerable if the period of follow-up before the intervention has any effect makes up a substantial portion of the entire period of follow-up available. Underestimation will also result if the follow-up does not extend far enough to include the period when the effects of sustained screening become most apparent. Both the timing and extent of the reduction become much more evident if one examines prostate cancer mortality in intervals of the follow-up (one-year intervals will be used here).
Therefore, year-by-year mortality rate ratios were derived from the yearly numbers of prostate cancer deaths and numbers of men being followed in each arm. To do so, the pdf file containing 2 of the NEJM report was saved into an encapsulated postscript (eps) file format, and from this eps file, the exact information was extracted (namely, the coordinates of the line segments and dots) that the statistical programme, Stata, had used to draw the two Nelson-Aalen cumulative hazard curves. The eps file contained the exact coordinates of each of 89,308 and 72,837 line segments or dots, one per man. The horizontal and vertical coordinates of each of these segments/dots provided the exact numbers of men being followed at each point in follow-up time, and thus at the exact times of the vertical steps in the curves (corresponding to prostate cancer deaths). The number of prostate cancer deaths at each time point was obtained by multiplying the size of the step by the number being followed at that time. The numbers were then aggregated by year and study arm to produce the counts listed in Figure 1b.
Given the paucity of follow-up beyond year 12, the re-analysis was limited to the yearly mortality ratios for each of the first 12 years. To reduce the statistical noise, these were based on the deaths in moving three-year intervals, so that the ratio and upper limit of the 95% CI shown above a given year are based on the data for that year together with those in the years immediately preceding and following it; those for year 12 are based on the numbers of deaths in years 11 and 12 combined. The total number of prostate cancer deaths in year one was fewer than 10, and so a rate ratio for this first year is not shown.
Despite this strategy to reduce noise, the observed prostate cancer mortality rate ratios in the ERSPC study did not follow a perfectly smooth time-curve. This is understandable, as each of the two numerators that contribute to each observed rate ratio is subject to separate Poisson variation that is substantial when event rates are low; the observed fluctuations may also reflect the merging of data from seven ERSPC countries with somewhat differing screening intensities and differing durations of follow-up. Thus, in order to measure the steady state reduction in mortality, and to identify when it reached this level, as precisely as the data allow, a formal statistical procedure was used to fit a smooth rate ratio function to the mortality data, grouped into bins 1/5 of a year wide. Candidate curves used were those with the same general form as the one fitted in Figure 1b, because repeated four-year screening interval was used in the countries that contributed more than 80% of the men, and the death rate in the screening arm would not be expected to have begun to revert upwards towards that in the control arm until after the end of year 12. The curve has three parameters, when the mortality rate ratio first declines, the steady state reduction that is reached, and when it is reached. The when (i.e. the length of the delay until the reduction reaches a steady state) is a function of the screening regimen, and cannot be specified in advance, although it is expected to be several years. Thus it was derived from the observed data, using the method described in the Supplementary Material. The use of a formal curve-fitting approach to provide the best-fitting values of the curve's three parameters removes the element of subjectivity: otherwise, different readers might ‘see’ different degrees of reduction in the same set of rate ratios shown in Figure 1b.
Results
The yearly numbers of prostate cancer deaths in each ERSPC arm, along with the mortality rate ratios for the intervals centered on years 2 to 12, are shown in Figure 1b. They indicate that after an expected delay (which the data indicate is approximately 7 years), the prostate mortality reductions that become evident in years 9 and beyond are statistically significant and considerably greater than the reported 20% reduction in the rate of prostate cancer deaths.
A formal curve fitting was also performed. Not surprisingly, the best (Maximum Likelihood) estimate is that, although the rate ratio became non-null starting at approximately 6.5 years, the steady state reduction has not yet been reached: the point estimate so far is a sustained 67% reduction (80% CI: 30-89%) beginning at year 12. Moreover, as can be seen from the wide confidence region, the numbers of deaths are not sufficient to establish its timing and magnitude more precisely.
Discussion
The ‘downsides’ of PSA-based prostate cancer screening are well documented and accepted. In order to document the ‘upside’, five randomized trials (the first of which began 23 years ago), involving 321,000 men in 10 countries and with an average follow-up ranging from 7 to 15 years, have sought to measure the reductions in prostate cancer mortality achievable by this screening. The first Swedish study used a 1:5 randomization to enrol 1500 men in the screening arm; the first two rounds of screening, in 1987 and 1990, involved digital rectal examination (DRE) only, while those in 1993 and 1996 added PSA. While 78% of the screening invitees underwent some screening, half of the men with screen-detected tumours did not receive any treatment after diagnosis. Some 1.3% of those invited, and 1.3% of those not invited, had died of prostate cancer by March 2003. In light of these features of the trial, the mortality ratio of 1.0 and the associated 95% CI of 0.6-1.6 are not surprising. In the other Swedish study, which used a 1:10 randomization, 2400 men were invited to one round of screening involving DRE and PSA. Some 74% invitees accepted; only 11 of the 41 men offered treatment with curative intent for their screen-detected cancers underwent radical prostatectomy, while ‘the remainder were offered treatments which today are considered obsolete’. 3 Thus, the prostate cancer mortality ratio of 1.1 and associated 95% CI of 0.8-1.5 were, again, to be expected. The screening in the Quebec and US studies, begun in 1988 and 1993, respectively, involved PSA from the outset, and involved more sizeable numbers of men (47,000 randomized 2:1, and 77,000 randomized 1:1, respectively), and repeated PSA-based screening. However, there were only limited differences in the actual screening activity in the contrasted arms in each trial. Only 24% of the invitees in the Quebec trial were screened. Whereas the rates of compliance in the screening group in the US trial were 85% for PSA testing and 86% for DRE, the rates of screening in the control group were also very high, increasing from 40% in the first year to 52% in the sixth year for PSA testing and ranging from 41% to 46% for DRE. Moreover, the results of the US study are largely driven by prostate cancer deaths in years 1-7. In light of these features and in light of the timing of the reductions one would expect in a trial with a larger contrast in screening activity and sufficient follow-up, the absence of a mortality reduction in the Quebec and US trials is also not surprising. The much larger ERSPC, with its much larger difference in screening activity in the two arms, had considerably greater resolving power. Even though this resolving power has not yet been fully utilized to measure the signal in the very follow-up time-window where it is probably strongest, this potential can be achieved merely by collecting additional data.
It should not be concluded from the ERSPC report that the best expectation of PSA screening is a reduction in prostate cancer mortality of 20%. The time-specific re-analysis of the prostate cancer deaths in the first 12 years of follow-up suggests that if screening is carried out for several years, and if the follow-up is pursued into the window where the reduction in mortality becomes manifest, the reduction to be seen there will be 50-60%. However, although the ERSPC report was published in March 2009, the follow-up ended in December 2006, just when the pattern had begun to emerge. Thus, with the limited observations in the window where the screening benefits are expressed, it is not possible to put precise statistical bounds on this reduction, and so the prostate cancer deaths from 2007 onwards are crucial to more precisely measure the reduction achieved.
The re-analysis using yearly rate ratios avoided the dilution caused by averaging seven years of (expected) non-reductions with five years of increasingly greater reductions, but it was not able to avoid the dilution and imprecision caused by inadequate follow-up. An analysis that includes this missing follow-up and that employs a time-specific approach is awaited.
Whatever full mortality reductions emerge, those who might wish to ‘purchase’ them need to know how much they cost. Some may well consider that even if screening could achieve a sustained reduction of 67% (or even 97%), the very low prostate mortality rates in the control group means that the small absolute reductions will be achieved at an unacceptable cost. 12 (So far, only 326 or 0.36% of the 89,353 men in the control group have died of prostate cancer; our theoretical calculations suggest the number will approximately triple by follow-up year 20.) However, all would agree that biases in the estimation of benefit need to be avoided. Moreover, in view of the effort and resources that have been expended on the ERSPC thus far, it is worth pursuing a much more precise measure of the mortality reduction than the data in the 2009 report were able to provide.
The present re-analysis follows the intention-to-treat principle, using time-specific rates to reveal the non-proportional hazards pattern expected with screening data. The objective curve-fitting approach used in Figure 1b avoids the need to ‘pre-specify’ when the reduction reaches steady state; it does specify the smooth form of the rate-ratio curve, but allows the data themselves to inform us about the two essential parameters that determine it, namely the timing and extent of the prostate cancer mortality reduction caused by screening.
A time-specific analysis is, of course, only necessary when the effect of an intervention is delayed, as in the case of prostate cancer screening. By contrast, screening for abdominal aneurysms produces an immediate and sustained reduction in mortality from ruptured aneurysms, and the cumulative mortality, in this case, fully captures the benefit of screening. The results of a programme of screening competitive athletes for potentially lethal cardiovascular abnormalities 13 are a further striking example of the shape of the ‘response function’ with time, and the role of screening intensity in this. Recognition of the difference between interventions with immediate and delayed effects should prompt similar re-analyses of the data from trials of screening in other cancers, and similar analyses in yet-to-be reported cancer screening trials.
Footnotes
Acknowledgment
The author thanks C Begg, S Hanley, J Kaufman, M McGregor, G Paradis and I Shrier for their input.