
Abstract
Background
The birth prevalence of severe haemoglobinopathies such as sickle cell disease (SCD) in the Netherlands has been estimated to be at least 50 newborns per year. Neonatal screening for SCD was added to the Dutch screening programme in January 2007. We here evaluated three high performance liquid chromatography (HPLC) systems for application in neonatal screening for haemoglobinopathies, and present the results of a subsequent pilot screening programme.
Methods
The Variant NewBorn Screening (Vnbs) HPLC system (Bio-Rad) was validated by analysing 131 blood samples and blood mixtures. Subsequently, the performance of the G7 (Tosoh BioScience) and Ultra (Primus Corporation) was compared with the Vnbs. The three HPLC analysers were tested in a pilot screening programme on 21,969 dried blood spot samples from the routine Dutch neonatal screening programme.
Results
The pilot screening resulted in 188 abnormal patterns. The three HPLC devices presented comparable within-and between-run precision and detected the abnormal samples similarly. The high throughput, sampling systems, presentation of results, and integration of the chromatograms, however, were different.
Conclusion
All three analysers detected the same abnormal haemoglobins satisfactorily, but integrated the chromatograms with variable imprecision. Comparison of the results suggested that the Bio-Rad Vnbs was the preferred system. However, software adjustments were required to improve the diagnostic potential of this device for screening for β- and α-thalassaemia.
Background
Haemoglobinopathies
Prevalence
The World Health Organization estimates that over 330,000 babies are born worldwide each year with a severe form of haemoglobinopathy. 2 Because carriers are protected against malaria, the disease is primarily found in countries where malaria is, or used to be, endemic. Due to human migration, the prevalence of haemoglobinopathies is now rising in other countries 3 and several prevention programmes have been organized around the world. 4 10
Reports of low prevalence of haemoglobinopathies in the Netherlands discouraged prevention11,12 until the contrary was proven by a series of publications, which included a study performed in 2003. This study suggested that each year in the Netherlands there were an estimated 800 SCD and β-thalassaemia patients and 60 newborns with a haemoglobinopathy (1 in 3000 births). 13
The Netherlands is a country with a high variety of ethnicities and consequently there is a wide range of mutations on the α and β globin genes found in the Dutch population. 3 However, most of these mutations do not cause severe disease.
Screening
Following an advisory report from the Dutch Health Council, 14 neonatal screening for SCD and other severe haemoglobinopathies was implemented on 1 January 2007.
Newborns with screening results indicating SCD (main target), but also β-thalassaemia or HbH disease are referred to a paediatrician for confirmation and preventive treatment. The parents of the affected children are referred to a genetic centre for genetic counselling. HbS carriers are reported to the general practitioner and parents are advised to perform carrier screening to exclude a couple at risk. The choice of parents who do not wish to receive information regarding carriership of their child is respected.
Screening methods
Methods used for haemoglobinopathy screening are well established, and include haemoglobin electrophoresis, iso-electrofocusing and high performance liquid chromatography (HPLC). Compared with electrophoresis and iso-electrofocusing, HPLC is fully automated and less laborious, 15 and was therefore preferred for the Dutch neonatal screening programme.
We describe here the clinical validation of the Bio-Rad Variant Newborn Screening (Vnbs), the comparison with G7 (Tosoh BioScience) and Ultra 2 (Primus Corporation), and the results of the subsequent pilot screening carried out by the National Institute for Public Health and the Environment (RIVM) in Bilthoven and IJsselland Hospital (YSL) in Capelle aan den IJssel.
Materials and Methods
Validation Bio-Rad Vnbs
Sample collection
For the validation study of the Bio-Rad Vnbs 94 random fresh umbilical cord blood samples were collected at the Zaans Medical Center in Zaandam with full parental consent. In addition, residual umbilical cord blood from seven anonymous premature babies was provided by the Sanquin blood bank, Leiden.
To determine whether the Vnbs recognizes all common variants, 30 blood samples were prepared by mixing blood containing high HbF with adult blood containing a haemoglobin variant that was available at the time (HbA, HbS, HbC, HbD-Los Angeles, HbE or HbJ). These anonymized samples were obtained from the routine diagnostic service of the Leiden University Medical Center, Leiden. All samples were genotyped by multiplex PCR and/or direct DNA sequencing on the ABI Prism 3730 DNA Analyzer (PE biosystems Foster City/CA, USA). 16 18
The blood samples were spotted on filter paper identical to the paper used in the regular neonatal screening (Whatman #903). These dried blood spot (DBS) samples were analysed on the Vnbs within seven days after the blood had been spotted on the paper. Because whole blood with haemoglobin variants was more accessible than DBS, we used self-made DBS with whole blood and mixtures of whole blood. The whole blood samples were also analysed on the Vnbs for comparison to exclude discrepancies between the used material (whole blood or DBS).
All samples were also analysed on the Variant II, according to the manual (Bio-Rad), which has been proven to be a valid method for the recognition and quantification of nearly all common mutations associated with haemoglobinopathy in adults and neonates. 19
Sample preparation
For analysis 2.5 μL blood was diluted in 250 μL deionized water. From the DBS, 3-mm ø discs were extracted in 250 μL deionized water in a 96-well microtitre plate. To ensure better extraction, the loaded plates were put on a shaker for 5 minutes.
Comparison of HPLC systems
HPLC analysis
The HPLC systems, calibration material and control samples were used in full compliance with the manufacturers’ instructions.
Sample preparation
Into a 96-well microtitre plate, 3 mm ø DBS were extracted in deionized water (Vnbs: 230 μL; Ultra 2 and G7: 400 μL). The plates were shaken for 5-30 minutes.
Within- and between-run precision
The FAES retention time markers were analysed 20 times in one run to determine the within-run precision of all three HPLC systems. The between-run precision was determined by analysing the FAES retention markers on 20 different days.
Pilot screening
Sample collection
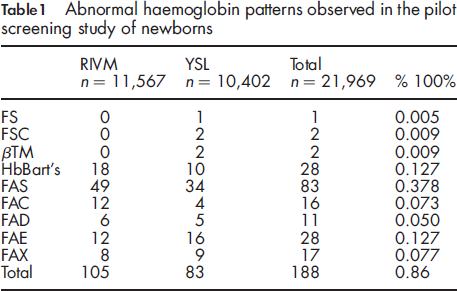
Abnormal haemoglobin patterns observed in the pilot screening study of newborns
Interpretation of the HPLC pattern
The Vnbs classifies 14 retention time windows. HbBart's, the γ
4
tetramer formed in α-thalassaemia, elutes in the ‘FAST’ window, at the beginning of the run as a tall and narrow peak (peak height/total area ≥0.0600) (see Figure 1a). Total fetal haemoglobin (HbF) consists of the acetylated HbF in window ‘Fl’ and the HbF peak in window ‘F’. The peak in window ‘1’ represents degradation products of HbA, which itself elutes in window ‘A’. HbA2 and HbE elute in the same window, but because HbA2 is below the detection level in neonates, a peak in this window is putatively identified as HbE.
HPLC-chromatograms with Vnbs. Chromatograms show the intensity of the peak (Volts) and the pump pressure plotted against the runtime: (a) ‘normal’ newborn with the windows that are used for the recognition of the peaks; (b) -α3.7 deletion in umbilical cord blood; (c) a premature born baby; (d) β-thalassaemia; (e) homozygous HbS or compound HbS/β-thalassaemia; (f) compound heterozygous HbS/HbC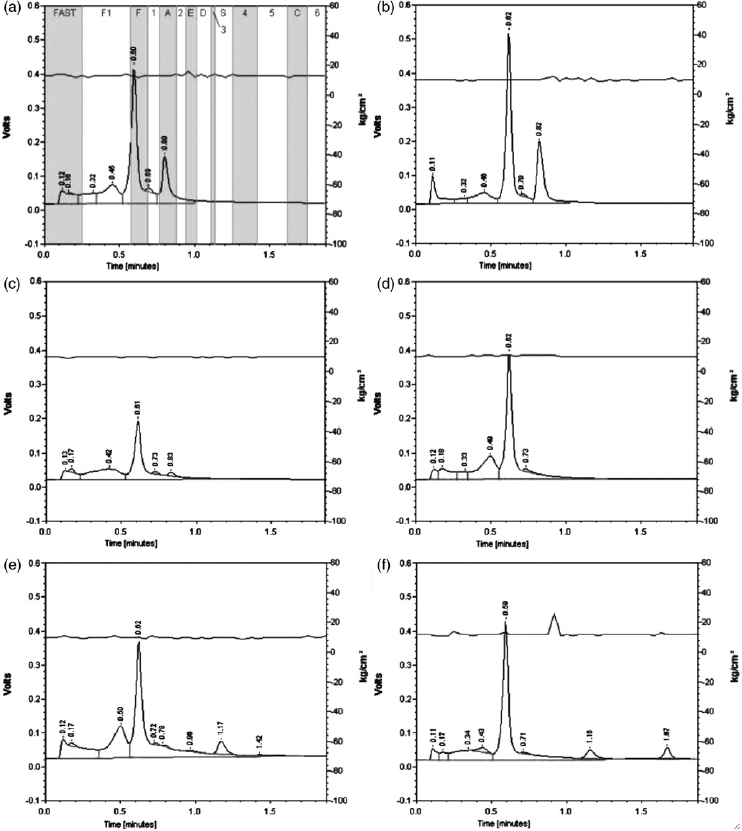
The peak percentage is calculated by dividing the peak area by the total area of all peaks. The results are expressed as a haemoglobin ‘pattern’, for example, FA (normal). The order of the characters in the pattern is dictated by the peak surface of the haemoglobin in the pattern with the major fraction first. This means that a newborn with a sickle cell trait is expected to have a pattern of ‘FAS’.
The G7 and Ultra 2 analysers use the same principle of interpretation of the chromatograms. Small differences in time frames and nomenclature of the peaks are found. Relative retention times, alongside absolute retention times, are only used by the Ultra 2 . A FASC calibrator is regularly used during the run, to recalibrate the retention times of the FASC peaks. The retention times of all other peaks are counted relative to the closest of the FASC peaks.
Results
Validation Bio-Rad Vnbs
A total of 131 samples were analysed during the validation at the Haemoglobinopathies Laboratory at Leiden University Medical Center. This resulted in 4 sickle cell traits among the neonate samples obtained from the Zaans Medical Center, which were confirmed with a classic sickle cell test. 20 One sample showed HbBart's (FAST peak = 8.9%) and DNA analysis confirmed a -α3.7 deletion on one of the α-genes (see Figure 1b).
The samples from premature babies showed a normal FA pattern but, as expected, a decreased level of adult haemoglobin compared with neonates born at term (HbA; mean = 3.1%) (see Figure 1c).
Furthermore, five samples with HbS, three with HbC, two with HbD-Los Angeles and one with HbE were diagnosed and confirmed at the molecular level. Four samples with HbJ gave a peak in window ‘1’. One sample had, apart from the HbF peak, only a peak in window ‘2’. This was diagnosed as HbD-Iran.
For 72 whole blood samples, both a fresh lysate as well as a sample extracted from DBS were analysed on the Vnbs. Comparison of these results showed no major reduction in sensitivity and no discrepancy at the putative diagnostic level. The extracts from the DBS showed degradation of haemoglobins, resulting in a slightly higher baseline. This caused elevated percentages of the ‘FAST’, ‘F1’ and ‘1’ peak, influencing the calculation of the percentages HbA and variants. However, the ratio HbA:variant in the DBS extraction remained the same as in fresh lysate.
Comparison of HPLC systems
We compared the performance of the Vnbs with two alternative HPLC systems: the G7 (Tosoh BioScience) and the Ultra
2
(Primus Corporation). The characteristics of the three devices are shown in Figure 2a. A difference was observed in the runtime per sample, which is important in high throughput screening. Most CVs, of both the mean peak value and retention times, were lower than 10%. The Vnbs showed somewhat higher CVs than the G7 and the Ultra
2
(Figure 2b-e).
Technical details of compared HPLC systems. (a) Characteristics of the three evaluated HPLC analyzers. (b) Within run coefficients of variation (N = 20) for the different peak areas. (c) Within run coefficients of variation for the retention times. (d) Between run coefficients of variation (N = 20) for the different peak areas. (e) Between run coefficients of variation for the retention times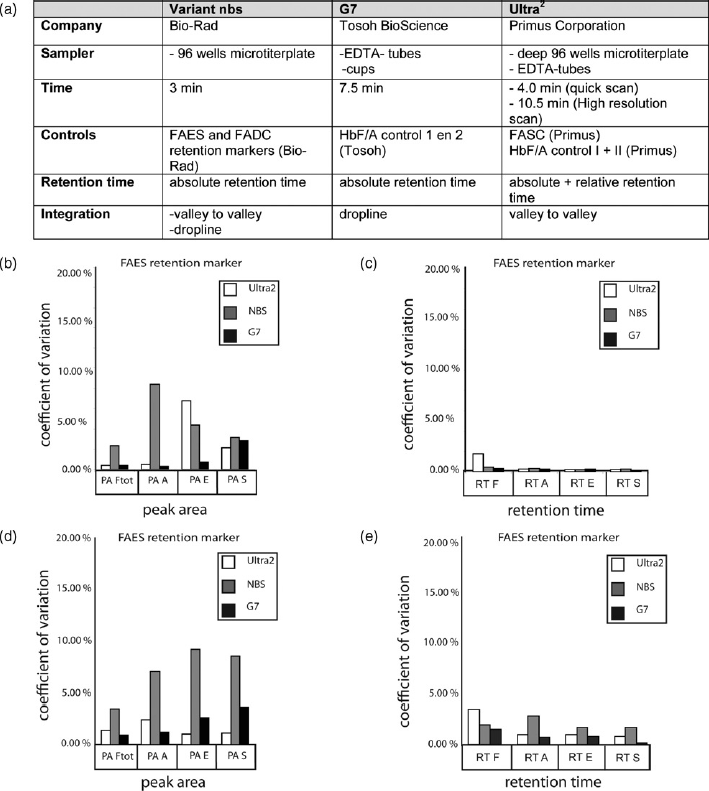
Pilot screening
Between March and June 2006, the YSL and RIVM laboratories screened 21,969 DBS taken from the national screening programme. YSL started analysing all DBS on the three HPLC analysers. However, due to the limited capacity of the G7, only the abnormal chromatograms, flagged by one of the other two devices, were analysed on this device. Abnormal chromatograms were exchanged between the two laboratories. All three HPLC devices detected the same samples as abnormal patterns.
An abnormal haemoglobin pattern was found in 188 samples (0.86%). The patterns indicated two βTM patients (see Figure 1d) and three SCD (see Figure 1e and f). The patterns of 83 DBS (0.38%) indicated sickle cell trait (pattern FAS), while 72 patterns (0.33%) indicated heterozygosity for another haemoglobin variant. The results are summarized in Table 1. No HbO-Arab was seen during the validation period and the pilot screening, but this variant should show in window ‘5’ (Ms Joan Henthorn, personal communication).
In an attempt to determine normal values for HbA and total HbF, the peak percentages of samples with a normal FA or AF pattern (n = 3115) were plotted against post-conceptional age. These samples were all taken 4-7 days after birth. The data generated with the Ultra 2 showed a correct Gaussian distribution for the HbA and HbF. The G7 had problems separating the early peaks that resulted in a binary distribution for the acetylated HbF.
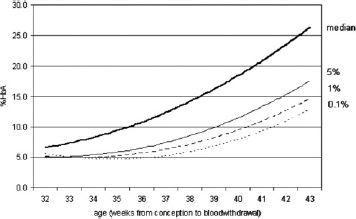
Figure 3a and c show the results of the Vnbs. A bi-phasic distribution for both HbA and HbF due to a non-specific integration of the peaks was detected. It appeared that the software used both ‘dropline’ and ‘valley-to-valley’ integration. With ‘dropline’ integration the base is set on zero and lines drop from the valleys of the peak to the baseline. Valley-to-valley integration means that the baseline is drawn between the valleys of a peak. For both methods of integration, the area above the baseline is used to calculate the peak percentage. The problem was that both methods of integration were used alternately. At our request Bio-Rad adjusted the software so that it had a constant valley-to-valley integration. After recalculation of the values with the adapted software, the bi-phasic distribution of HbF and HbA disappeared (see Figure 3b and d) and 99.0% of the samples had an HbA above 6.2%, with an average of ≈19.5%, which is the expected percentage in blood samples of healthy neonates. The median HbA for each week of age (gestational and postpartum age) and the polynomial trendline for these data are shown in Figure 4. Also presented in Figure 4 are the 5, 1 and 0.1 percentile, showing that 99% of the newborns of 36 weeks gestational age will have an HbA above ≈6%, while at 40 weeks 99% will have an HbA above ≈9%.
Percentages HbF and HbA in normal neonatal DBS on Vnbs. (a) percentage HbF and HbA, according to the original integration software, plotted against age of the newborn from conception. (b) recalculated results with the adjusted software. (c) distribution of the HbF values with the original software. (d) distribution of the HbF values with the adapted software, showing that the bi-phasic distribution became normal Reference values for HbA (N = 3115) in relation to gestational age with the adapted software. This figure shows polynomial trendline for the median, 5, 1 and 0.1 percentile for the percentage HbA for the selection of normal DBS samples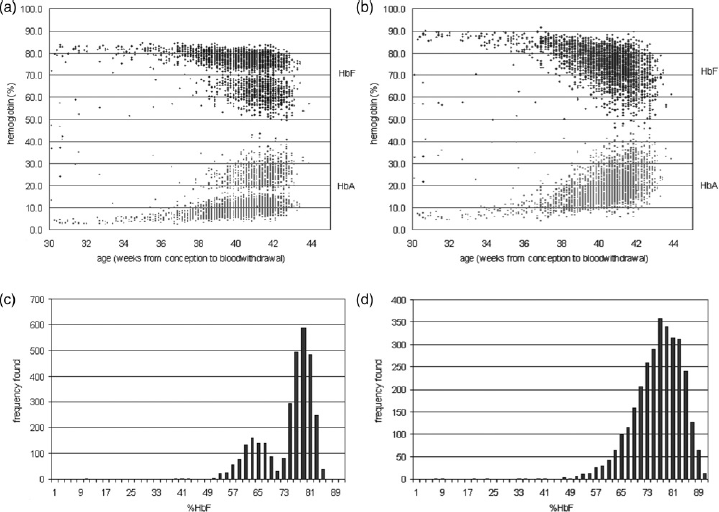
Discussion and Conclusions
Validation Bio-Rad Vnbs
Out of the 131 samples from the validation study, 22 patterns were found that were not FA or AF. The underlying mutations were all confirmed by either a traditional sickle cell test or by DNA analysis. All relevant and frequently found haemoglobin variants in the Netherlands (HbS, HbC, HbD-Los Angeles and HbE) were reliably detected by the Vnbs. βTM and intermedia was easily detectable by the absence or the very low level of HbA. 21 Due to the presence of HbBart's in newborn carriers of α thalassaemia, HbH disease and other α-thalassaemia forms can be detected at birth.
Sensitivity and specificity
The sensitivity of the system can be considered 100% for all frequent mutations and for all other variants with an iso-electric point different from HbA and HbF. We assume the specificity for HbS, HbC, HbE and possibly HbD-Los Angeles to be very high due to the high frequency of these defects in the Dutch population. However, confirmation is essential. As opposed to other countries that screen for haemoglobinopathies, no confirmatory screening test is done in the Netherlands after the HPLC. Confirmation of the screening result is done during the diagnostic phase by the general practitioner (carriers) or paediatrician (affected children) by a second HPLC and in some cases by DNA analysis.
Comparison of HPLC systems
In the Dutch neonatal screening setting, an average of 100-200 samples need to be analysed each day by each of the five screening laboratories. Therefore, the fast, simple and inexpensive technology and the high sensitivity provided by HPLC technology would seem to make it the obvious choice for haemoglobinopathy screening. 22 25
The TOSOH G7 was already in use at YSL for regular haemoglobinopathy analysis and the company was interested in testing the performance of their device on neonatal DBSs. Nevertheless, it was known that the sample tray of this system is not suitable for high throughput analysis. The Ultra 2 is used for newborn screening at the St. James's Hospital in Leeds, UK (Ms Lisa Farrar, personal communication) but is used as a confirmative method after Iso-electrofocusing. The Vnbs has been developed for neonatal screening and is used for this purpose at Birmingham Children's Hospital (UK), at New York State Department of Health, at the Florida Department of Health (USA) and at other locations.
Choice of HPLC system
All three analysers were able to detect the normal and the relevant abnormal haemoglobin patterns. The analytical performance of the G7 during this pilot study was good, but the analysis time was long and the sample tray inadequate. Therefore, the G7 was considered less suitable for high throughput neonatal screening.
The Vnbs is already in use for neonatal screening, and technical details have been defined for this use in the USA. The Vnbs, however, gave the highest inter-assay and intra-assay coefficients of variation of all three systems.
Analytical performance of the Ultra 2 was satisfactory but all chromatograms had to be printed, which is inconvenient for high throughput analysis.
Ultimately, our results indicated that both Primus Ultra 2 and the Bio-Rad Vnbs were possible candidates for use in the Dutch neonatal screening programme although both systems needed some adaptation. Finally, the experience with neonatal screening, the costs and the time needed to adapt the systems were the most important arguments for choosing the Bio-Rad Vnbs for the Dutch neonatal screening programme.
Integration
As expected a relation between gestational age and HbA was found, but the bi-phasic distribution of HbF and HbA levels was remarkable (see Figure 3). In the design of the original Vnbs system, the correct integration of the peaks was considered not essential for neonatal screening for SCD and the software randomly used two different integration methods. We have demonstrated that the results of a sample analysed with random integration was too imprecise when screening for possible HbH disease or β-thalassaemia minor-both depending on a correct evaluation of the FAST (Hb Bart's) and the HbA fractions. At our request, Bio-Rad has changed the software to allow for a standard valley-to-valley integration.
Prediction
Based on the results of the pilot screening, 0.63% of all newborns in the Netherlands will be a carrier of one of the most prevalent haemoglobin variants (HbS, HbC, HbD-Los Angeles or HbE) associated with severe diseases. This means that approximately 1200 carriers of these haemoglobinopathies will be born each year, of which over 700 will have sickle cell trait. Furthermore, 40 to 50 newborns will be born affected with either SCD or βTM.
Neonatal screening
An HPLC-system such as the tested Vnbs offers a high standard with a high throughput. The suggested software adjustments have enabled the method to be more precise and more valuable for a better neonatal screening of haemoglobinopathies.
The Bio-Rad Vnbs has been used since 2007 to report newborns suspected of SCD, beta°-thalassaemia and HbH disease (‘FAST’ ≥20%). The cut-off for HbH disease was based on the literature and the results from these studies. 26
The first year of nationwide screening (2007) of 182,302 samples resulted in the referral of 806 possible carriers of HbS, 41 children with a form of SCD, 4 βTM patients, 18 α-thalassaemias and one child homozygote for HbE. 27 Furthermore, the screening revealed 280 possible HbC carriers, 221 HbE carriers and 76 HbD-Los Angeles carriers, which have not been reported. These figures are in agreement with the estimations made by Giordano et al. 13 and with the results from the pilot screening reported in this paper.
The adapted valley-to-valley integration showed satisfying results for the neonatal screening programme in the Netherlands. Due to the good results, Bio-Rad will include the adapted integration as standard on all Bio-Rad Vnbs systems in new software versions.
Footnotes
Acknowledgements
We are grateful to Dr Peter Schielen (RIVM) for constructive discussions. We are also grateful to the department of Gynecology and Obstetrics of the Zaans Medical Center in Zaandam and to Sanquin Blood Bank, Leiden, for providing us with the cord blood samples.
This study was partially supported by Zon-MW project nr. 21000105 and by Bio-Rad (Bio-Rad Laboratories, Hercules, CA, USA), TOSOH (Tosoh BioScience) and Primus (Primus Corporation) who provided the HPLC devices for the duration of the project.
Drs Bouva and Mohrmann contributed equally to this article.