
Abstract
Objective
To estimate provincial, regional and national newborn screening coverage throughout China.
Method
Information about newborn screening was collected using a survey questionnaire from neonatal screening laboratories in China in 2006–2007. The total number of live births at the provincial and national levels was obtained from the Maternal and Child Health Information System (MCHIS) and the State Statistics Bureau (SSB), respectively, and was used to calculate the neonatal screening coverage at the provincial, regional and national levels.
Results
There were 185 laboratories providing neonatal screening services in China in 2007. The rates of national screening coverage in 2006 and 2007 were 31.27% and 39.96%, respectively, based on live birth numbers reported by the SSB. Both of these estimates are lower than those calculated from live birth numbers reported by the MCHIS. The rates of coverage in the Eastern, Middle and Western regions were about 84.90%, 30.41% and 19.82%, respectively, based on the live birth numbers reported by the MCHIS.
Conclusion
There are disparities in screening coverage between regions and between provinces throughout China, but the extent of this is difficult to ascertain because of the different systems of reporting live births. To calculate nationwide screening coverage it is probably appropriate to use the SSB data on live births. However, for provincial screening coverage the calculation is probably best based on the number of live births reported by the MCHIS once the validity of the MCHIS data is verified.
Introduction
The pilot study for the newborn screening programme in China started in the early 1980s, and has since been extended to almost all provinces; 4 however, a national birth registration system has not been established and information on screening coverage at the provincial and national levels in China is very limited. Therefore, we conducted a survey of the current status of the newborn screening programme throughout China in order to gain a more accurate estimate of coverage, and to identify the regions in which screening coverage needs to be improved. Estimates of the provincial, regional and national screening coverage were calculated using two different information systems, and these estimates were compared to determine the most suitable live birth number to use in making screening coverage calculations.
Methods
This survey was conducted in all laboratories providing newborn screening in 31 Chinese provinces, including district and provincial laboratories. Questionnaires were validated through a pilot study in two provinces before the nationwide survey. The survey asked for information about the number of newborns screened, diseases for which screening was carried out, laboratory human resources, quality control measures and laboratory management in 2006 and 2007. The questionnaires were submitted by individual laboratories to the provincial laboratory, where the data were checked, reconfirmed and reported. The data were then processed and analysed by the National Center for Birth Defects Monitoring of China. A random sample of 10% of laboratories was taken to verify data accuracy. Maternal and Child Health data were taken from the 2007 and 2008 Chinese health statistics yearbooks.5, 6
There are two sources in China for provincial and national live birth numbers. The Maternal and Child Health Information System (MCHIS) collects live birth data by village from the health-care worker who reports these data to township hospital, and then to the county hospital. A total number of live births from all counties and cities in a province is collected by the provincial hospital annually. The data include both hospital and home births.
The other resource is the State Statistics Bureau (SSB), which publishes provincial birth rate and population data in an official annual report. These data in SSB annual reports are estimated from the national annual sampling survey of population changes.7, 8 The 2007 National Sample Survey on Population Change adopted a stratified multi-stage systematic cluster sampling scheme, taking the whole nation as the population and each province as sub-populations. A total of 1.19 million people were selected from 11,789 survey sites at 3430 townships (towns) in 1894 counties (cities) of the 31 provinces. The size of the sample was thus 0.900 per thousand of the national population. The birth rate is then calculated by a weighted estimation procedure. Provincial population data mainly include the total number of live births in resident populations and in migrating populations that live outside the province. There are no data about live birth numbers in the SSB reports, so the provincial and national live births numbers are calculated from the population and annual birth rate reported by SSB.
Both sources of live birth numbers were used to calculate the screening coverage at the provincial and national levels so that the influence of different sources of live birth numbers on estimates of screening coverage could be evaluated.
China is usually divided into three regions: the Eastern region (9 provinces), the Middle region (10 provinces) and the Western region (12 provinces).
All data collected in the study were entered into an EpiData database and analysed by SPSS 15.0. A chi-square test was used to analyse the differences in coverage among these three regions.
Results
Number of screening laboratories and diseases screened
All provinces in China, except Tibet, had developed a newborn screening programme for PKU and CH by 2007. The survey revealed that a total of 185 screening laboratories were offering a newborn screening service. The number of neonates screened for PKU and CH was 4,969,479 in 2006 and 6,389,189 in 2007. Of the 185 laboratories, 35 (18.9%) also provided screening services for Glucose-6-phosphate dehydrogenase deficiency (G6PD deficiency), nine (4.9%) laboratories for congenital adrenal hyperplasia (CAH), two (1.1%) laboratories for thalassaemia and one (0.5%) laboratory for galactosaemia (Gal).
Provincial screening coverage
Screening coverage was calculated as the ratio of the number of infants screened to the number of live births, expressed as a percentage. As shown in Table 1, provincial coverage was calculated using live birth numbers from the two different information systems. There was considerable diversity in newborn screening coverage among provinces in 2006 and 2007. Screening coverage was more than 90% in some provinces and less than 5% in others.
Provincial screening coverage for 2006 and 2007 calculated using two different sources of live birth numbers
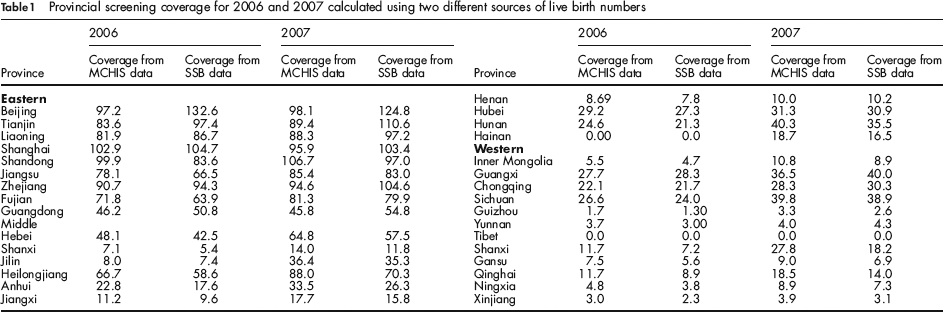
In seven provinces newborn screening coverage calculated using live birth numbers from MCHIS data was lower than that determined using data from the SSB in 2006. This occurred in a further four provinces in 2007. The number of live births obtained from the MCHIS data was higher than that obtained from the SSB data.
Regional and national screening coverage
As shown in Table 2, in the national data and the data by region, the total number of live births over the two-year period reported by the MCHIS was lower than that reported by the SSB system. The national birth rates for 2006 and 2007 calculated using the estimated total number of live births reported by the MCHIS were 9.56 per 1000 and 10.33 per 1000, respectively, whereas the national birth rates calculated using the estimated total number of live births reported by the SSB were 12.09 per 1000 and 12.10 per 1000 in 2006 and 2007, respectively. The national screening coverage calculated using live births data from MCHIS was 39.07% in 2006 and 46.66% in 2007, and the national coverage calculated using SSB live birth data was 31.27% in 2006 and 39.96% in 2007. The screening coverage for 2007 increased by 17.98% and 27.79%, according to the MCHIS and SBB data, respectively, over the screening coverage for 2006.
Regional and national screening coverage for 2006 and 2007 calculated using two different sources of live birth records
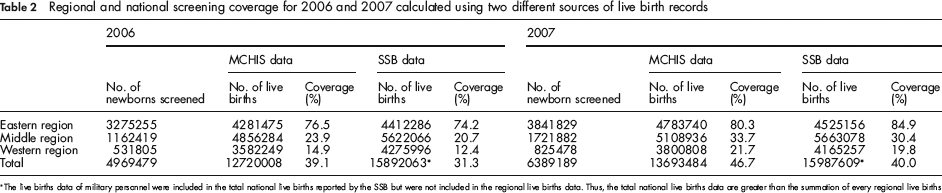
The live births data of military personnel were included in the total national live births reported by the SSB but were not included in the regional live births data. Thus, the total national live births data are greater than the summation of every regional live births
In 2007, of the three regions in China, the eastern region had the highest screening coverage, achieving more than 80% coverage regardless of the source of live birth data used. In the middle and western regions, coverage was more than 30% and approximately 20%, respectively. These differences in coverage among the three regions are statistically significant (χ2 = 3,869,858 by MCHIS data in 2006, 4,464,561 by SSB data in 2006, 3,471,042 by MCHIS data in 2007 and 4,473,067 by SSB data in 2007, all P < 0.01), indicating an obvious geographical diversity. Of the three regions, the increase in screening coverage from 2006 to 2007 was most dramatic in the western region, where it exceeded 45%.
Discussion
National newborn screening technique guidelines were issued by the Ministry of Health (MOH) of China in 2004, prompting most of the provincial health departments to speed up the development of the programme. Screening coverage is one of the vital indicators used to evaluate newborn screening programmes, and it is important for determining future public health decisions on such programmes. This is especially the case in developing countries with large populations, undeveloped economies and unequal regional development.
This study shows that all 30 provinces in China, except Tibet, have developed a newborn screening programme. The MOH-recommended panel of diseases for which screening should be performed includes PKU and CH, as first priorities. Information about other diseases included in screening programmes is limited. Although some, such as G6PD, CAH and Gal, are screened for at some laboratories in a few large cities, there remains a remarkable difference in newborn screening in China compared with some developed countries, where more than six diseases are normally included in newborn screening programmes.9–12 From this survey, the number of neonates screened for PKU and CH was 4,969,479 in 2006, and 6,389,189 in 2007. These figures are higher than those reported by Zhan in 2009. 13
The national birth rate from the SSB data is 12.10 per 1000 population. This may be a more accurate reflection than the 10.33 per 1000 population from the MCHIS data. Thus, the estimates of national newborn screening coverage calculated using live birth numbers from the SSB data, which were 31.27% and 39.96% in 2006 and 2007, respectively, are probably close to the actual coverage. Notably, these estimates are higher than the 25% coverage estimate for 2006 reported by Padilla and Therrell. 10 Although the national coverage increased by 27.79% over 2006, there remains a vast gap between newborn screening coverage in China and that in developed countries, suggesting that continuing to increase coverage will remain a priority for the programme in China for several years.
This study demonstrates that in 2007, the screening coverage exceeded 80% in the developed eastern region, more than 30% in the middle region and about 20% in the western region, regardless of the source of live birth data, suggesting that there is a large geographic diversity of newborn screening coverage among different regions. These nine coastal provinces in the eastern region have become more economically developed during the last 30 years, and in these areas provincial coverage exceeded 90%. This is similar to the coverage obtained in some developed countries. By contrast, the 12 western provinces have many mountainous areas, communication difficulties, lower socioeconomic levels and a much higher proportion of impoverished people. Newborn screening in China is currently fully paid for by individuals (about $7.5 per screening for PKU and CH). In these western areas public funding from the government is lacking and there is limited administrative capacity. Newborn screening is not offered to all newborns in these areas, and coverage here was less than 10%. Another important challenge to the development of the newborn screening programme in the western region is that the hospital delivery rate, although increasing, is still relatively low and negatively influences newborn screening coverage. The hospital delivery rates in the eastern, middle and western regions were 98.12%, 91.43% and 75.24% in 2006, and 98.45%, 94.92% and 81.01% in 2007.5-6
Because of the absence of an effective integrated newborn screening information system in China, the number of newborns screened is mainly derived from specimen records collected from delivery hospitals. Information classifying resident or migrant populations in hospital is usually unavailable. Therefore, the number of newborns screened reported by each laboratory includes both the resident and migrant populations. This was especially prominent in some provinces with the influx of large migrant populations and higher in-hospital birth rates. If a migrant has a baby in another area, this case screened is calculated in the number screened in that new area, but the birth may not have been included in the MCHIS figures for that new area. This may lead to reported coverage exceeding 100% in these eastern developed provinces with large migrant populations.
In seven provinces in 2006 and 11 provinces in 2007, provincial coverage calculated using the MCHIS data was lower than that calculated using the SSB data. Most of these provinces were economically developed, with large migrant populations and high in-hospital birth rates. For example, the ratio of the provincial migrant population to the provincial resident population in these provinces was more than 20%. The live birth numbers for the migrant population would probably be partly included in the data collected by the MCHIS. This finding strongly suggests that the live birth numbers from MCHIS in these provinces is likely to be higher than that from SSB. Provincial coverages calculated using the MCHIS data were much lower than those calculated using the SSB data.
Provincial screening coverage using live birth numbers from the MCHIS should be used with caution, and more emphasis should be put on improving the quality of the data from the MCHIS.
Footnotes
Acknowledgement
This study was supported by a grant from the Ministry of Science and Technology of China (No. 2006BA 105A01).