
Abstract
Objectives
Breast cancer prognosis is better for smaller tumours. Women with high breast density are at higher risk of breast cancer and have larger screen-detected and interval cancers in mammographic screening programmes. We assess which continuous measures of breast density are the strongest predictors of breast tumour size at detection and therefore the best measures to identify women who might benefit from more intensive mammographic screening or alternative screening strategies.
Setting and methods
We compared the association between breast density and tumour size for 1007 screen-detected and 341 interval cancers diagnosed in an Australian mammographic screening programme between 1994 and 1996, for three semi-automated continuous measures of breast density: per cent density, dense area and dense area adjusted for non-dense area.
Results
After adjustment for age, hormone therapy use, family history of breast cancer and mode of detection (screen-detected or interval cancers), all measures of breast density shared a similar positive and significant association with tumour size. For example, tumours increased in size with dense area from an estimated mean 2.2 mm larger in the second quintile (β = 2.2; 95% Cl 0.4–3.9, P < 0.001) to mean 6.6 mm larger in the highest decile of dense area (β = 6.6; 95% Cl 4.4–8.9, P < 0.001), when compared with first quintile of breast density.
Conclusions
Of the breast density measures assessed, either dense area or per cent density are suitable measures for identifying women who might benefit from more intensive mammographic screening or alternative screening strategies.
Introduction
Breast cancer screening programme participants with high mammographic breast density tend to have larger screen-detected and interval cancers (cancers diagnosed following a negative screening result within some period after the screening episode; usually either 12 months or before the next scheduled screen). 5–7 While the rate of small (≤ 15 mm) screen-detected cancers in the Australian mammographic screening programme is not associated with per cent mammographic density, the rates of interval cancers and large (> 15 mm) screen-detected cancers increase incrementally with increasing breast density. 8 Women with high breast density have a lower mammographic screening programme sensitivity9–12 and a three to five fold increased risk of breast cancer.13–15
Screening participants with higher breast density may benefit from more frequent screening or additional screening modalities such as ultrasound or magnetic resonance imaging. 16–18 while visually estimated classifications of breast density such as the Wolfe 19 and BIRADS 20 classifications have shown strong associations with breast cancer risk19,21 and screening programme performance, 10–12,22 the precision of screening allocation based on these measurements is limited by their categorical nature. Instead, screening would best be targeted according to continuous measures of breast density, such as per cent density (the proportion of the breast image that appears dense) or dense area (the absolute area of denser tissue in the mammogram), which can be measured continuously through image-processing of the digitally acquired or scanned film mammogram.
Both per cent density and dense area are associated with breast cancer risk.13,23–24 While studies have shown that increasing per cent density is associated with lower programme sensitivity9–12,22,25 and tumour size at detection 8 we could not find any studies that examined these associations for dense area.
Using screening programme participants as our study group, we assessed the association between breast density and continuously measured tumour size at detection for three continuous measures of breast density: per cent density, dense area and dense area adjusted for non-dense area (which, like per cent density, takes the non-dense area into account, but more directly). We examined whether this association is clearer for one of the measures of breast density and whether the effect is graded with increasing breast density. We also assessed the extent to which differences in tumour size according to breast density are due to the increased likelihood of interval cancers or the detection of cancers at subsequent rounds in women with high breast density.
Materials and Methods
Details of the programme
BreastScreen Victoria is the arm of the Australian national screening programme based in the state of Victoria. It offers free biennial mammographic screening to Victorian women from the age of 40 years and is targeted to women aged 50–69 years through direct mail invitation and media promotion. BreastScreen Victoria commenced in 1992 and over the years 1994–1996 (the period from which our study group was sampled), participation in the target age group averaged 53%. 26 Women are excluded from the screening programme after cancer diagnosis (whether screen or interval detected); otherwise, women can attend for rescreening after 21 months.
Screening tests consist of two-view mammography, using the cranio-caudal and medio-lateral oblique views. Each film is read independently by two radiologists and disagreement regarding recall of women for further assessment is settled either by review and consensus by those two radiologists or, if necessary, by a decision from a third radiologist.
BreastScreen Victoria collects participant information through a self-completed questionnaire returned at each screening appointment. This information includes self-reported breast cancer symptoms, where any breast symptom other than a breast lump and/or blood stained or watery nipple discharge is categorized as ‘other’ symptoms; women with symptoms receive clinical examination if they have not seen a doctor in the 12 months prior to screening. Women also report whether they are currently using hormone therapy, and whether they have a family history of breast cancer.
Subjects
The study population comprised women who had invasive breast cancer detected either at screening by BreastScreen Victoria or during the interval before the next scheduled screen. The study group comprised all women whose cancer was detected either at or following first-round screening in 1994 or 1995 or at or following subsequent round screening in 1995 or 1996.
We excluded women who had reported a personal history of breast cancer at screening or presented at screening with a breast lump and/or blood-stained or watery nipple discharge, because the resulting clinical examination would attenuate the role of breast density in detection through mammographic screening. We restricted our analysis to women who were within the programme target age range of 50–69 years at screening. Ascertainment of interval-detected cancer records by BreastScreen Victoria is almost complete. 27
Outcome variable
Tumour size was measured at histology as the widest point of a cross-section of the largest tumour, to the nearest milli-metre. Where cancers were coded as microinvasive, we assigned a minimal size (0.1 mm) consistent with national protocols. 28
Measurement of mammographic density
Mammographic density was measured for cranio-caudal views of both the ipsilateral cancer-affected breast and the contralateral breast from each subject's screening mammograms immediately preceding cancer detection, using a semi-automated image-processing technique developed in the early 1990s called the threshold technique. 29 Earlier assessment of the inter-rater reliability of the readings for these data estimated that 80% of the variation in per cent density readings was attributable to differences between women, and 11.4% of the variation was attributable to differences between raters. 28 To avoid incorporating the tumour into the breast density measurement we used the reading from the ipsilateral breast where available; otherwise the contralateral reading was used.
While these data are now over 10 years old, no other similar datasets have since been generated in Australia and although there have been some improvements in the quality of mammography in BreastScreen Victoria, such as the introduction of better quality film and more recently the phasing in of digital mammography, the associations observed are unlikely to have changed significantly.
Analysis
The distribution of breast density was very positively skewed for both per cent density and dense area, so in our regression models we fitted breast density as categories using quantiles as category boundaries, set using the whole study group in order to classify the breast density profile of programme participants who were diagnosed with breast cancer, regardless of screening round.
We described the distribution of tumour size according to breast density and mode of detection (screen-detected or interval-detected), categorizing breast density into six groups (the lower four quintile groups and the upper two decile groups, which added information on the effects among women with particularly high breast density). We also assessed tumour size quintiles by breast density quintile and round.
We used multiple linear regression to assess associations between each measure of breast density and tumour size in millimetres (residuals were found to be normal with constant variance). Two exceptionally large tumours (110 and 140 mm, respectively) were assigned as equal to the size of the largest tumour not considered an outlier (85 mm). Separate models were fitted for per cent density, dense area and dense area adjusted for non-dense area.
We modelled tumour size against breast density, adjusted for age by year, hormone therapy use at the time of screening (yes/no) and a strong family history of breast cancer (yes/no, defined as having at least one first-degree relative with breast cancer diagnosed before the age of 50 years). These factors were identified as possible confounders in the association between breast density and tumour size at detection. Since we postulated that both mode of detection (screen-detected or interval) and screening round (first or subsequent) could mediate or explain the association between breast density and tumour size (because women with higher breast density are more likely to have their cancer missed at first-round screening and present with larger cancers in the interval or at subsequent screening rounds), we fitted mode of detection and screening round in separate regression models. Since we hypothesized that the associations between breast density and tumour size might vary by mode of detection and screening round, we also tested for potential interactions between breast density and these factors (mode of detection and screening round) by fitting a numerical interaction term which was the dichotomous mediator variable (i.e. detection mode or screening round) multiplied by the six breast density categories. This approach allowed us to examine the possible effects of screening round and mode of detection without the loss of power that would result from stratifying the analysis by these factors.
For each model, we tested for trends across the breast density coefficients using a non-parametric test for trend (Stata nptrend). We also compared the fit of each nested model using likelihood ratio tests (Stata lrtest). All analyses were conducted using Stata 10. 30
Exclusions
For all data analyses we excluded cases where data were incomplete for the highest order regression conducted in the analysis. This led to the exclusion of 3.2% of first-round screen-detected cancers, 6.4% of first-round interval cancers, 4.1% of subsequent-round screen-detected cancers and 5.0% of subsequent-round interval cancers. Our study, which uses secondary data sources only, was approved by the Human Research Ethics Committee of the Cancer Council Victoria.
Results
Sample
The sample for analysis comprised 712 first-round screen-detected cancers, 220 first-round interval-detected cancers, 295 subsequent round screen-detected cancers and 121 subsequent round interval-detected cancers (Table 1). Correlation between per cent density and dense area decile groups was high (r = 0.91, P < 0.0001).
Tumour size (mm) at detection according to screening round and mode of detection, for per cent density and dense area
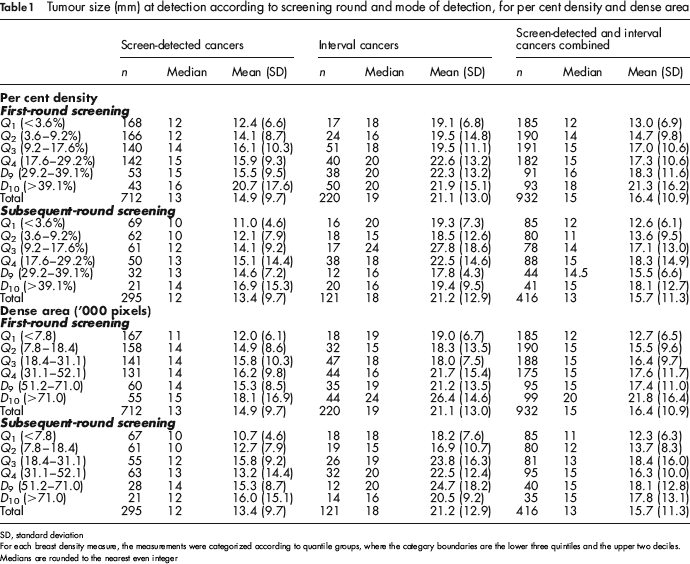
SD, standard deviation
For each breast density measure, the measurements were categorized according to quantile groups, where the category boundaries are the lower three quintiles and the upper two deciles.
Medians are rounded to the nearest even integer
Descriptive analysis
As expected, interval-detected cancers were larger on average than screen-detected cancers at each round (Table 1, t-test P < 0.001 at each round). The size of screen-detected cancers, interval cancers and screen-detected and interval cancers combined generally increased with each breast density category for both per cent density and dense area measures.
Histograms of tumour size quintile groups within breast density quintile groups (Figure 1) demonstrated that both per cent density and dense area were strongly associated with tumour size and detection mode. There was a clear shift in tumour size distribution towards larger cancers and a higher representation of interval cancers with increasing breast density. This shift was similar for both per cent density and dense area. For both measures, the size distribution of tumours detected in women with very low breast density (e.g. Density Ch) was lower than the whole group, as indicated by the skewed histograms. Very small tumours (<9 mm) were over-represented in the first and second breast density quintile groups, and larger tumours (i.e. >15 mm) were over-represented in the highest breast density quintile group. Interval cancers were more common with increasing breast density and were more likely to be large.
For (a) per cent density and (b) dense area, the distribution of tumour size at detection according to breast density. Tumour size and breast density are categorized according to quintiles for the whole study group. Screen-detected and interval-detected cancers (marked as black and white bars) are shown separately but stacked to indicate the size distribution of all cancers detected in each breast density quintile as well as the relative representation of screen-detected and interval cancers in this distribution. The dashed line shows the expected tumour size distribution within each breast density group if the distribution of tumour size did not vary according to breast density. For example, for per cent density, the distribution of tumour size for women in with breast density group Q4 is similar to the whole study group, but breast density group Q1 shows a tendency towards smaller cancers compared with the whole study group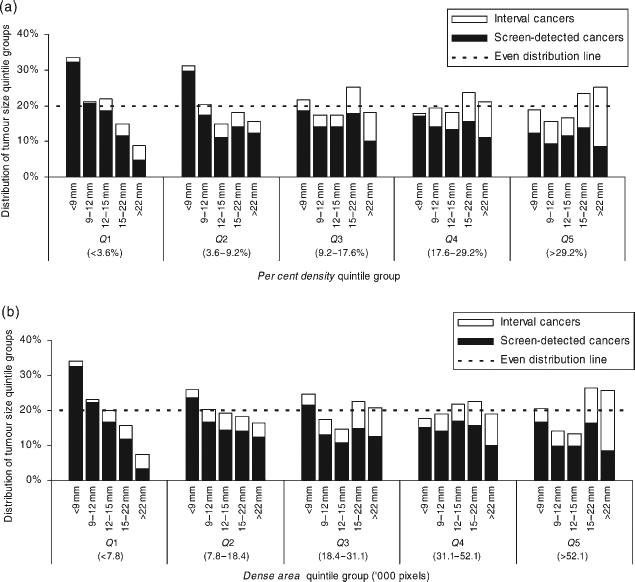
Regression models
After adjustment for age, hormone therapy use and family history, there was a graded association between breast density and tumour size at detection for each breast density measure examined (Table 2). The effect was significant above the third breast density category for per cent density, and for all breast density categories for dense area and dense area adjusted for non-dense area. For all measures, there was a significant, positive trend in the coefficients for each increasing breast density category.
The association between breast density and tumour size at detection (mm), for per cent density, dense area, and dense area adjusted for non-dense area, before and after adjustment for mode of detection (screening or interval)
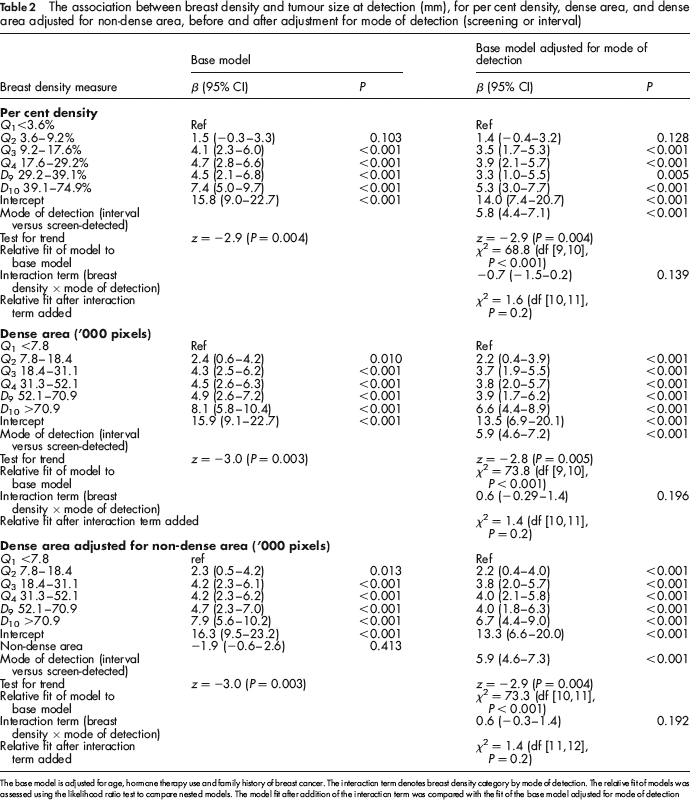
The base model is adjusted forage, hormone therapy use and family history of breast cancer. The interaction term denotes breast density category by mode of detection. The relative fit of models was assessed using the likelihood ratio test to compare nested models. The model fit after addition of the interaction term was compared with the fit of the base model adjusted for mode of detection
Adjustment for mode of detection significantly improved the model fit and attenuated the effect of breast density for all breast density measures slightly (Table 2). Mode of detection was a significant factor and was associated with a mean increase in tumour size that differed little according to the breast density measure used. The interaction term (breast density category by mode of detection) was not significant for any breast density measure.
Screening round (subsequent versus first-round screening) was not significant for any breast density measure (β < 0.6 and P > 0.27 for all breast density measures) and did not improve the fit of the model (P > 0.270 for all measures). The interaction term (breast density by screening round) was not significant for any breast density measure (P > 0.367 for all measures).
For all breast density measures, there was no significant trend with increasing breast density within the middle-range breast density categories (Q3, Q4 and D9, representing 50% of the sample). However, mean tumour size was 3.3–4.9 mm larger for those categories compared with the lowest density category (Q1).
When breast density was fitted as dense area with adjustment for non-dense area, non-dense area was not a significant term.
The exclusion of the 17 microinvasive tumours from our analysis had a negligible effect on our results.
Discussion
The descriptive histograms in Figure 1 highlight that women with high breast density experience a different profile of cancers compared with women with low breast density and that this effect is graded with increasing breast density. The combination of larger cancers and more interval cancers is important because both large tumour size and the presence of clinically detectable symptoms are indicators of poorer prognosis.31,32
Although per cent density is a well-established predictor of breast cancer risk and breast cancer screening performance, we found that dense area was also a strong predictor of tumour size at detection. This makes sense if the association between breast density and breast cancer risk is driven by cell proliferation (mitogenesis) and genetic damage to proliferating cells by mutagens (mutagenesis) evident in denser tissue, 33 because then the absolute volume of dense tissue will be a good indicator of breast cancer risk, and absolute dense volume is well represented by dense area. Additionally, dense area may be more closely aligned than per cent density with the quality of breast compression which is an important contributor to test sensitivity, 34 since a breast will generate similar per cent density values under both light and firm compression (as both dense and non-dense areas are compressed), whereas dense area will increase with increasing compression.
For all breast density measures tested, mode of detection was a significant factor, the effect of breast density on tumour size was only partially attenuated by mode of detection, and the interaction term (mode of detection by breast density) was not significant. This suggests that the association between breast density and tumour size is only partly explained by lower programme sensitivity for women with high breast density, and the form of the association does not vary for screen-detected versus interval cancers. These effects could be explained by more aggressive tumours among women with high breast density. Mean tumour size was smaller at subsequent round screening compared with first-round screening (Table 1), however since our regression models were not altered by either screening round or an interaction term for screening round and breast density, it appears that screening round plays no part in explaining the association between breast density and tumour size.
The flattening of the effect of breast density across the middle categories observed in this study and previous analyses of this dataset 8 has also been noted in studies of the association between breast density and breast cancer risk.23,35 One possible explanation offered by Brisson et al. 27 is that the degree of error in the breast density reading is higher in the middle values.
The breast density measurement technique used in this study was reasonably reliable overall but required substantial training and monitoring of readers to maintain reliability and so would not be suitable for implementing targeted screening strategies. However, in recent years, image processing specialists have developed automated techniques for breast density measurement.36–39 Further investigation and validation of these techniques is required in order to identify tools suitable for routine measurement of breast density by screening programmes.
The standard of breast cancer screening programme performance achieved for women in the lowest breast density quintile in our study may never be achievable for women with higher breast density, particularly since both reduced test sensitivity and more aggressive tumour growth probably contribute to the larger tumour size at detection. However, our goal should be to improve equity in outcomes across the range of breast densities. Digital mammography appears to perform better for women with denser breasts. 40 However, results from the DMIST study comparing film and digital mammography suggest that the graded association between breast density and programme sensitivity will remain since outcomes will also improve for women with low breast density, and the improvement for women aged 50–64 years with high breast density does not equate to current performance of film mammography for women in that age group with low breast density. 40 Alternative screening modalities such as ultrasound or varied screening intervals should continue to be considered for women with high breast density.
Conclusions
This study confirms that breast density is positively and significantly associated with the size of tumours detected among women who participate in screening programmes, after adjustment for age, hormone therapy use, family history of cancer, mode of detection and screening round. Our findings suggest that it is important to be cautious about defining some groups of women as ‘high risk’ in regards to breast density because the effects are graded with increasing breast density. Since dense area and per cent density both showed consistent and strong associations with tumour size at detection, and dense area adjusted for non-dense area offered no improvement over dense area, we recommend that either dense area or per cent density should be the measure used to identify women who might benefit from more intensive mammographic screening or alternative screening strategies.
Footnotes
Acknowledgements
This research was funded by the Victorian Health Promotion Foundation and Department of Human Services Victoria, Australia. CN was supported by a National Breast Cancer Foundation Women in Super Postgraduate Scholarship and National Health and Medical Research Council Project Grant 509357, on which she is a Chief Investigator. We thank Georgina Marr and Kathryn Morris for conducting the breast density measurements and BreastScreen Victoria for providing data and assistance with the project.