
Abstract
Background
Ultrasound-detected carotid artery intima-media thickness (IMT) and carotid plaque are possible screening tests for coronary heart disease (CHD) among asymptomatic individuals.
Objective
To assess the increase in screening performance of combining carotid IMT and plaque compared with each measurement alone in the identification of individuals with CHD.
Methods
Ultrasound examination of left and right carotid arteries was performed on 100 individuals (median age 57), 55 with a history of CHD (unstable angina or myocardial infarction) and 45 without. IMT measurements were taken from the common carotid artery and plaque was identified above, at and below the carotid bifurcation. Associations between IMT and plaque were determined using logistic regression, and screening performance was assessed from the distributions of IMT and plaque among cases and controls.
Results
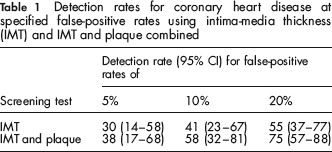
At a false-positive rate of 5%, IMT (cut-off >0.75 mm) identified 30% (95% CI 14–58) of affected individuals. There was an increase in the detection rate of 8 percentage points (1–33%) using IMT and plaque combined compared with IMT alone. As the false-positive increased, the difference in the detection rate increased, up to a maximum of 20 percentage points (5–38%) at a false-positive rate of 20%. The comparison of IMT and plaque combined with plaque alone could only be estimated for the false-positive rate observed using plaque alone (18%); at this point the detection rate was 72% for plaque and 75% for plaque and IMT combined, an increase of 3 percentage points (0–4%).
Conclusion
In screening for CHD, combining carotid IMT measurement with plaque assessment is better than using either measurement alone, but the improvement in discrimination is not sufficient to make carotid ultrasound screening for CHD worthwhile.
Introduction
Carotid IMT is generally reported in millimetres as a continuous variable with values ranging from about 0.5 to 1.0 mm in healthy people. 6 Carotid plaque is any focal thickening of the intima-media layer greater than 1.0 mm and is generally reported as either being present or absent. 7 Observational studies have tended to focus either on carotid IMT or plaque as predictors of CHD, 3 and have not examined the interaction between the two measurements to determine whether the combination is better than either alone in screening. The extent to which the two are associated and the effect this has on screening performance (detection rate for a given false-positive rate) when used together is uncertain.
This prompted us to carry out a case-control study to provide individual participant data to quantify the screening performance separately for carotid IMT and plaque, and then, using methods previously applied to combining continuous and categorical variables in antenatal screening, 8 to estimate the increase in screening performance of combining information on carotid IMT with that on plaque.
Methods
Carotid artery ultrasound was undertaken in 100 consecutive men and women aged 40–70 years at Southampton University Hospital, UK. The 55 cases were patients with an acute myocardial infarction (41 had cardiac chest pain associated with a raised troponin I level) or unstable angina (14 had cardiac chest pain with electrocardiographic evidence of ischaemia). All had undergone coronary angiography confirming significant coronary artery disease (a stenosis ≥50% in one or more coronary artery). The control group comprised 45 unaffected men and women with no history of myocardial infarction, angina, stroke, peripheral vascular disease or diabetes who volunteered to participate after reading advertisements posted on notice-boards in the hospital. Ethical approval was obtained from the local research ethics committee and all participants gave written consent before participating.
The carotid arteries were studied with a duplex scanner using a 7.5 MHz linear array transducer (Philips IE33 4–8 MHz). The pre-set ultrasound parameters (dynamic range, depth range, power output and greyscale) for B-Mode carotid imaging were used during initial image acquisition and were then modified to optimize image quality.
All scans were carried out by one vascular technician (LD) and each scan took approximately 15 minutes to perform. Participants lay supine with the neck slightly rotated to expose an area from the clavicle to the angle of the jaw. After localizing the carotid bifurcation by a transverse scan, the ultrasound transducer was rotated 90° to record longitudinal images of the anterior and posterior walls of the common, internal and external carotid artery and the carotid bifurcation. The carotid artery was examined over a length of 3 cm (1.5 cm proximal and distal to the carotid bifurcation), identifying three ultrasonic layers (intima-media, adventitia and peri-adventitia). Multiple 5–10 seconds digital cine loops of the carotid artery were recorded and labelled with the date of the recording and coded with a randomly assigned unique identifier number (1–100).
All recorded images were read at completion of the study by a vascular technician (PK) blinded to the clinical history. IMT of the far wall of the common carotid artery was measured from the leading edge of the lumen-intima interface and the leading edge of the media-adventitia interface (Figure 1). For each subject, the IMT was calculated as the average of three measurements from each of the left and right common carotid arteries at the end of diastole, approximately 1.5 cm proximal to the carotid bifurcation, in a manner previously described.
6
Plaque was defined as a localized thickening greater than 1 mm (with or without flow disturbance) in the common, internal, external carotid arteries or at the carotid bifurcation, as has been previously described.
7
Photograph of carotid artery illustrating carotid bifurcation and common carotid artery. The intima-media thickness (IMT) of the far wall of the common carotid artery is marked and represents the distance from the leading edge of the lumen-intima interface and the leading edge of the media-adventitia interface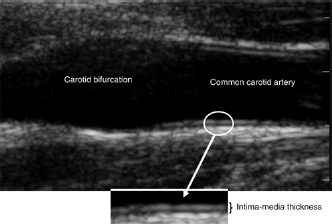
Statistical Analysis
Probability plots (IMT plotted against its corresponding centile value) were used to assess the fit of the data to a Gaussian distribution in affected and unaffected individuals. Plots of log IMT were reasonably linear (Figure 2) indicating acceptable fit to a log-Gaussian distribution. Detection rates (the proportion of affected individuals with positive results) were calculated for a range of false-positive rates (the proportion of unaffected individuals with positive results) from the Gaussian distributions of log IMT in affected and unaffected individuals to give a measure of screening performance. The distributions were described using the means of the log IMT values and standard deviations (SD) were estimated from the regression slope of the probability plot using values from the 10th to 90th centiles of log IMT to avoid the undue influence of outliers. Median IMT values were taken as the antilog of the mean of the log IMT values. Gender-specific differences in log IMT were examined using the unpaired t-test.
Probability plot of log IMT (mm) against its corresponding centile value for 55 CHD-affected and 45 unaffected individuals in the study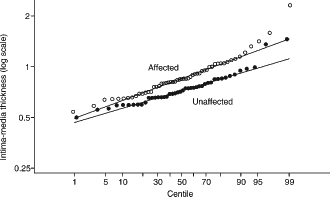
For plaque, the detection rate was taken as the proportion of affected individuals with plaque and the false-positive rate as the proportion of unaffected individuals with plaque. Gender-specific differences in plaque were examined using the chi-squared test. Logistic regression was used to examine the association of IMT with the prevalence of plaques in affected and unaffected individuals. To estimate the screening performance of IMT and plaque combined, Monte Carlo simulation was used. A large hypothetical dataset of affected and unaffected individuals was generated with IMT values based on the observed distributions. For each affected and unaffected individual, a likelihood ratio was calculated from the Gaussian distributions and the detection rate calculated by counting the proportion of affected individuals with a likelihood ratio above that which corresponded to a specified false-positive rate in unaffected individuals. The logistic regression equations describing the association between IMT and plaque were then used to assign each simulated affected and unaffected individual to having or not having plaque and to calculate likelihood ratios with and without plaque. This likelihood ratio was multiplied by the IMT likelihood ratio and detection rates calculated for a range of false-positive rates. This is described in more detail in the Statistical Appendix.
Results
The median age of participants was 57 (59 in cases and 55 in controls) and 75% were men. Figure 3 shows a histo-plot of the individual IMT measurements among the 55 CHD affected (median 0.85 mm (interquartile range [IQR] 0.70–1.03)) and 45 unaffected (median 0.7 mm [IQR 0.65–0.84]) individuals and shows the overlapping affected and unaffected distributions of log IMT. At a false-positive rate of 5% (the dark shaded area) the detection rate (light shaded area) was 30%. Carotid plaque was detected in 40 (72%) CHD affected individuals and eight (18%) unaffected. Neither IMT nor plaque were statistically significantly different between male and female individuals (P = 0.89 and P = 0.07 for IMT and plaque, respectively).
Histo-plot of carotid artery intima-media thickness (IMT) measurements in 55 CHD-affected individuals and 45 unaffected individuals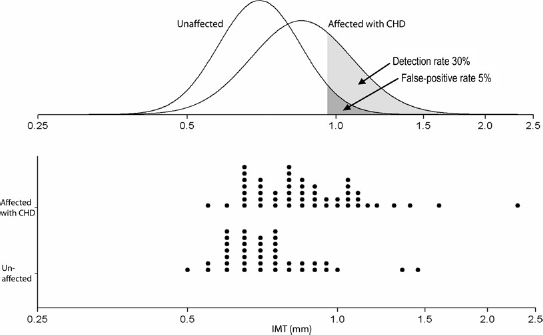
There was an effect of age on IMT and plaque among affected individuals; IMT increased by about 1.1% and plaque by about 2% points for each additional year of age (P = 0.01 for both). Allowing for the four year age difference between cases and controls reduced the screening performance, from 30% to 28% for IMT at an FPR of 5% and from 72% to 68% for plaque at the observed FPR of 18%.
There were statistically significant associations between the presence of plaque and IMT (mm); an approximate doubling in the odds of carotid plaque in affected individuals (P = 0.008) and unaffected individuals (P = 0.019) for a 0.1 mm increase in IMT. Figure 4 shows the detection rate plotted against the false-positive rate for IMT and for IMT and plaque combined. Table 1 gives the detection rates (and 95% CI) for a range of false-positive rates that might be judged acceptable in population screening. The detection rate for IMT and plaque combined was statistically significantly greater (P < 0.01) than for IMT alone; percentage point increases of 8% (1–33%), 17% (3–43%) and 20% (5–38%) for false-positive rates of 5%, 10% and 20%, respectively. Estimation of the effect of IMT and plaque combined compared with plaque alone was only possible for the false-positive rate observed for plaque alone (18%), since plaque is a qualitative variable (it is either present or absent). At this point (marked on Figure 3) the screening performance using the combination of IMT and plaque was greater than using plaque alone; percentage point increase in detection rate of 3% (0–4%), from 72% to 75%.
Detection rate plotted against false-positive rate for (i) intima-media thickness (IMT), (ii) plaque and (iii) IMT and plaque combined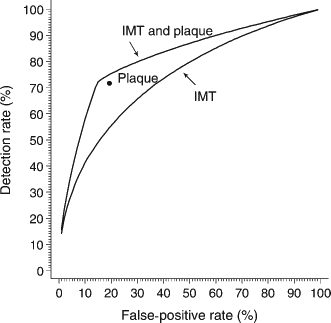
Detection rates for coronary heart disease at specified false-positive rates using intima-media thickness (IMT) and IMT and plaque combined
Discussion
Our results show that combining information on carotid plaque with IMT is more discriminatory than using either alone as screening tests for CHD. At a false-positive rate of 5%, IMT alone (cut-off >0.75 mm) identified about 30% of affected individuals compared with 38% when information on the presence or absence of plaque was combined with IMT. As the false-positive rate increased, the increase in detection rate increased, being about 20 percentage points higher using the combination compared with IMT alone at a 20% false-positive rate.
Our results are consistent with a previous case-control study of IMT and plaque on CHD, in showing an increasing prevalence of plaque and IMT with age. 8 The effect of the four-year age difference between affected and unaffected individuals in our study was however minor (reducing screening performance for IMT from 30% to 28% at a false-positive rate of 5%, and for plaque from 72% to 68% at the observed false-positive rate of 18%), and would not have altered our results on the combination of IMT and plaque over one alone.
This is the first study to describe, in terms of detection rates for a range of false-positive rates, the increase in screening performance of carotid IMT and plaque combined over one alone. The analysis required a method to combine information from a continuous variable (IMT) with a categorical one (plaque). We used a method (described in the Appendix) previously used to combine continuous and categorical variables for Down's syndrome screening (the presence of tricuspid regurgitation [categorical] with nuchal translucency [continuous]) 9 and applied this to measurements relevant to cardiovascular disease screening.
Our estimates of screening performance are based on a relatively small number of subjects, and so the confidence intervals about these estimates are necessarily wide. For example, the detection rate for IMT may be as low as 15% or as high as 58% for a 5% false-positive rate. It is therefore not possible to conclude whether carotid ultrasound is or is not a worthwhile screening test for CHD based on these results alone. An accompanying meta-analysis of published reports on the association of IMT or plaque and CHD 10 addresses the issue of precision relating to these estimates, but without individual data, cannot be used to examine the interaction of IMT and plaque on screening performance and the extent to which both measurements are better than one alone. The value of this study is to quantify the performance of IMT and plaque combined over IMT alone over a range of false-positive rates.
In screening for CHD, combining carotid IMT measurement with plaque assessment is better than using either measurement alone, but the improvement in discrimination is not sufficient to make carotid ultrasound screening for CHD worthwhile.
Footnotes
Statistical Appendix
To estimate the screening performance (DR for a specified FPR) of IMT, Monte Carlo methods were used to simulate an IMT measurement for 100,000 hypothetical CHD affected individuals and 100,000 hypothetical unaffected individuals from the respective Gaussian distributions of log IMT in affected and unaffected individuals observed in the newly reported case-control study.
The height of each Gaussian curve in affected and unaffected individuals at a particular IMT value is the respective percentage of affected and unaffected individuals who would have that IMT value. The ratio of these heights at a particular IMT value is the number of times a person with that IMT value is more likely to be affected than people in an untested population. This ratio (the likelihood ratio [LRIMT]] was calculated for each simulated affected and unaffected individual.
The DR for each specified FPR using IMT alone was then taken as the proportion of simulated CHD affected individual with LRIMT greater than or equal to the (100-FPR)th centile of LRIMT in unaffected individuals. For example, at a fixed 5% FPR, the DR is the proportion of affected individuals with LRIMT greater than the 95th centile of LRIMT in unaffected individuals.
Because the presence of plaques is associated with IMT, this association needs to be accounted for in estimating the screening performance of both IMT and plaque together. From the plots of log odds of plaque against IMT in affected and unaffected individuals (see Figure A1) and the logistic regression equations that describe them (log oddsaffected = −4.572 + 6.684 × IMT and log oddsunaffected = −7.441 + 7.472 × IMT) the probability of a plaque is Paffected = oddsaffected/1 + oddsaffected in affected individuals and Punaffected = oddsunaffected/1 + oddsunaffected in unaffected individuals. The probability of an affected individual not having a plaque is 1 – Paffected and for unaffected individuals is 1 – Pcontrols. Therefore the likelihood ratio for plaque, LRplaque+ is Paffected/Punaffected and the likelihood ratio for no plaque LRplaque– is 1 – Paffected/1 – Punaffected. A combined likelihood ratio for those with plaque is then LRC = LRIMT × LRplaque+, and for those without plaque is LRC = LRIMT × LRplaque–.
Plot of log odds of plaque against intima-media thickness in CHD affected and unaffected individuals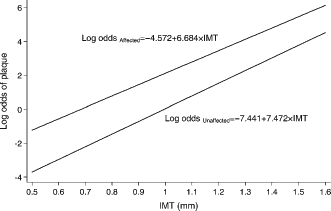
The DR for each specified FPR using IMT and plaque together was calculated as described for IMT alone but using the combined likelihood ratio LRC, and with plaque/no plaque assigned to each simulated affected and unaffected individual, by categorizing IMT values (categories 0.1 mm wide) and randomly assigning plaques within each category so that an increasing proportion of affected individuals (based on Paffected) and an increasing proportion of unaffected individuals (based on Punaffected) were assigned a plaque in increasing IMT categories.
The following example illustrates the method used. Suppose an individual has an IMT of 1.1 mm. From the results of the new case-control study, the (logio) mean and SD in affected individuals are −0.0706 and 0.1014, respectively. In unaffected individuals they are −0.1549 and 0.0833, respectively. The height of the distributions in affected and unaffected individuals at this value of IMT are calculated using the probability density function of the Gaussian distribution:
where μ is the mean, σ is the SD and x is the IMT value (log 1.1 in this example). At an IMT value of 1.1, the height of the Gaussian curve in affected individuals is
Now suppose the same person has a plaque. The odds of a plaque in affected individuals is exp(–4.572 + 6.684 × 1.1) = 16.1 and in unaffected people it is exp(–7.441 + 7.472 × 1.1) = 2.18. The probability of a plaque in affected individuals with an IMT value of 1.1 is then 16.1/1 + 16.1 = 0.942 and in unaffected individuals it is 2.18/1 + 2.18 = 0.686. The likelihood ratio then is LRplaque+ = (0.942/0.686) ≈ 1.4. The combined likelihood ratio is the two likelihood ratios multiplied together; LRC = LRIMT × LRplaque+ = 7 × 1.4 = 10.