
Abstract
Objective
To determine the ability of the quadruple Down's syndrome screening test (quad screen) to predict other adverse perinatal outcomes (APO) in a high-risk obstetric population.
Setting
A tertiary medical centre in West Virginia.
Methods
We retrospectively reviewed 342 obstetric patients with quad screen data from a single clinic. The quad screen included maternal serum levels of alphafetoprotein (AFP), human chorionic gonadotrophin (hCG), uncongjugated oestriol (uE3), and inhibin A. The risk of APO was compared between patients with at least one abnormal marker versus no abnormal markers and ≥2 abnormal markers versus <2 abnormal markers. Abnormal markers were determined by cut-off values produced by Receiver Operator Characteristic (ROC) curves and the FASTER trial. Unadjusted and adjusted effects were estimated using logistic regression analysis.
Results
The risk of having an APO increased significantly for patients with abnormal markers by about three-fold using ROC and two-fold using FASTER trial thresholds.
Conclusions
The quad screen shows value in predicting risk of APO in high-risk patients.
Introduction
More recently, the maternal serum quad screen, with its greater sensitivity (81% detection rate and a false positive rate of 5% for Down's syndrome), 9 has been replacing the triple screen. The quad test can be performed on antenatal patients between 15–22 weeks gestation and includes the triple screen serum markers and an additional marker, inhibin A, which is initially produced by the corpus luteum and later by the placenta. Cuckle et al. have shown an elevated inhibin A level to be predictive of pre-eclampsia 5 while Aquilina et al. added uterine artery Doppler to this marker at 20 weeks and found improved screening efficacy. 10 Wald et al. reported in a nested-case control study that inhibin A and hCG values were significantly raised, uE3 values were significantly lowered and AFP values were not significantly different for patients who developed pre-eclampsia. 11 The FASTER trial prospectively followed 33,145 pregnancies and concluded that two or more abnormal markers predicted adverse outcomes, but did not support using the quad screen as a screening tool to predict adverse pregnancy outcomes. 9 In addition, the authors stated that they were not sure if their findings could be generalized to an obstetric population at high risk.
Patients in our clinic are at risk for adverse outcomes because of conditions such as hypertension, diabetes, heart disease, renal disease, obesity, tobacco dependence, drug use or low socioeconomic status. We converted from the triple screen to the quad screen on 1 July 2002. Our goal was to study abnormal quad screen markers defined by Receiver Operator Characteristic (ROC) curves or threshold values from the FASTER study 9 to predict APO in singleton pregnancies in a high-risk obstetric population. This is particularly important, due to the fact that other studies included low-risk populations.1,2,5,9,11
Material and Methods
The study population consisted of obstetric patients who had second trimester quad screens at 15–22 weeks of gestation and gave birth at our institution between 1 January 2004 and 31 December 2005. Most of these women received prenatal care through a clinic at the institution serviced by the obstetric residents. About 75% of the clinic's patients were participants in Medicaid, 47% were smokers, 22% were obese with body mass index (BMI) ≥30 (before pregnancy), and 21% were overweight (25 ≤BMI < 30). All patients presenting for prenatal care by weeks 15–22 at this clinic were offered the quad screen with samples sent to Dianon Systems, Inc. (Stratford, CT, USA) for analysis. Any patient with a confirmed fetal aneuploidy, neural tube defect or multiple gestation was excluded. We retrospectively reviewed 976 consecutive patients who had live births and found 342 (35.0%) with completed quad screens and no fetal anomalies.
A sample size calculation was performed at a two-sided 5% significance level. Assuming a population prevalence of APO was 32%, the study was to have a statistical power of 80% to detect an additional APO prevalence of 16% in 108 patients with abnormal markers and 216 patients with no abnormal markers. The institutional review board of Charleston Area Medical Center/West Virginia University Charleston Division approved the study. Data were obtained through the institution's administrative billing database in electronic format and through chart review. The primary outcome was a dichotomous (dependent) variable indicating whether the patient had at least one of the following APO: pre-eclampsia/eclampsia, preterm delivery (<37 weeks of gestation), and small for gestational age (SGA) infants. Pre-eclampisa was defined as gestational hypertension with significant proteinuria (a minimum of 300 mg/24 hours). Eclampsia was defined as occurrence of ≥1 generalized convulsions and/or coma in the setting of pre-eclampsia and in the absence of other neurological conditions. SGA was defined as birth weights ≤5th percentile that were confirmed by gestational age based on the study by Alexander et al. 12 Both birth weight and gestational age were found from the patient chart. Pre-eclampsia and eclampsia were captured using ICD-9 codes (64241, 64251, 64261, and 64271) while preterm birth was calculated using estimated gestational age.
Multiples of the median (MoM) of AFP, hCG, uE3, and inhibin A were collected. Abnormal markers were defined first with values derived from ROC curves from MoM values from our study population. For each marker (AFP, hCG, uE3, and inhibin A) we ran ROC curve analysis in SPSS (Chicago, IL, USA) for the presence of an APO. Figure 1 is an example of the ROC curve for inhibin A marker and APO. To identify optimal cut-off points using sensitivity, specificity and the ROC curve, we calculated the Youden index (J).
1
It is defined as the maximum vertical distance between the ROC curve and the diagonal line or the point on the curve farthest from chance.
13
It assumes that sensitivity and specificity are equally important
14
and uses the following formula: J = maximum {sensitivity + specificity −1}.13,14 The result of abnormal markers was > 1.47 MoM for AFP, <0.81 MoM for uE3, > 1.13 MoM for hCG and > 1.51 MoM for inhibin A. These ROC curve threshold values were comparable with those set in a study in Turkey in which the triple screen markers were analysed.
15
To compare with the FASTER trial, we used their abnormal marker values, which they derived by combining ROC curves from a sample of 33,145 pregnant women and their clinical judgement. These abnormal markers were ≥2.0 MoM for AFP, ≤0.5 MoM for uE3, ≥2.0 MoM for hCG and ≥2.0 MoM for inhibin A.
ROC curve: Inhibin A Marker and ≥1 APO (Area Under the Curve = 0.602)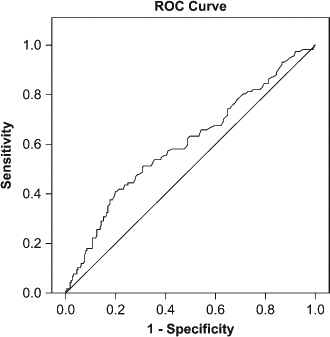
APO were compared across each quad screen (and thus each patient) with ≥1 abnormal markers (defined as at least one of the markers having an abnormal MoM value) versus no abnormal markers and ≥2 abnormal markers versus <2 abnormal markers (meaning 1 or no abnormal markers). These data were analysed with SAS 8.02 (SAS Institute Inc, Cary, NC). Significance level 0.05 was used in the analysis. Statistical tests for significance included the Student f-test for continuous variables and chi-square test for categorical variables for comparing patient characteristics. Multiple logistic regression analysis was performed to investigate the associations between abnormal markers and an APO. Potential confounding variables including demographics, comorbidities, and pregnancy characteristics were initially selected based on statistical significance at the bivariate level with either quad screen or APO. Final confounders were then selected using backwards elimination logistic regression. Only those variables that were significant at a level of 0.05 were included in the final models. Thus, a total of three analyses were made, two based on ROC curve thresholds and one based on the FASTER trial thresholds (a small sample size did not permit an additional analysis of ≥2 abnormal markers). Odds ratios (OR) and their 95% confidence intervals (CIs) were calculated.
Results
We analysed data from 342 patients who met our inclusion and exclusion criteria. The mean age at delivery was 24.0 years (standard deviation 5.1, range 16–41) with most in the age group of 20–24 (43%). The majority (84%) of the patients were white, and 13% were black. Tobacco use (43%) was high, and 6% of women had substance abuse problems. Twenty-nine percent were obese (before pregnancy BMI ≥30), and 24% were overweight (25 ≤BMI<30). Over 20% had chronic hypertension (21%). One or more APO (n = 117) occurred in 34.2% of the study population. Table 1 displays the distribution of APO.
Distribution of APO
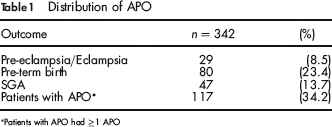
Patients with APO had ≥1 APO
Using ROC curve thresholds, 224 (65.5%) patients had ≥1 abnormal markers. Patient characteristics were compared between ≥1 abnormal markers and no abnormal markers (Table 2). There were no significant differences between abnormal and no abnormal markers in maternal age, race, living births, gravida, substance abuse, BMI before pregnancy, chronic hypertension, or history of preterm labour. Significantly more of the patients with ≥1 abnormal markers were smokers (49.6%) compared with those with no abnormal markers (30.4%) (P = 0.0008). While we did not adjust the MoM values for smoking, we included smoking as a potential confounder in our regression model. However, it was not statistically significant. Analysis results show that ≥1 abnormal markers was significantly associated with an APO (OR 2.8 with 95% CI (1.7, 4.7) and a P value of 0.0001) (Table 3).
Patient characteristics by abnormal versus no abnormal markers
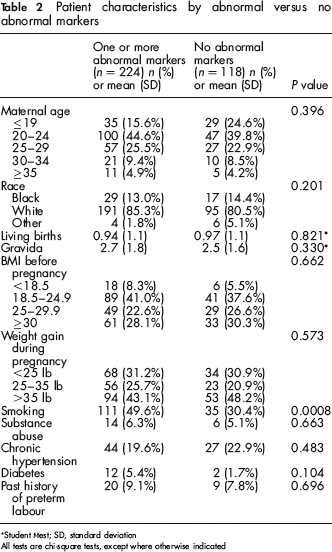
Student f-test; SD, standard deviation
All tests are chi-square tests, except where otherwise indicated
Ability of abnormal markers to predict APO
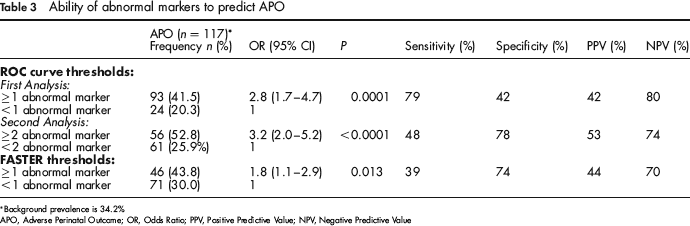
Background prevalence is 34.2%
APO, Adverse Perinatal Outcome; OR, Odds Ratio; PPV, Positive Predictive Value; NPV, Negative Predictive Value
There were 106 (31.0%) patients who had two or more abnormal markers using ROC curve thresholds. A bivariate analysis comparing characteristics of patients with ≥2 abnormal markers versus <2 abnormal markers showed that the only significant factor was past history of preterm labour (14.3% versus 6.1%, P = 0.013). Difference in smoking was not statistically significant at the bivariate level but was included in the model because of significant difference with the APO groups. The results of backward elimination logistic regression suggested that both smoking and history of preterm labour were not significant final confounders so there was no need to adjust for either. Two or more abnormal markers were statistically associated with an APO (OR 3.2, 95% CI 2.0–5.2, P < 0.0001). Thus, women with ≥2 abnormal markers are more than three times at risk of an APO than women with <2 abnormal markers (Table 3).
Using the FASTER trial threshold values, 105 patients (30.7%) had ≥1 abnormal markers. When patient characteristics were compared between this group and no abnormal markers (n = 237), three variables differed significantly. Gravida was higher among those with abnormal markers (3.0) compared with those with no abnormal markers (2.4, P = 0.016). Smoking was higher for patients with ≥1 abnormal markers at 53.3% compared with 38.5% for those with no abnormal markers (P = 0.011). Finally, preterm labour history was statistically different with 13.5% comprising those with ≥1 abnormal markers versus 6.5% with no abnormal markers (P = 0.036). Using backward elimination logistic regression, all three potential confounders were not significant in the final model. There was almost a two-fold increase in risk of APO for women with ≥1 abnormal markers (OR 1.8, 95% CI 1.1–2.9, P = 0.013) as indicated in Table 3.
There were only 21 patients with ≥2 abnormal markers in our sample (and 321 with single or no abnormal markers) using FASTER trial thresholds. Although this was a small sample size, there was a non-significantly higher proportion of APO, 47.6% (10 patients) versus 33.3% (107 out of 321 patients) for the <2 abnormal markers group.
Discussion
While calculation of results of the quad screen in the laboratory corrects for a number of variables (maternal ethnicity, maternal age, maternal weight, gestational age, maternal diabetes, family history of neural tubal defects, and prior Down's syndrome pregnancy), it does not correct for smoking. Studies from the United Kingdom by Rudnicka and Crossley have found that maternal smoking increases the false-positive rate in screening for Down's syndrome.16,17 Our comparison of the APO groups resulted in smoking as a potential confounder. However, using logistic regression, we found that smoking was not a significant predictor of APO. This is especially important to analyse because of the high rate of smoking (43%) in our study population and the fact that the FASTER trial had a low rate of patients smoking during pregnancy. While the quad screen laboratory results report a MoM value for each marker (already adjusted for gestational age), we calculated a f-test to see if there was a difference in gestational age between our outcome groups. We found a non-significant difference with an average of 17.2 weeks in the group with at least one APO and 17.6 weeks in the normal outcome group.
A concern of the FASTER study was the ability to generalize their findings to a high-risk obstetric population. Our study demonstrates that the quad screen is useful in predicting APO in a high-risk population, which had higher rates of APO as expected. While the FASTER trial makes the association between abnormal markers and APO, their study found the sensitivity and positive predictive value were low. The authors did not call for the use of the quad screen to screen for APO. Our study had better positive predictive values (PPV) ranging from 42% to 52%. The negative predictive value (NPV) in our study was better (70–80%) than our PPV but not as good as in the FASTER study. Both studies had better negative rather than positive predictive value.
With the quad screen as a routine prenatal screening tool, an additional use of it would not incur additional expense or screening but extend its utility to screen for risk of an APO. Wald et al. supported the use of the quad screen to screen for pre-eclampsia and noted that it is simple, worthwhile, and involves minimal additional costs. 11 The laboratory results for a quad screen at our institution currently include MoM results for each marker. Adding an abnormal range for risk of APO to this laboratory report could serve as an additional tool for clinicians to ascertain patients at risk for APO. Further studies may be required to determine if antenatal surveillance and growth ultrasounds may be clinically indicated in patients with abnormal markers.
Limitations of the study include a small sample size and possible selection bias. Only 35% of the 976 consecutive obstetric patients were included in the analysis. Patients were excluded due to multiple gestations, true positive quad results, and quad screens not done. There were several reasons why quad screens were not done: patients entered prenatal care after the appropriate gestational time for the quad screen testing, patients declined screening, and others were referred from outlying facilities with variable aneuploid screening practices. Several patients had the triple screen rather than the quad screen completed. Some women declined quad screen testing due to religious, socioeconomic, and educational factors. We did comparisons to see if those patients without the quad screen differ from our study population. Patient characteristics of the sample (patients who had quad screen) were compared with those of the non-sample (patients who had no quad screen). Sample percentages of HTN (21%) and DM (4%) were significantly higher than non-sample percentages (HTN 10.3%; DM 1.1%). All other characteristics including race, substance abuse, smoking, maternal age, BMI before pregnancy, weight gain, history of preterm labour were not significantly different in the sample and non-sample groups.
Conclusion
In summary, this study demonstrates that quad screen can be used in predicting APO in a high-risk population. While maternal smoking was a potential confounder in our study population that had high rates of smoking, it was not statistically significant as an independent predictor of APO. These results suggest that women with ≥1 abnormal markers on a quad screen have nearly three times the chance of having an APO and smoking does not appear to have an effect. Our study tested Dugoff's prediction that the quad screen could perform better in a high-risk population. While our APO variable was a composite rather than discrete outcomes, we found better sensitivity and positive predictive values when compared with the Dugoff study 9 (as one would expect as a consequence of the high-risk population), but we found lower specificity and negative predictive value. While there is poor specificity when using these markers for APO, we think that sensitivity is more important, since clinicians may want to identify as many individuals as possible who are at risk for APO and proceed to monitor these patients more closely. Within our own data set, comparing the FASTER study cut-off values with our own ROC curve values for ≥1 abnormal markers, we found better OR and higher sensitivity and negative predictive value, while the FASTER thresholds yielded higher specificity and positive predictive value. By using the quad test to predict APO in addition to screening for Down's syndrome, trisomy 18, and neural tubal defects, we can maximize the benefit of a standard prenatal screening. Closer surveillance of women with ≥1 abnormal markers on a quad screen using non-stress tests, ultrasounds, blood pressure and protein levels should be considered.