
Abstract
Objective
To compare interval breast cancer rates (ICR) between a biennial organized screening programme in Norway and annual opportunistic screening in North Carolina (NC) for different conceptualizations of interval cancer.
Setting
Two regions with different screening practices and performance.
Methods
620,145 subsequent screens (1996–2002) performed in women aged 50–69 and 1280 interval cancers were analysed. Various definitions and quantification methods for interval cancers were compared.
Results
ICR for one year follow-up were lower in Norway compared with NC both when the rate was based on all screens (0.54 versus 1.29 per 1000 screens), negative final assessments (0.54 versus 1.29 per 1000 screens), and negative screening assessments (0.53 versus 1.28 per 1000 screens). The rate of ductal carcinoma in situ was significantly lower in Norway than in NC for cases diagnosed in both the first and second year after screening. The distributions of histopathological tumour size and lymph node involvement in invasive cases did not differ between the two regions for interval cancers diagnosed during the first year after screening. In contrast, in the second year after screening, tumour characteristics remained stable in Norway but became prognostically more favorable in NC.
Conclusion
Even when applying a common set of definitions of interval cancer, the ICR was lower in Norway than in NC. Different definitions of interval cancer did not influence the ICR within Norway or NC. Organization of screening and screening performance might be major contributors to the differences in ICR between Norway and NC.
Introduction
The ICR is an important indicator of screening performance.7,8 An interval breast cancer is defined as breast cancer diagnosed within a defined period following a negative screening examination, most often two years in Europe and one year in the U.S.7,8 Interval cancers are considered a shortcoming in a screening programme due to prognostically unfavourable tumour characteristics compared with screen-detected cancers9–11 and consequently less favourable survival from the disease.9,10,12
Screening mammography programmes can vary in their invitation procedures, recommended screening intervals, number of views performed, reading procedures, and performance. There is also considerable variation in the general health care systems within Europe,4,13 and also between Europe and the U.S.1,6,13,14 With these challenges in mind, we investigated the ICR in Norway and North Carolina (NC), USA, two places that have population registration for documentation of cancer following screening mammography. The main objective of the study was to test the effects of various definitions of interval cancer as delineated by Bulliard et al. 3 on the ICR between and within the organized screening programme in Norway and the self-referring, opportunistic screening in NC.
Material and Methods
Data were obtained from the Norwegian Breast Cancer Screening Program (NBC SP) and the Carolina Mammography Registry (CMR) for the time period 1996–2002. The NBCSP and CMR both collect prospective data on mammography activity (for all women invited to the screening programme in Norway, and for women seen in facilities that participate in CMR in NC), and the mammography data are linked to population-based breast cancer outcomes.
Women aged 50–69 at a subsequent screening without prior breast cancer were included in the study. Prevalent screens were excluded since performance at prevalent and subsequent screens tends to differ.4,11,15 Subsequent screens from 151,678 Norwegian and 153,219 NC women were thus the basis for the study. Over the six-year study period, the Norwegian women had an average of 1.8 screens resulting in 269,816 screens, while the NC women had an average of 2.3 screens totalling 350,599 screens. The average age was 59.7 years (SD 5.1) for Norwegian and 58.8 years (SD 5.7) for NC women. Further, 52% (141,182/269,816) of the Norwegian women were aged 50–59 at screening, compared with 59% (207,062/350,599) of the NC women.
Screening in Norway
The NBCSP is a government-sponsored, population-based screening programme administered by the Cancer Registry of Norway. Administration of the programme includes screening operations, data collection, and quality assurance. The NBCSP is mandated in the Cancer Registry regulation, 16 which permits collection of data and subsequent evaluation. All women aged 50–69 are invited to participate in the screening programme by a personal letter stating the time and place for examination. The screening interval is 24 months (±6 months); 97% of women receive invitations at that interval. An unknown, but presumably small, number of women have an additional (‘opportunistic’) screening at private clinics in between two screening examinations in the NBCSP. Data on opportunistic screening are not available in Norway.
The programme performs independent double reading with consensus. 17 A five-point rating scale indicating the probability of a cancer is used to interpret screening mammograms. All cases having a score of two or higher by one or both of the radiologists are discussed at a consensus meeting, where the final decision whether to recall women is made. Further assessment is performed at centralized breast clinics and includes additional imaging, ultrasound, clinical examination and/or invasive procedures, if necessary. Usually, all the procedures related to further assessment are performed in one day. The programme does not recommend short-term follow-up.
The participation rate was 78%, and the coverage 84% during the first ten years of the programme.
11
The recall rate among subsequent screens was 2.7% and the screening detection rate 0.51% in the study population (Figure 1).
Numbers of screens, rescreens and interval cancers detected 1–12 and 13–24 months after screening in Norway and North Carolina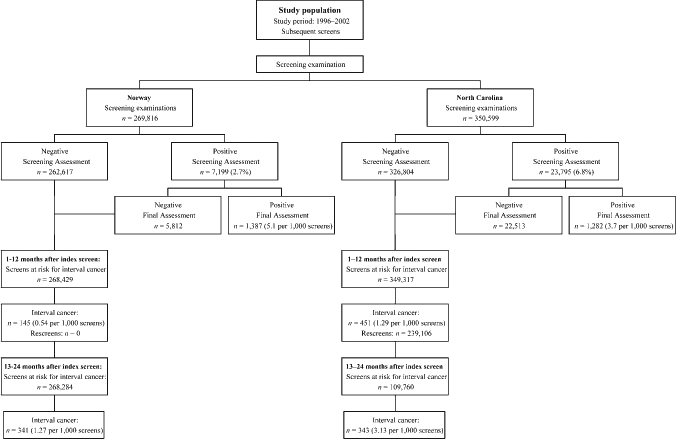
Screening in North Carolina
The CMR is based in the state of NC and funded by the National Cancer Institute as a member of the multi-site Breast Cancer Surveillance Consortium (BCSC). 18 CMR collects prospective data from community-based mammography practices in NC. There are standardized quality control procedures for data collection and analysis. CMR is reviewed and approved by the University of North Carolina Institutional Review Board annually, and holds a US Public Health Service Certificate of Confidentiality. 19
Women in NC self-refer for screening or are screened on recommendation from their primary care physician, considered opportunistic screening in contrast to the organized screening programme in Norway. Guidelines recommend that women aged 40 and older be screened every 12–24 months.20,21 Most physicians recommend a screening interval of 12 months.
NC uses the BI-RADS® coding system for reporting the assessment of the mammography exam. 22 The assessment is coded as 1 = normal, 2 = benign, 3 = probably benign 4 = suspicious abnormality, 5 = suspicious for cancer and 0 = needs further evaluation. Assessments with a code of 0, 4 or 5 are recalled for further diagnostic work-up. The ‘3’ in BI-RADS is associated with a recommendation for short-term rescreen, usually 6 months, and is not considered a recall. Mammograms with a score of 3 were excluded from this study (N = 5,131), as there is no short-term rescreen in Norway. Although single reading is most usual, approximately 20% of mammograms underwent independent double reading.
The facilities that participate in CMR cover approximately 25% of the women being screened in NC. The recall rate in subsequently screened women aged 50–69 was 6.8% and the cancer detection rate 0.37% (Figure 1).
Interval cancers
The general definition of an interval cancer is a breast cancer diagnosed within a defined period (the formal screening interval for the programme mentioned above) following a negative screening examination.7,8 A screening examination is considered negative if the screening assessment or final assessment is negative. A screening assessment is based on the screening mammograms only, while the final assessment is also based on additional imaging and histology reports. A histological diagnosis of breast cancer is mandatory in the identification process of interval cancers.
Both invasive cancers and ductal carcinomas in situ (DCIS) were included as interval cancers, while lobular in situ cancers were excluded.
Analysis
An interval cancer can only be diagnosed after a negative screening examination. Women were followed to a diagnosis of interval cancer, to the next screening examination, or at least two years after the last mammogram. ICR are presented by time since screening: one and two year follow-up (1–12 months and 13–24 months). We considered the number of emigrations and deaths negligible in the study groups, so that no censuring for these events was performed.
ICR were calculated for all cancers, DCIS alone, and invasive cancers alone using different denominators: a) all screening examinations, b) negative screening assessments with negative final assessments and c) negative screening assessments only (Table 1). Rates are presented without any age adjustment since age adjustment, using the combined Norway and NC study populations as the standard, showed negligible differences. Statistical differences in rates both between and within Norway and NC were explored using a chi-square test. The significance level was set at 5%. The analyses were conducted using SPSS (Version 14.0.1 for Windows, SPSS Inc, Chicago, Illinois), R Statistical Computing (Version 2.0.1), and SAS (Version 8, Cary, NC).
Numerators and denominators used for calculations of interval cancer rates in this study
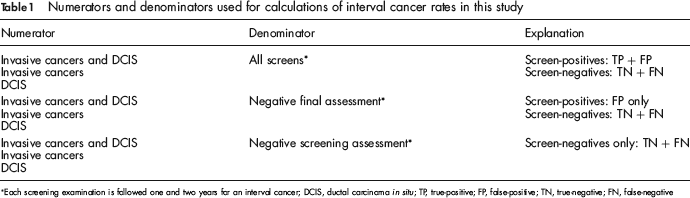
Each screening examination is followed one and two years for an interval cancer; DCIS, ductal carcinoma in situ; TP, true-positive; FP, false-positive; TN, true-negative; FN, false-negative
Results
A total of 269,816 subsequent screening examinations in Norway and 350,599 in NC were performed during the study period (Figure 1). A total of 1387 screen-detected (5.14 per 1000 screens) and 486 interval cancers (1.80 per 1000 screens) were diagnosed in Norway, and 1282 screen-detected (3.66 per 1000 screens) and 794 interval cancers (2.26 per 1000 screens) in NC. During the first 12 months after screening, 145 interval cancers were diagnosed in Norway (0.54 per 1000 screened) and 451 in NC (1.29 per 1000 screens). In NC, 239,106 screen examinations were followed by a rescreen within one year (68%, 239,106/349,317; Figure 1). These women were thus not at risk for an interval cancer 13–24 months after screening. The numbers of interval cancers 13–24 months after screening were 341 (1.27 per 1000 screens) for Norway and 343 (3.13 per 1000 screens) for NC. All of these differences were statistically significant (P < 0.05).
The ICR per 1000 screens (DCIS and invasive) 1–12 months after screening were lower in Norway compared with NC for all screens (0.54 versus 1.29), negative final assessment (0.54 versus 1.29), and negative screening assessment (0.53 versus 1.28, Table 2). The rates were 1.27 versus 3.13, 1.27 versus 3.13, and 1.23 versus 3.06 respectively for all screens, negative final assessment and negative screening assessment, 13–24 months after screening. The differences between Norway and NC were most pronounced for DCIS in all categories. The ICR of DCIS for all screens were 0.03 and 0.09 per 1000 screens in Norway, and 0.12 and 0.46 per 1000 screens in NC, for 1–12 and 13–24 months after screening. All of these differences were statistically significant (P < 0.05).
Number and rates of interval breast cancers in women aged 50–69, screened in Norway and North Carolina, 1996–2002, stratified by all screens, negative final assessment, negative screening assessment, and follow-up time
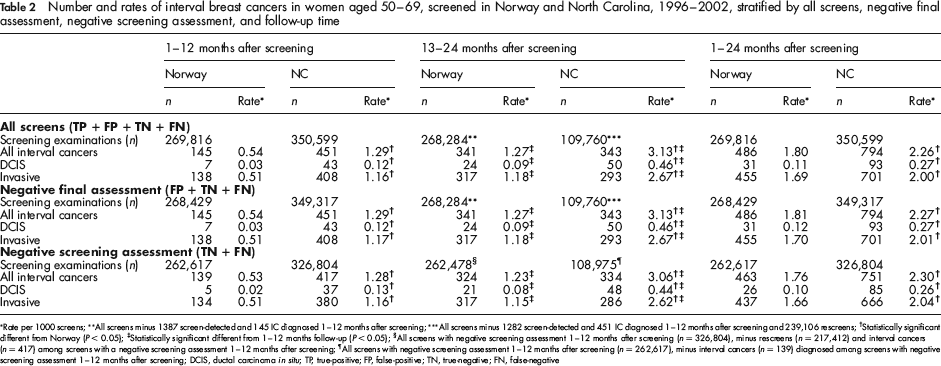
Rate per 1000 screens;
All screens minus 1387 screen-detected and 145 IC diagnosed 1–12 months after screening;
All screens minus 1282 screen-detected and 451 IC diagnosed 1–12 months after screening and 239,106 rescreens;
Statistically significant different from Norway (P < 0.05);
Statistically significant different from 1–12 months follow-up (P < 0.05);
All screens with negative screening assessment 1–12 months after screening (n = 326,804), minus rescreens (n = 217,41 2) and interval cancers (n = 417) among screens with a negative screening assessment 1–12 months after screening;
All screens with negative screening assessment 1–12 months after screening (n = 262,617), minus interval cancers (n = 139) diagnosed among screens with negative screening assessment 1–12 months after screening; DCIS, ductal carcinoma in situ; TP, true-positive; FP, false-positive; TN, true-negative; FN, false-negative
ICR within Norway and NC
In both Norway and NC, the rates differed little by denominator chosen or quantification method applied. In Norway, limiting follow-up to 1–12 months after screening resulted in an ICR of 0.54 per 1000 screens, 0.54 per 1000 negative final assessments, and 0.53 per 1000 negative screening assessments (Table 2). Corresponding values for NC were 1.29, 1.29 and 1.28. For all screens, the DCIS rate increased three-fold between the first and second year after screening in Norway and increased four-fold (from 0.12 to 0.46 per 1000 screens) in NC. All differences were statistically significant (P < 0.05).
Histopathological characteristics
The proportion of DCIS among all interval cancers was lower in Norway (6.4%, 31/486) than in NC (11.7%, 93/794, P < 0.001) during the entire study period (Table 3). The percentage of DCIS tended to be higher 13–24 months after screening compared with 1–12 months after screening: 4.8% versus 7.0% (P = 0.478) in Norway and 9.5% versus 14.6% (P = 0.038) in NC (Table 3). The percentage of invasive ductal carcinoma, invasive lobular carcinoma, and other invasive cancers did not differ between Norway and NC for cancers diagnosed 1–12 months after screening (P = 0.411, 0.565, and 0.688, respectively), while there was a higher proportion of both invasive ductal and lobular carcinoma in Norway 13–24 months after screening (73.9% and 14.7%) compared with NC (63.3% and 8.7%, P < 0.001 for both). This may be explained by the proportion of ‘other’ invasive cancers being three-fold greater in NC compared with Norway.
Distribution of histopathological types and tumour characteristics in invasive interval cancers diagnosed 1–12 and 13–24 months after screening examination in Norway and North Carolina, 1996–2002
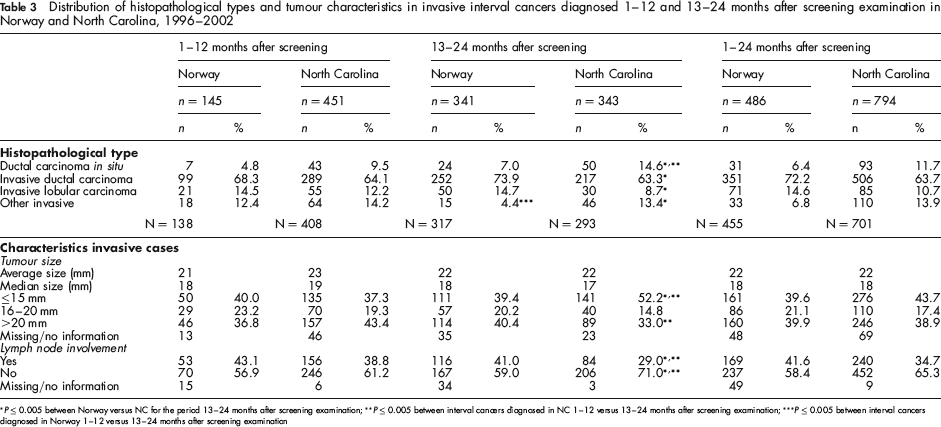
P ≤ 0.005 between Norway versus NC for the period 13–24 months after screening examination;
P ≤ 0.005 between interval cancers diagnosed in NC 1–12 versus 13–24 months after screening examination;
P ≤ 0.005 between interval cancers diagnosed in Norway 1–12 versus 13–24 months after screening examination
During the entire study period, the largest proportion of tumours were >20 mm, both in Norway and NC (Table 3). The percentages of tumours ≤15 mm, 16–20 mm and >20 mm diagnosed 1–12 months after screening did not differ between Norway and NC, in contrast to the distribution 13–24 months after screening; the percentage of cancers ≤15 mm was stable in Norway (40.0% and 39.4%, P = 0.991) while it increased in NC (from 37.3% to 52.2%, P < 0.001). The proportion of tumours >20 mm remained stable in Norway (36.8% and 40.4%, P = 0.561), while it decreased in NC (from 43.4% to 33.0%, P = 0.010). The percentage of lymph node positive tumours was 43.1% in invasive interval cancers diagnosed 1–12 months after screening examination in Norway, and 38.8% in NC (P = 0.457). The percentage remained stable by time after screening in Norway (from 43.1% to 41.0%, P = 0.776), while it decreased significantly in NC (from 38.8% to 29.0%, P = 0.009).
Discussion
Despite the uniform definition and quantification of interval cancer, the rates were lower in Norway compared with NC. The ICR within the two locations did not differ markedly by varying the denominator – all screens, negative screening assessment, and negative final assessment. A substantially lower rate and proportion of DCIS were found in Norway than in NC. Histopathological tumour characteristics did not differ between Norway and NC in invasive cancers diagnosed 1–12 months after screening examination. Tumour characteristics remained stable during the follow-up time in Norway, but tended to have more prognostically favourable characteristics in NC 13–24 months after screening.
As common definitions and quantification of interval cancer were applied in Norway and NC, the observed differences in the ICR between the two places are likely due to other reasons, such as programme organization, recommended screening intervals, the individual screening history, reading procedures, and screening performance.
Screening organization
In the organized screening programme in Norway, women are invited by a personal letter to a fixed place and time for screening examination biennially. Due to programme logistics, no woman is screened in the programme sooner than in the two-year period. If women choose to do so, they are referred to private clinics, and an eventual cancer diagnosed is defined as an interval cancer. The nationwide screening database in combination with the 11-digit personal identification number and the completeness of the Cancer Registry of Norway ensure accurate surveillance. 23
CMR covers 25% of the screening facilities in NC and the opportunistic screening in NC is more flexible compared with Norway. In contrast to the Norwegian invitation system, screening in NC is defined by the radiologist, who records the visit as a screening or diagnostic examination at the time of the procedure. All women are reminded to return for their next screening exam, although each facility determines its own procedures for reminders. Most NC women were rescreened within 12 months (66%, 239,106/349,317), and 77% (307,285/349,317) re-attended within 18 months. Coverage policies of insurance companies are one important reason for choosing an interval of more than 12 months. Many women re-attend in the 13th month because of insurance policies that will only pay for one mammogram per year. This would be annual screening.
Other possible reasons for a delayed screening were not investigated in this study, but the topic warrants further research. A delayed screening examination has been shown to increase the risk of breast cancer in Norway; 24 this finding may also apply to NC, but should be interpreted with care in the absence of NC-specific data.
Screening interval
The different screening intervals make comparison of ICR difficult both with respect to screening history prior to the actual interval cancer and according to follow-up time. This study includes only subsequent screens, and does not take into account the individual screening history in terms of total number of previous screening examinations and their regularity. It appears that little is known about ICR in women having annual screens for more than 10 years (NC) compared with biannually screened women who had their first invitation when they were aged 50 (Norway). Considering women's screening history and its influence on the ICR is an important area for future research. Moreover, an ideal follow-up time cannot be suggested from this study since one year follow-up is artificial for Norway as is two years for NC.
The different screening intervals could be dealt with by using women-years in the denominator. 6 Using women-years would have given a larger increase in the denominator for Norway compared with NC, but lowered the ICR in both places. Considering a cancer appearing a certain time after a screening examination regardless of the chosen screening interval by following each screen until the diagnosis of a breast cancer (screen-detected or interval), the next screen or one/two years after the last screen is a possible way of addressing the challenge. Analysis stratified by time after screening as a simple proxy for estimating women-years at risk is another analytic approach. There are several methods for calculating ICR, including as a rate of the background incidence. 4 This method presents some weaknesses as obtaining an accurate estimate of the incidence before screening started can be difficult and the background incidence may have changed independently from screening after initiation of the screening programme. ICR could also be presented as a proportion of the total number of cancers detected within a given time frame.
Reading procedures
Use of independent double reading versus single reading is shown to yield a higher screening detection rate.6,14 Less is known about its influence on the ICR, though this study documents a favorable effect of independent double reading on the ICR. In addition, recommendations for minimum reading volume differ in Norway and NC: 5000 screens annually for radiologists in Norway and 960 screens biennially for radiologists in NC. Most of the Norwegian radiologists are general radiologists, and only about one-third actually read the annual recommended volume (Hofvind et al., in preparation). Studies show conflicting results regarding the influence of volume on the sensitivity of cancer detection by reading procedure.25,26
The recall rate and the positive predictive value are two other performance measures that should be taken into account when analysing the ICR. The US is known to have recall rates that are two to three times higher than those observed in Europe.6,13,14,27 The recall rate in this study was 2.7% for Norway and 6.8% for NC. The higher recall rate and lower cancer detection rate in NC are associated with a higher ICR in our study. All these performance indicators are closely linked and should be interpreted together.
Definition of interval cancer
Bulliard et al. defined interval breast cancers as ‘those tumors that are diagnosed in the time period between two screening rounds’. 7 In NC and the US, further assessment ends with the imaging assessment and a recommendation for biopsy, and does not include the biopsy results.8,22 The transformation of Norway's data into the US definition resulted in five fewer interval cancers. These five cases had a benign biopsy following a positive screening assessment and additional imaging. We consider this an insignificant number (1.03%, 5/486).
Another definition issue is whether or not to include DCIS. We chose to analyse all cancers, DCIS, and invasive cancers separately. We obtained different results for DCIS and invasive cancers. Thus, whether DCIS is included or not in the ICR appears to be an important factor and should be clearly explained in all presentations.
Histopathological type and tumour characteristics
The higher rate of DCIS in NC compared with Norway could be due to differences in the pathologists’ perception and interpretation. The use of digital mammography and computer-aided detection (CAD) cannot explain the difference in DCIS rates since digital mammography was infrequently used in Norway and NC during the study period.
A proportion of DCIS that is twice as high in NC as in Norway is striking. However, the same trend was also found in a recent study comparing ICR in Norway and Vermont. 6 Usually, the DCIS proportion of interval cancers is low because it rarely causes symptoms and does not differ much from that found in breast cancers of non-screened women.28,29 A high proportion of DCIS among interval cancers could be due to misclassification or could be indicative of women undergoing (‘opportunistic’) screening mammography in the period between programme invitations.
There may be an expectation of increased tumour size and a higher proportion of lymph node positive tumours in interval cancers following longer screening intervals, due to increased delay in diagnosis. These expectations have been disproved recently,30,31 and this study showed no differences for Norway in tumour size or proportion of lymph node positive tumours 1–12 and 13–24 months after screening. Interestingly, interval cancers diagnosed 13–24 months after screening examination in NC had a smaller tumour size and the percentage of tumours with lymph node involvement was lower than for those diagnosed 1–12 months after screening. It is possible that these mammograms were misclassified as diagnostic, when they were indeed screening, but we have no data at this time to support this. We do not have a ready explanation for the better prognostic characteristics of interval cancers in NC.
Conclusion
The ICR were higher in NC compared with Norway when applying uniform quantification for interval cancer. The rates did not differ statistically within Norway and NC by varying the denominator – all screens, negative screening assessment, and negative final assessment. Using common definitions cannot outweigh differences in the health care systems, organization of mammography screening, and screening performance in the two regions.
Footnotes
Acknowledgements
We thank the International Cancer Screening Network (ICSN) for patience and support during many years of work. Bob Allis has done a great job with the extracting of data from the Carolina Mammography DataBase. We hope this work will stimulate discussions about the topic of IC in breast cancer screening.
The CMR is supported by a grant from the National Cancer Institute, U01-CA70040. The collection of cancer incidence data was in part, supported by the North Carolina Central Cancer Registry which is partially supported by the Centers for Disease Control and Prevention under cooperative agreement NC U58 DP000123–02. The content of this publication is solely the responsibility of the authors and does not necessarily represent the official views of the National Cancer Institute or the Centers for Disease Control and Prevention.