
Abstract
Objectives
To assess the validity of self-reported Papanicolau (Pap) smear history in Norwegian women and to identify characteristics that influence the validity.
Methods
Interview data from a sample of 16,574 Norwegian women, aged 18–45, in 2004–2005, was compared with information from the population-based cytology register. Crude validity in the self-reports with respect to ever/never having taken a Pap smear was summarized. The validity of the reported interval since last Pap smear was assessed by a smoothed distribution of the reported interval, stratified by the registered interval. Characteristics of influence on validity were identified by logistic regression for true positives (sensitivity and positive predictive value), true negatives (specificity and negative predictive value) and for more than one year discrepancy in time since last Pap smear, between reported and registered interval.
Results
Overall validity was summarized by: concordance = 0.9, sensitivity = 0.97, positive predictive value = 0.92, specificity = 0.55, negative predictive value = 0.78 and report-to-records ratio = 1.51. The variance in the reported interval increased proportionally with the registered interval, and women tended to underestimate the interval (telescoping). Age and registered number of years since last Pap smear had the strongest influence on ever/never and time interval validity, respectively.
Conclusions
Estimated screening rates, based on self-reporting without organized screening, are biased. Telescoping leads to increased risk for developing invasive disease, because women will postpone their next Pap smear.
Introduction
Self-reporting is often used as source for estimating the screening rate. In a critical review from 1999, 19 studies out of 31 (63%) reporting rates of Papanicolau smears (Pap smears) relied on self-reporting. 8 The review found the validity questionable for Pap smears (and mammography). Another review from 1997 found self-reporting to be satisfactory with respect to regularity of the testing. 9 More recently, self-reports were found to be fairly accurate, 10 although women tended to underestimate the time since last test, called telescoping. In self-reporting of Pap smears, telescoping has been consistently reported, 10 but usually the length of observation time in validation studies is limited. It is interesting to note that even without telescoping (correct recall on average), an estimate of the screening rate can be quite misleading when based on recall alone. For example, if the variance in the recalled time interval since last test increases with the length of the interval, which has been observed, 8 the rate would seem to increase closer to the interview, even if the recalled time is unbiased and the true rate is constant. 11
In this study, self-reported history of Pap smears from Norwegian women was compared with registered information as recorded in the population-based Cytology Register, which is accurate. The self-report was based on a large survey from a random sample of women, aged 18–45 years. The aim was to assess the validity of the self-reported Pap smear history, including time since last Pap smear, and identify characteristics that influence the validity.
Material and Methods
Subjects
A large random sample of 16,574 Norwegian women, aged 18–45 years, who participated in a survey in 2004–2005, provided the data for this study. The participation rate was 69%. 12 The questionnaire was the Norwegian part of a Nordic survey in the programme for developing a human papilomavirus (HPV) vaccine. The survey asked about history of Pap smears, age, education, tobacco and alcohol use, reproductive history, use of contraceptives, sexual behaviour, sexually transmitted diseases and genital warts. The survey data were linked with information from the population-based Cytology Register, using the Norwegian personal identification number (PIN). The Cytology Register has recorded every Pap smear taken in Norway since 1992. The registration is based on smears – that is, one record in the registry contains information on one Pap smear. All 22 laboratories (including private ones) that have analysed Pap smears since 1992 report on a standardized cytology report. Among the information stored are the PIN, age of the woman at the date of the smear, morphology, and the date when the smear was analysed.
Methods
Contingency tables, stratified by age, were used for overall comparison of the self-reports and register information. The register information was considered as reference (gold standard).
The following response quality measures were calculated to summarize crude validity in the self-reports with respect to ever/never having undergone a Pap smear: Concordance – the percentage of all women who reported in accordance with the register; sensitivity – percentage of women who reported smears among those with a registered smear; positive predictive value (ppv) – percentage of women with registered smears among those who reported smears; specificity – percentage of women who reported no smear among those with no registered smear; negative predictive value (npv) – percentage of women with no registered smear among those who reported no smear; and reports-to-records ratio – the ratio of reported divided by registered smears by reported divided by registered no smear. Based on the reported interval from the interview since last Pap smear in integer number of years, and the exact date from the register, the validity of the reported interval was also assessed. Stratified on the registered interval lengths, smoothed kernel density estimates were made for the distributions of the reported intervals.
To identify characteristics that influence the validity of the self-report, logistic regressions were carried out with the following dichotomous outcomes (1/0): i) true positive (sensitivity) – among those with a registered smear, 1 for those with a reported smear, ii) true negative (specificity) – among those with no registered smear, 1 for those with reported no smear. iii) true positive (positive predictive value) – among those with a reported smear, 1 for those with a registered smear, iv) true negative (negative predictive value) – among those with reported no smear, 1 for those with no registered smear, v) 1 for those with more than one year discrepancy in time since last Pap smear, between reported and registered interval. In all models lifestyle and demographic factors were used as co-variates and non-significant factors removed. Interactions, non-linearity and model fit were assessed.
Results
With regards to reported Pap smear history, 16,479 women responded and 95 did not (Table 1).
Self-reported interval since last Pap smear, in a random sample of 16,574 Norwegian women, 18–45 years of age, from 2004–2005, for the whole sample/for those with no registered Pap smears, and stratified by age group
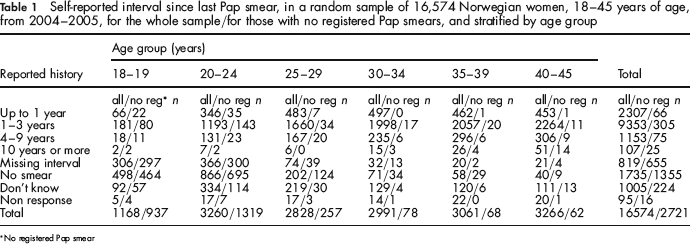
No registered Pap smear
Women who reported Pap smears
In all, 13,739 women (82.9%) reported a Pap smear, consistent with the register (Table 1). Among 24-year-old women as many as 71.7% reported Pap smears (data not shown). Inconsistencies between self-reports and register information were apparent. In total, 1126 women reported having had a smear, but had no registered history (41.4% of those with no registered smear) (Table 1). They were mostly from the younger age groups and could not have had a smear before the initiation of the register (1992). Of these, 655 women did not remember an interval – length since last smear (80% of 819 women who did not remember the interval) (Table 1). The remaining 471 out of 1126 women with no registered Pap smear, reported an interval.
Women who reported no Pap smears
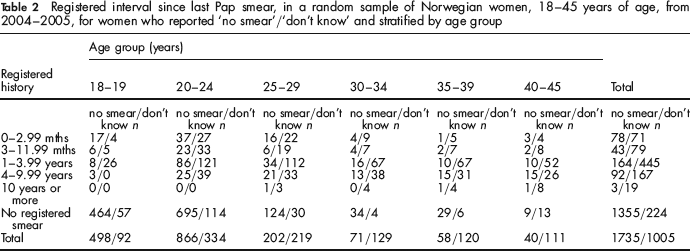
Lower accuracy was observed among women without registered smears, compared with those with registered smears. Only 1355 women reported no smear, consistent with the register (49.8% of those with no registered smear) (Table 1). Inconsistencies were found in 380 women who reported no smear, but had registered history, with a peak in 1–4 years since last smear (Table 2, Figure 1) (21.9% of 1735 women who reported no Pap smear).
Distributions (smoothed kernel density estimates) of registered interval since last Pap smear for 164 women with missing interval, 380 women who reported no smear and 781 women who reported don't know, in a random sample of Norwegian women, 18–45 years of age, from 2004–2005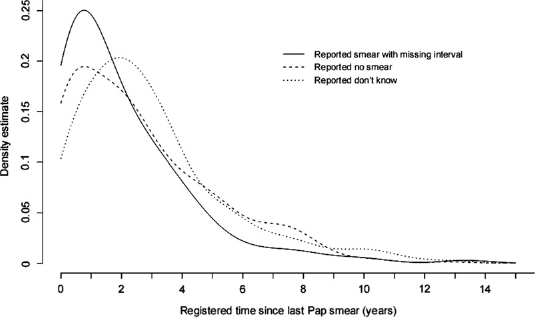
Registered interval since last Pap smear, in a random sample of Norwegian women, 18–45 years of age, from 2004–2005, for women who reported ‘no smear’/‘don't know’ and stratified by age group
‘Ever/never’ validity
When the don't know and non-response groups are disregarded, 15,474 women had both registered and reported Pap smear history, 2481 had no registered smears, thus leaving 12,993 women with a registered history of at least one Pap smear (Tables 1 and 2). When the 380 women who reported no smear are subtracted, the remaining 12,613 women describes those with both registered and reported smear. Together with the 1355 women who correctly reported no smear (see above), of a total of 1735 women who reported no smear, and the 13,739 women in total who reported at least one smear, this yields: concordance = (1355 + 12613)/15474 = 0.9, sensitivity = 12613/12993 = 0.97, specificity = 1355/2481 =0.55, ppv = 12613/13739 = 0.92, npv = 1355/1735 = 0.78 and report-to-records ratio = (13739/12993)/(1735/2481) = 1.51. Of the 1005 women who did not know whether they had had a smear or not, 781 were registered with smears, and showed a similar distribution regarding registered interval as the 380 who falsely reported no smear (Figure 1).
Validity of time interval
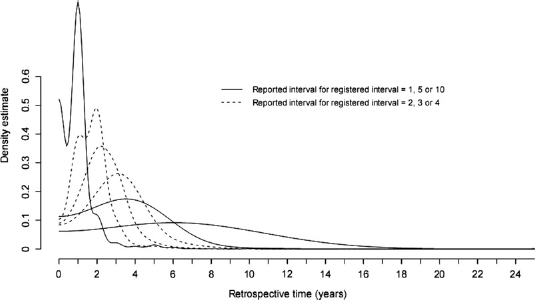
The reported interval since last Pap smear was inaccurate, compared with the registered interval. Reported intervals were given in integer years, and those who reported 0 were excluded. A total of 12,449 women had non–missing values for both reported and registered intervals. The difference between reported and registered interval was fairly symmetrically distributed around 0 (extremes excluded) (Figure 2). However, skewness appeared when the distribution of the reported interval was stratified by the registered interval (categorized by rounding to integers) (Figure 3). The variance increased proportionally with the registered interval, and a clear telescoping effect was apparent. The coefficient of variation (based on the smoothed distributions) was found to be fairly constant (between 0.56 and 0.74, with an outlier at 1 year of 0.92). Some irregularities were due to the smoothing (an end-effect yielded a top at 0 for registered interval = 1). For a registered interval of 10 years, there were no more than 26 observations.
Histogram of difference between reported and registered interval since last Pap smear, n = 12,449, in a random sample of Norwegian women, 18–45 years of age, from 2004–2005 Selected distributions (smoothed kernel density estimates) of reported interval since last Pap smear, stratified on registered interval between one and ten years, in a random sample of Norwegian women, 18–45 years of age, from 2004–2005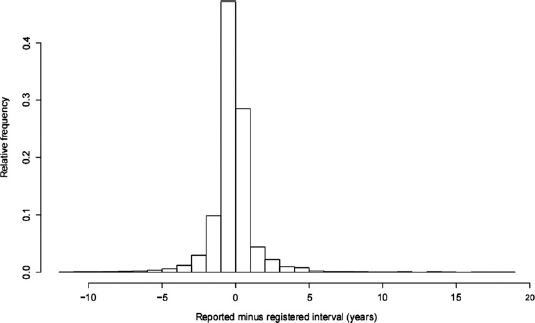
Characteristics with influence on validity
The proportion of women registered with at least one smear was 49% in the 18–24 year group, 94% in the 25–34 year group, and 98% in the 35–45 year group.
Sensitivity/specificity
The sensitivity increased, while the specificity decreased with age. Stratified by age group, the sensitivity/specificity was 0.89/0.56 in the 18–24 year group, 0.98/0.53 in the 25–34 year group, and 0.99/0.35 in the 35–45 year group respectively. While the oldest age group (35–45 years) had 12 times as high odds for reporting a smear when a registered smear existed, compared with the youngest age group (18–24 years) (OR = 12.02, 95% CI: 8.85–16.31) (Table 3), they had less than half the odds for reporting no smear when no smear was registered (OR = 0.43, 95% CI: 0.28–0.66). Patterns of dose-response were found, with increasing odds for higher sensitivity, for both increasing age, increasing self-rated health (OR = 3.34, 95% CI: 1.53–7.28, for excellent compared with poor self-rated health) and more education (OR = 6.22, 95% CI: 3.7–10.43, for more than 16 years compared with less than nine years of education). For specificity, number of lifetime sex partners was significant, with lower specificity for higher number of partners (OR = 0.94, 95% CI: 0.92–0.96).
Characteristics with influence on sensitivity (proportion of women with a reported smear among those with a registered smear)/specificity (proportion of women with reported no smear among those with no registered smear), by logistic regression, n = 12,650/2304, in a random sample of Norwegian women, 18–45 years of age, from 2004–2005
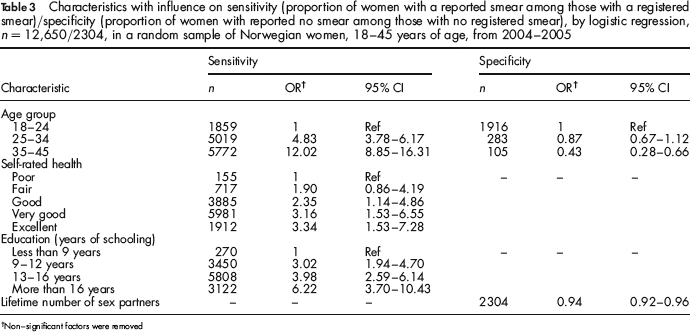
Non-significant factors were removed
Positive/negative predictive value [ppv/npv]
The positive predictive value increased, while the negative predictive value decreased with age, and even more pronounced than sensitivity/specificity. Stratified by age, the ppv/npv values were 0.65/0.85 in the 18–24 year group, 0.97/0.58 in the 25–34 year group and 0.99/0.39 in the 35–45 year group respectively. While the oldest age group (35–45 years) had 32 times as high odds for having a registered smear when reporting one, compared with the youngest age group (18–24 years) (OR = 32.6, 95% CI: 24.55–43.34) (Table 4), they had less than 1/8th of the odds for having no registered smear when reporting no smear (OR = 0.12, 95% CI: 0.07–0.19). Women who reported having had a non-normal smear had four times as high odds for being registered with a smear when reporting one (ppv) than women who did not report a non-normal smear (OR = 4.21, 95% CI: 2.8–6.34). Also, higher number of lifetime sex partners was significantly associated with higher ppv (OR = 1.05, 95% CI: 1.03–1.06), but lower npv (OR = 0.93, 95% CI: 0.91–0.95). The odds of having no registered smear when reporting no smear (npv), was significantly lower for smokers than for non/past smokers (OR = 0.72, 95% CI: 0.54–0.96), where-as the odds of having a registered smear when reporting one (ppv) was significantly higher for those with binge-drinking less than one time per month compared with never binge-drinking (OR = 1.33, 95% CI: 1.07–1.64).
Characteristics with influence on positive predictive value (registered Pap smear among reported)/negative predictive value (no registered Pap smear among reported no Pap smear), by logistic regression, n = 12 612/1 668, in a random sample of Norwegian women, 18–45 years of age, from 2004–2005
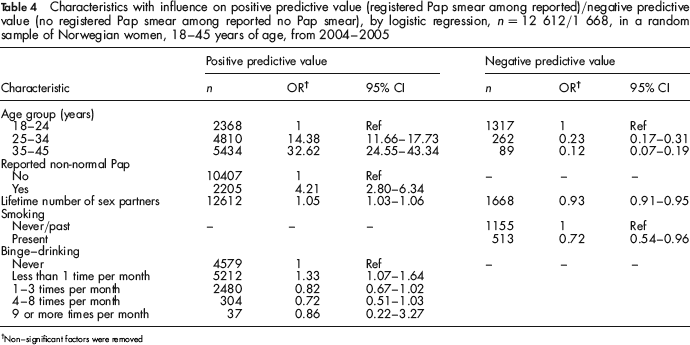
Non-significant factors were removed
Inconsistent timing
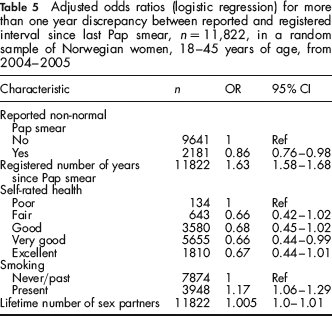
A discrepancy of more than one year (in either direction) between reported and registered interval since last Pap smear was considered inconsistent timing. Those women who reported having had a non-normal smear had significantly less inconsistent timing compared with those without a non-normal smear (OR = 0.86, 95% CI: 0.76–0.98, Table 5). Also, those with very good self-rated health had significantly less inconsistent timing than those with poor self-rated health (OR = 0.66, 95% CI: 0.44–0.99). Characteristics significantly associated with more inconsistent timing were longer registered interval (in years) (OR = 1.63, 95% CI: 1.58–1.68), smoking (OR = 1.17, 95% CI: 1.06–1.29) and number of lifetime sex partners (OR = 1.005, 95% CI: 1.0–1.01).
Discussion
Differences in validity of self-reported cancer screening behaviour across different cities and populations have been well documented. A recent review found that racial and ethnic minorities were less likely to provide accurate self-reports, with over-reporting as particularly problematic. 13 Another review based on 12 studies found that self-report in Pap smears was less accurate than mammography. 9 In terms of concordance, sensitivity, specificity and report-to-records ratio, the Norwegian women in this study performed better than the weighted average of the 12 studies included in the latter review. Nevertheless, validity problems were evident.
In Norway the recommended screening age range is 25–69 years, with an interval of three years. 4 The proportions of women under 25 years who reported Pap smears, and women of recommended screening age who reported more than three years since last Pap smear, were both larger than desired. A high report-to-records ratio (1.5) indicated over-reporting. 9 Even though sensitivity and positive predictive value were high, specificity and negative predictive value were both fairly low. This indicates poor self-reporting, when it comes to identifying the women without smears. When a woman in the 35–45 year age group reports no smear, it is more likely that her self-report is false rather than true (negative predicted value of 0.39). This is useful clinical information. The large decrease in negative predicted value with age is, of course, partly due to the low proportion of women who actually had no smears in the highest age group (2%). It seems unlikely that the 380 women who reported no smear, and had registered smears (affecting the negative predictive value) reflects forgetting. Their registered interval distribution was similar in shape to both the don't know group, and the group that had forgotten the interval (Figure 1), with peaks at 1–2.5 years, not consistent with forgetting, which is expected to increase with increasing interval length. Rather, this probably reflects poor communication between smear taker and the woman. The fact that the majority of women who reported a smear, but could not remember how long ago, had no registered smear history (80%), is probably of the same nature. Both these categories of false self-reports are dominated by the young age-groups (below recommended screening age), which might indicate potential improvement by specific information for them.
Adjusted odds ratios (logistic regression) for more than one year discrepancy between reported and registered interval since last Pap smear, n = 11,822, in a random sample of Norwegian women, 18–45 years of age, from 2004–2005
In terms of characteristics influencing the validity, the results were intuitive, except for the number of lifetime sex partners and binge-drinking, both of which were associated with a higher positive predictive value. Many sex partners might increase Pap smear awareness indirectly if increased awareness of exposure to sexually transmitted diseases motivates contact with the health care system. In a similar fashion, binge-drinking less than one time per month (compared with never) might reflect risk behaviour associated with more sex partners and increased awareness. Having reported a non-normal smear was associated with higher positive predictive value and less inconsistent timing. This is also seen in other areas, for example remembering an earlier depressive episode better, when having recurrent episodes, 14 but in contrast to findings of similar self-reporting of mammography from women with and without experience of breast cancer. 15 A longer registered interval since last Pap smear was associated with more inconsistent timing. This has been observed elsewhere, 8 but not consistently. 9 In these data this association was strong, with increasing variance with increasing time interval, together with telescoping (Figure 3).
A strength in this study is the size of the sample, that facilitated validation of recall for registered intervals longer than seen elsewhere (10 years). Even though a large number of women participated in the survey (n = 16,574), selection bias from non-response is plausible, for all measures of validity. For example, ethnic minorities might be both at higher risk of being non-responders to such surveys, and giving less accurate self-reports. In this way, the non-response can make the validity measure in the sample biased, compared with the true validity measure in the population, which is called selection bias. 16 Because information was available for the responders only, there was no way to assess such bias (magnitude or sign). Any study, including randomized trials, can be affected by selection bias, either from recruitment or loss to follow-up. However, this is likely to be less of a problem with high participation rate. In this study, the participation rate was 69%, which is considered high, especially for postal surveys of this kind.
This is the first validation study of self-reported Pap smear history in the Norwegian population. The results are interpreted as confirmation of considerable recall problems in the self-report of Pap smears.
Without an organized screening programme and available register information, such recall problems have serious consequences. Self-reports will give biased estimates of the true screening rate and changes (time trends) in this rate. Even worse, telescoping makes women postpone their next Pap smear (due to underestimated time since last smear), which leads to increased risk for developing invasive disease.