
Abstract
Objectives
To improve the traditional fresh blood film method to a high-throughput analysis of the presence of circulating fluorescent red cells (fluorocytes) in erythropoietic protoporphyria (EPP) using an automated imaging system.
Methods
Based on the autofluorescence of protoporphyrin, we used an automatic image acquisition platform for examining fluorocytes in peripheral blood with minimal sample preparation. The image acquisition is easy-to-use under automated operations of excitation, focusing, detection and data analysis. Quality image and semi-quantitative fluorescence measurement of fluorocytes can be generated in a single step. For high-throughput analysis, the platform can image more than 200 96-well micro-plates, i.e. 19200 samples, in approximately 10 hours. Importantly, the reagent cost of analysis is negligible.
Results
In this pilot study, three EPP patients were diagnosed and 4000 normal individuals were screened for EPP by this method. Our results showed that the method can distinguish the overt case and asymptomatic carriers. It gives reliable evidence for rapid EPP screening.
Conclusion
This automated imaging system provides multiple advantages that improve the traditional fresh blood film method as a more effective diagnostic tool and facilitates population screening for EPP. As fluorocytes are present in the umbilical cord blood of EPP patients, this high-throughput method can be potentially used for newborn screening of EPP.
INTRODUCTION
Erythropoietic protoporphyria (EPP; MIM 177000) is an inherited disorder of porphyrin metabolism caused by ferrochelatase (FECH; E.C. 4.99.1.1) gene mutations. 1 Ferrochelatase is the terminal enzyme that catalyses ferrous iron insertion into protoporphyrin IX in the haem biosynthetic pathway. Partial deficiency of FECH activity leads to the excessive accumulation of cellular protoporphyrin in various tissues. The leakage of erythrocyte protoporphyrin into the plasma may be due to the photodamage of the binding sites between protoporphyrin and haemoglobin upon irradiation. 2 Clinically, the phototoxicity reaction of the protoporphyrin is responsible for the extremely painful skin photosensitivity in patients starting at early childhood. In <5% of the patients, the accumulation of protoporphyrin in the liver leads to liver failure and may require liver transplantation. 3
Previous studies showed that a low expression allele (IVS3-48C) of the FECH gene controls the penetrance of EPP. 4 The allele frequency is much higher in Asian populations than in European populations. For better management of the disorder, high-throughput newborn screening may be necessary in most Asian populations. An initial diagnosis of EPP can be established by the presence of fluorescent red cells (fluorocytes) in a fresh blood film viewed under ultraviolet light. 5 This image-based approach detecting protoporphyrin autofluorescence in erythrocytes is straightforward and reliable. However, skilful sample preparation is required to eliminate cell stacking. Traditionally, examination and recording the films are labour-intensive and time-consuming. We now report an automatic image acquisition platform to replace the manual method for rapid EPP diagnosis and facilitate large-scale population screening.
The fluorocytes analysis is composed of quality images and semi-quantitative fluorescence measurement performed simultaneously by IN Cell Analyzer 1000 instrumentation (GE Healthcare Bio-Sciences, Uppsala, Sweden) in a single step. This is a modular, integrated system equipped with several core components, including Nikon fluorescence microscope, quality optics, high-resolution charge-coupled device camera, laser-guided Hardware Autofocus (HWAF) system and motorized stage. Untreated whole blood samples can be examined on a single plane under automated operations of excitation and focusing. This system allows rapid examination of fluorocytes and can image more than 200 96-well micro-plates in approximately 10 hours.
MATERIALS AND METHODS
Study subjects
We examined three EPP patients and diagnoses were confirmed by mutational analysis of FECH gene. Patient 1 was a 12-year-old boy presented with hepatic dysfunction, bizarre behaviour and electrolyte disturbances. Biochemical examinations revealed marked increase in erythrocyte protoporphyrin (8213 µg/dL; normal = 20–80 µg/dL) predominantly with free protoporphyrin. Patient 2 was one of his sisters who also had greatly elevated erythrocyte protoporphyrin (3252 µg/dL). Patient 3 was a 21-year-old and presented with a typical history of skin photosensitivity and abnormally elevated erythrocyte-free protoporphyrin. We also screened 4013 stored ethylene diamine tetraacetic acid (EDTA) blood samples of healthy individuals from Hong Kong population by the automated imaging system.
Liquid-based imaging of fluorocytes
Fluorocytes analysis of EPP screening was performed using IN Cell Analyzer 1000 instrumentation (GE Healthcare Bio-Sciences, Uppsala, Sweden) fully computer-controlled with the operation software. The blood samples were protected from light exposure by aluminum foil immediately after blood collection. One hundred microlitres of whole blood samples were aliquoted and protected in the dark by the black PacKard View plates 96 (No. 6005182, PacKard). Porphyrins emit intense red fluorescence (>620 nm) upon excitation at around 400 nm. 6 The excitation filter and emission filter used were D405_20× and HQ700_75 m, respectively, together with the application of FITC/Cy5 dichoric mirror setting. The objective used was Nikon_20 × _Planfluo (20× magnifications) with focal length equals to 10,000 µm and numerical aperture equals to 0.45. Laser autofocusing was achieved under computer controls by searching ± 30 µm from HWAF-determined position with 0.5 µm as minimum stepping interval. A single HWAF offset −9.7 µm was applied to all the sample wells. The fluorescent signals were captured as live-cell images automatically by the CoolSnap HQ camera using 1300 × 1028 pixels, 12-bit and 500 ms exposure. No additional software is required for analysis.
In order to evaluate the sensitivity of the system, we diluted the whole blood samples of EPP patients to 10-fold, 100-fold and 1000-fold using 1× phosphate-buffered saline solution. In addition, we performed a titration experiment using whole blood samples from Patient 3 and a normal control in 0%, 10%, 40%, 60%, 90% and 100% collected on another day.
RESULTS
Examination of fluorocytes in erythropoietic protoporphyria patients
The automated image acquisition platform can detect the overt cases efficiently using simple fluorocyte analysis. The erythrocytes were freely suspended in the whole blood samples while the fluorocytes were detected automatically on a single plane at the bottom of the sample wells. Simultaneously, the fluorescent intensity of each fluorocyte was shown by histogram analysis when the image was generated. In order to aid visualization, the fluorocytes in the images were pseudocoloured and autocontrasted. For easy comparison, Figure 1A was contrasted manually at a higher level of fluorescence, which reduced the background signals. No fluorocyte was observed. In the histogram analysis, the normal blood sample shows a normal distribution of erythrocytes with weak fluorescence (Figure 1B). We found that there was no difference between the light-protected normal sample and the unprotected normal sample. For the patients, there are abundant numbers of fluorocytes with strong fluorescence coming out apparently from the dark background (Figure 1C and E). Distinctly different from the normal control, the patients' histograms shifted to the right and have greatly right-skewed distribution of fluorocytes, which correlate to their cellular protoporphyrin contents (Figure 1D and F). The fluorescence intensity of the fluorocytes remained stable for more than one month in the dark. With either of the nucleotide changes of FECH gene identified from the patients, all of the asymptomatic family members show similar results to the normal control (Table 1). 7 Our method helps to distinguish the overt case and asymptomatic carriers.
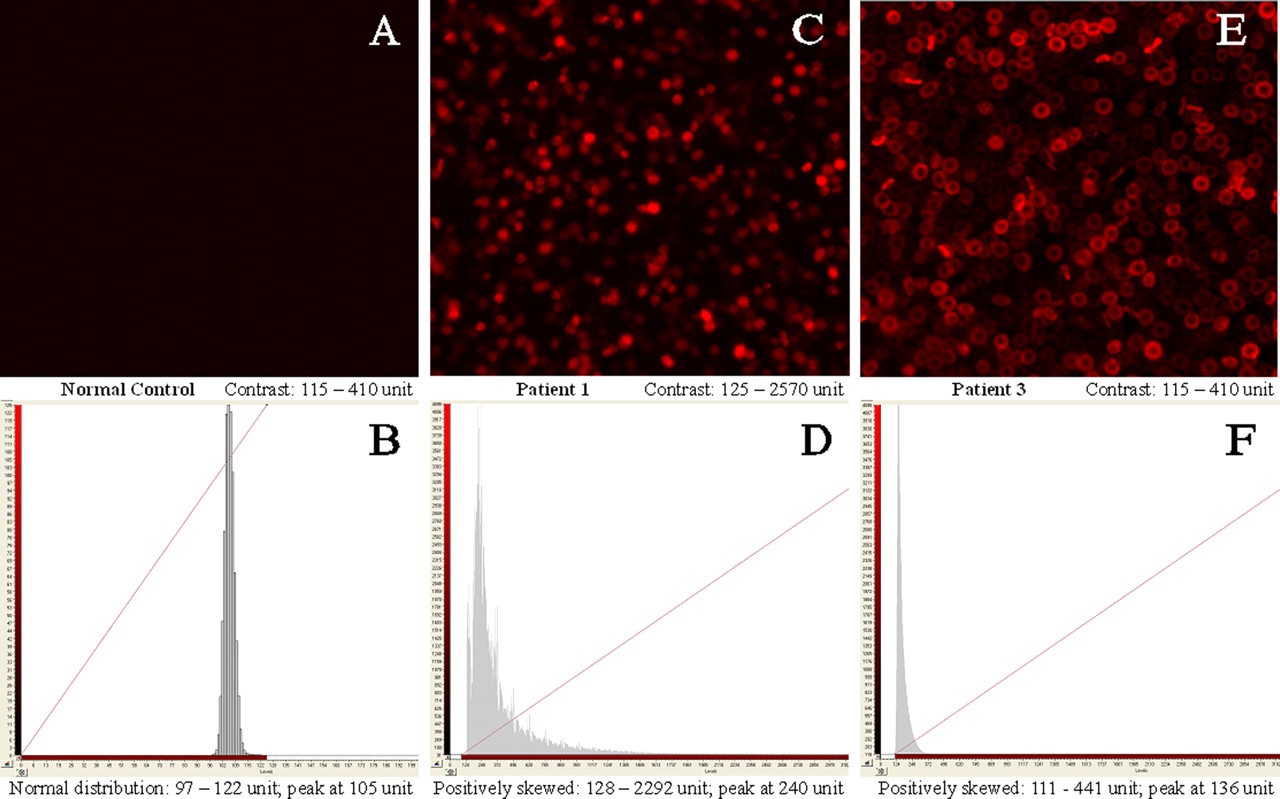
IN Cell Analyzer 1000 instrumentation provides quality images and semi-quantitative measurement of protoporphyrin fluorescence in individual erythrocyte for rapid diagnosis of erythropoietic protoporphyria. Patient 1 and Patient 2 inherited the same ferrochelatase mutations in the same family and have similar distribution patterns of fluorocytes. So, only the results of Patient 1 are shown here. Upper panel: images were acquired for 1000-fold phosphate-buffered saline diluted whole blood samples and were pseudocoloured. Fluorocytes in (C) have spherical appearance while fluorocytes in (E) have typical biconcave shape of red cell. The fluorescence intensity of Patient 1's fluorocytes may be too high to mask their biconcave shapes and prolonged storage of the sample at low temperature may lead to shrinkage of the cells. Lower panel: histograms presented with different levels of fluorescence (x-axis), (B) = 0–200 U, (D) and (F) = 0–3100 U, which displayed the whole population of fluorocytes for each sample
Semi-quantitative measurement of fluorescence from histogram analysis
The fluorescent measurement was presents as unit level of fluorescence signal
*One hundred samples were selected randomly from the 3902 individuals for calculations. IIA-1, IIA-3 and IIB-3 were trans co-inherited a deleterious mutation on the maternal allele and the low expression allele IVS3-48C on the paternal allele
Population screening of erythropoietic protoporphyria in Hong Kong population
For population screening of fluorocytes, we screened the stored EDTA blood samples of 4013 healthy subjects. In Figure 2, each image of the image thumbnail represented a single sample and was autocontrasted independently. Most of the samples gave reddish images indicating that they contain weak fluorescent erythrocytes near the background signals. Most of these samples have normally distributed fluorocytes similar to the normal control (data not shown). There are totally 111 samples (2.77%) having mildly right-skewed distribution of fluorocytes, 99 ± 2 U (mean ± SD fluorescence level) to 141 ± 13 U with peak at 107 ± 2 U. With the 111 samples excluded from calculation, the semi-quantitative measurement of fluorescence is 98 ± 2 U to 122 ± 4 U with peak at 105 ± 2 U in average. In the family screening of Patient 1 and Patient 2, both the mother and brother having erythrocyte protoporphyrin slightly higher than the normal range (112 µg/dL and 82 µg/dL, respectively) also have fluorocytes distribution resembling the 111 samples in particular. These people may have a minority of erythrocytes containing slightly increased cellular protoporphyrin. The slightly increased erythrocyte protoporphyrin is not significant clinically as shown in asymptomatic IA-2 and IIA-2 as protoporphyrin accumulation may occur occasionally. 8 No EPP case was detected in the stored blood samples, which is consistent with the health status of the people tested.
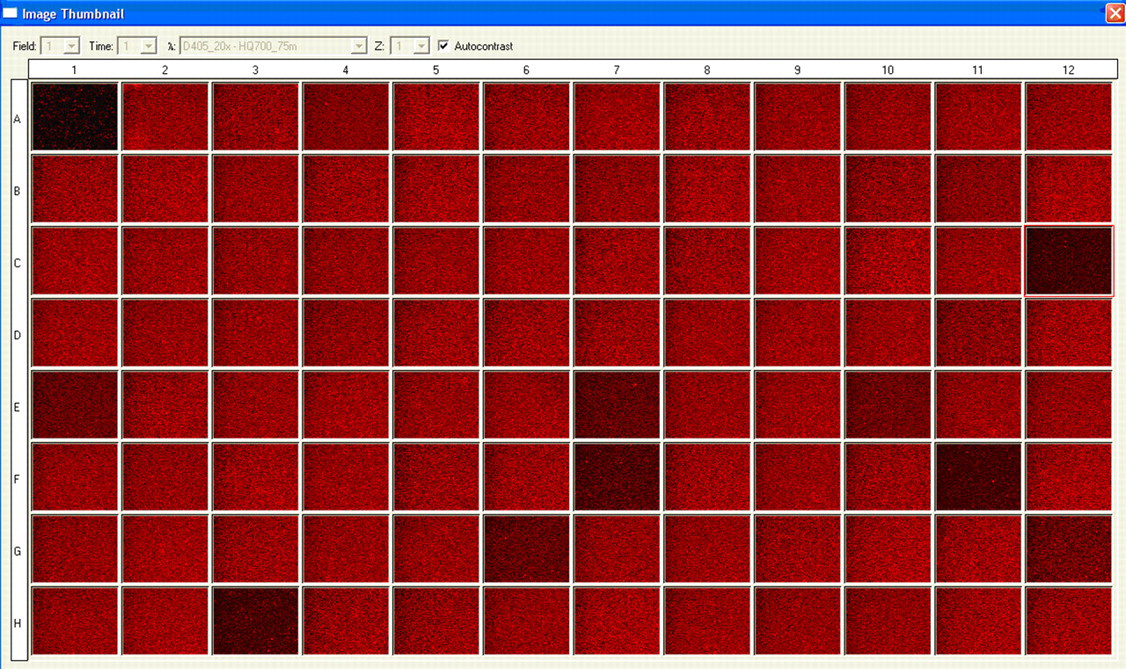
Liquid-based fluorocytes analysis of Hong Kong Chinese population using 96-well-plate approach. The acquired parameters are described previously. Each image of the image thumbnail was autocontrasted independently and pseudocoloured. Partial results of 4013 stored ethylene diamine tetraacetic acid whole blood samples are shown here. Sample well A1 was Patient 3 whole blood sample used as positive control
From the titration experiment, the histograms of mixed samples containing 90%, 60% and 40% of EPP samples were similar to that of 100% EPP sample, 134 ± 8 U to 868 ± 42 U with peak at 190 ± 7 U of fluorescence. In the mixture of 10% EPP sample, the histogram shifted to left but the right-skewed pattern remained; 102 ± 0 U to 311 ± 1 U with peak at 112 ± 0 U of fluorescence.
DISCUSSION
This is the first report that applies liquid-based automatic image acquisition for rapid EPP diagnosis. IN Cell Analyzer 1000 instrumentation provides a highly automatic platform to perform simple fluorocytes analysis efficiently from live cells in liquid medium. Both the fluorocyte images and histogram analysis provide definitive results as reliable as previously used fresh blood film method for EPP screening. In previous studies, the distribution of protoporphyrin fluorescence emitted from individual erythrocytes was determined by either flow cytometric analysis or by image-based cytometric study. 6,9,10 However, the former method requires a considerably greater number of cells per unit time while the latter method relies on skilful preparation of dispersed and immobilized red cells. Using the automatic platform, we combined the benefits of image-based approaches and quantitative analysis for EPP diagnosis. 5,6,9,10
Our method has several advantages to improve the traditional approaches. First, it provides permanent records of each erythrocyte for subsequent examination. Secondly, it is a liquid-based platform which acquires live cell images efficiently without specific sample preparation. It also saves time and efforts on focusing management by laser autofocusing feature. In addition, a 1000-fold dilution of patient whole blood sample is enough to obtain similar results from flow cytometric analysis, which counted 20,000 cells of 10-fold diluted samples (data not shown). Besides, the titration experiment showed that fluorocytes can still reliably be detected in a mixture containing 10% EPP sample with strong fluorescence reaching 311 U. Our method has higher sensitivity with lower background signals than the traditional approaches because of the closed environment of the instrumentation. It is convenient to examine each sample comprehensively by simply adjusting the acquisition setting to increase the number of field to be taken from each well. When using the 96-well plate approach, it becomes a high-throughput method with about 20 minutes run per each plate in our study. The automated operations of image acquisition and semi-quantitative fluorescence measurement facilitate high-speed diagnosis and population screening of EPP.
The fluorescent intensity depends on the amount of protoporphyrin present in the red cells at the time it enters circulation. 10–12 The half-life of protoporphyrin in the red cells is 12–14 days and decreases approximately logarithmically with cell age. The three EPP patients showed abundant numbers of fluorocytes with strong fluorescence and had broad spectrum of unevenly distributed fluorocytes. There should be a great variety in protoporphyrin contents retained in the red cells of different cell age. Those small portions of fluorocytes having higher fluorescent intensities may be circulating reticulocytes and young erythrocytes. Nevertheless, protoporphyrin accumulation may occur occasionally and presence of some visible fluorocytes in normal individuals is common. 8 We found that 2.77% of our local population may have slightly increased erythrocyte protoporphyin, but which may correlate with the presence of the low expression allele or iron deficiency. In the future, it is better to include positive controls of iron-deficient samples and lead-intoxicated samples.
For the low expression allele, it varies widely in prevalence in different ethnic groups from Japanese (40%) to the southeast Asian (31%), white French (11%) and British (10%) populations. 4,6,13 These differences can influence the prevalence of EPP in these populations. From our previous study, we have 28% allele frequency of IVS3-48C polymorphism in Hong Kong population. 7 With such a high population frequency, we suggest that it may be feasible to conduct newborn screening of EPP in Hong Kong using our method, which is easy-to-use and high-throughput. As fluorocytes may be detected in the umbilical cord blood of affected infants, we hope the availability of such a newborn screening in early postnatal period can help to prevent unnecessary protoporphyrin photodamage, especially during phototherapy for neonatal jaundice. 14
Footnotes
ACKNOWLEDGEMENT
We thank Ms T.Y. Law for helpful technical assistance.