
Abstract
Objectives
Antenatal screening for Down's syndrome relies on the use of multiple markers in combination. Markers that are highly correlated can cause statistical instability. We used the maximum variance inflation factor (VIFmax) to determine whether a screening test using multiple markers was robust to imprecision in the estimation of the marker distribution parameters.
Methods
The VIFmax for a specified screening test was calculated from the correlations between markers in Down's syndrome pregnancies for six tests: integrated and serum integrated tests without repeat measurements, both tests with repeat measurements across trimesters analysed in the standard way, and both tests with repeat measurements analysed as cross-trimester (CT) marker ratios. The screening performance of each test using published parameter values, in terms of the false-negative rates for a 3% false-positive rate (FN3), were calculated for simulated populations with medians 0.2 standard deviations (SD) higher or lower than the published values (to reflect imprecision in parameter estimation) for pregnancy-associated plasma protein A and unconjugated oestriol in affected pregnancies. For each test, the VIFmax value was compared with the coefficient of variation of the FN3 (FN3 CV). An independent set of 27 Down's syndrome pregnancies was used to determine how many had meaningless low risks (<1 in 10,000) with each test.
Results
Tests with VIFmax values greater than 5 had FN3CV values over 50%, but those with VIFmax values less than 5 had FN3 CV values less than 21%. The numbers of Down's syndrome pregnancies with meaningless low risk estimates in the independent set were 18 (64%) in tests with VIFmax values ≥5 and none for those with values <5.
Conclusion
VIFmax values of 5 or more suggest instability. The tests using CT marker ratios were stable (VIFmax < 3), but the tests using repeat measurements in the standard manner were not (VIFmax > 5).
INTRODUCTION
A screening test needs to be robust to imprecision in the estimation of the distribution parameters (for example, medians and standard deviations) of its screening markers in affected and unaffected individuals. In antenatal screening for Down's syndrome, the parameters for affected pregnancies are most susceptible to imprecision as a result of random error from sampling variations due to the relatively small numbers of affected pregnancies.
It has been shown that the use of highly correlated screening markers (for example those with correlation coefficients above +0.7 or below −0.7) in antenatal screening for Down's syndrome can increase screening performance. 1–3 While this is theoretically true, in practice, the use of these markers in the standard algorithm can grossly underestimate the risk in affected pregnancies such that the risk estimates are effectively meaningless (for example, risks in affected pregnancies that are less than 1 in 10,000). 4 Hereafter we refer to this as ‘meaningless low risk’. This is likely to arise because highly correlated markers may cause the test to become very sensitive to imprecision in the estimation of the distribution parameters of the markers that comprise the screening test. There is therefore a need to test a particular model for its intrinsic robustness. This was not previously an issue, because different markers used in screening tests were generally not highly correlated.
Our aim was to assess the robustness of two methods of using marker levels in the first and second trimesters of pregnancy as part of the integrated and serum integrated screening tests for Down's syndrome. The two methods are: (a) Repeat measures method: the values of the markers in both trimesters are highly correlated and each treated as markers in the standard way 5 and (b) Cross-trimester (CT) marker ratio method: the values of the markers in one trimester plus the ratio of the values of the markers in both trimesters are less correlated and such ratios are treated as markers. 4
METHODS
We adopted the following approach to assess the robustness of a screening test.
Parameter values from a published study were taken as the ones which would be used in practice recognizing that these would necessarily be imprecise.
Hypothetical populations of affected pregnancies and hypothetical populations of unaffected pregnancies were generated based on all the published parameter values except for the median values of two of the markers which were increased or decreased by a small amount in affected pregnancies.
Given that the hypothetical populations were regarded as ‘true’, we then applied the screening test, based on the published parameters, to estimate the false-negative rate (FN) for a given false-positive rate for each hypothetical population.
We examined the variation in these FN across the different hypothetical populations. The smaller the variation in FN, the more robust the test was to shifts in the median values.
We separately examined the robustness of the tests to other shifts using the above methodology by altering the values of the SD of two of the markers instead.
We considered the integrated and serum integrated tests. The integrated test consisted of measuring pregnancy-associated plasma protein A (PAPP-A) and nuchal translucency (NT, an ultrasound marker) in the first trimester, and alpha-fetoprotein (AFP), unconjugated oestriol (uE3), total human chorionic gonadotrophin (hCG) and inhibin-A in the second trimester. The serum integrated test omits the NT measurement. We also considered the integrated and serum integrated tests with added measurements of PAPP-A, uE3, total hCG and inhibin-A measured in the other trimester, included in the model as either individual markers in the standard algorithm (repeat measures method) or as CT marker ratios (the CT marker ratio method). AFP was not measured in the first trimester as an earlier study 4 demonstrated that its addition did not materially improve the screening performance. Other tests were investigated but the results were not reported in detail: integrated and serum integrated tests with (a) PAPP-A measured in both trimesters, (b) PAPP-A and uE3 measured in both trimesters and (c) PAPP-A, uE3 and total hCG measured in both trimesters.
In estimating screening performance, we used the medians, SD and correlation coefficients (both within and between trimesters) that specify the multivariate Gaussian distributions of screening markers in Down's syndrome and unaffected pregnancies and the truncation limits from the serum urine and ultrasound screening study (SURUSS) report. 4,6–9
Each test, based on the SURUSS parameter values, was applied to simulated populations of 100,000 affected and 100,000 unaffected pregnancies with medians for PAPP-A and uE3 in affected pregnancies that were either 0.2 SD higher or 0.2 SD lower than their SURUSS values (Table 1). PAPP-A and uE3 were identified as the two markers most likely to affect the robustness of the tests as they are the most highly correlated markers across both trimesters and are also correlated with each other. The shift of the median of each marker was determined in terms of that marker's SD in order to make it a fair comparison between tests. A shift of 0.2 SD was chosen as SURUSS has approximately 100 affected pregnancies and therefore a shift of 0.2 SD is roughly equivalent to 2 standard errors (SE) from the median (SE = SD/√100) in other words we are shifting the medians to the values of their upper and lower 95% confidence intervals. A similar pattern of results would be expected with any other magnitude of shift.
SURUSS distribution parameters in Down's syndrome pregnancies for uE3 and PAPP-A (first and second trimesters and CT ratios) and values if the ‘true’ median values were 0.2 SD lower or higher than SURUSS
First trimester measurements at 11 completed weeks
PAPP-A, pregnancy-associated plasma protein A; uE3, unconjugated oestriol; CT, cross-trimester; SD, standard deviation
SD for scan dated and weight adjusted pregnancies
For each test, the FN for a 3% false-positive rate (FN3) was calculated for each of the simulated populations using standard methodology given in detail in the SURUSS report. 6 For each test the, coefficient of variation (CV) of the FN3 (FN3CV) values was then calculated (CV = the SD of the FN3 values divided by the mean of the FN3 values expressed as a percentage). A low FN3CV suggests that a test is robust to changes in the median values of the parameters, while a high FN3CV suggests that a test is not robust to such changes. Adopting different screening performances, for example FN1 instead of FN3 or changing the median shift to 0.1 SD will alter the CVs, but it will not alter the relative order of the tests, i.e. tests with a high FN1CV will still have a high FN3CV compared with other tests. For the integrated and serum integrated tests without repeat measurements the FN3CV is based on only four simulated populations; however, similar FN3CV values were obtained when greater numbers of simulated populations were examined.
The FN for a given false-positive rate is the complement of the detection rate for the same false-positive rate. So for example FN3 (FN for a 3% FPR) = 100–DR3 (the detection rate for a 3% FPR). We use FN3 instead of DR3 because as detection rates become close to 100% the relative differences in DR3 values become insensitive to differences in screening performance. For example for a false-positive rate of 3% detection rates of 97%, 98% and 99% do not appear to vary much compared with false-negative rates of 3%, 2% and 1% which vary threefold. The CV values reflect this, with the DR3CV being 0.7% and the FN3CV being 47%.
The variance inflation factor (VIF) is used in the analysis of multivariate data (for example in multiple regression) as a method of determining when estimates of the statistical coefficients in the model (for example the regression coefficients) are unstable; that is, the estimated coefficients have very large SE and a small amount of additional data on the variables are likely to cause the coefficients to change considerably. 10 In a test with n markers, there are n VIFs, one for each marker. The VIF is a measure of the dependence a marker has on all the other markers in the test; a high VIF indicates that the marker is highly correlated with the other markers and the test is therefore unstable. In general the largest VIF of all the markers in the test (maximum variance inflation factor, VIFmax) is used to indicate the stability of the test and values above 5 or 10 are judged to indicate an unstable model. 10
The VIFmax was calculated for each of the tests using the correlation coefficients in Down's syndrome pregnancies of the markers used in that test.(The VIFs are in fact the diagonal terms of the inverted correlation matrix for Down's syndrome pregnancies of all the markers used in the model – see Appendix for details). The FN3 CVs were compared with the corresponding VIFmax values for the tests.
To validate our assessment of whether a screening test was robust, we used an independent set of 27 Down's syndrome pregnancies that had complete data on all markers in the first and second trimesters and an NT value. For each screening test, we estimated the risk of being affected for each of the 27 cases and counted the number of cases that were given meaningless low risks of <1 in 10,000.
RESULTS
Table 2 shows the FN3 values of the integrated test for the four simulated populations in which the medians of first trimester PAPP-A and second trimester uE3 in affected pregnancies are each shifted by ±0.2 SD in only one trimester. The FN3 values varied from 6.6% to 9.3%, with an FN3 CV of 14%. The VIFmax value for the integrated test without repeat measurements, calculated from the correlations in affected pregnancies was 1.4.
Integrated test without repeat measurements: false-negative rate for a 3% false-positive rate (FN3) for each simulated population for the test based on the SURUSS parameters applied to populations with median PAPP-A and uE3 values in Down's syndrome pregnancies shifted by ±0.2 standard deviations (SD) relative to those specified in SURUSS. The coefficient of variation of the FN3 estimates (FN3CV) is shown together with the maximum variance inflation factor (VIFmax) for the test
PAPP-A, pregnancy-associated plasma protein A; uE3, unconjugated oestriol; SURUSS, serum urine and ultrasound screening study
*CV, coefficient of variation (the SD of the FN3 values divided by the mean of the FN3 values expressed as a percentage)
Table 3 shows the FN3 values of the integrated test for the 16 simulated populations in which the median CT marker ratios for PAPP-A, uE3, hCG and inhibin-A are included in the test and the median values of PAPP-A, uE3 and PAPP-A, and uE3 CT ratios are shifted by ±0.2 SD. The FN3 values varied from 2.7% to 5.7%, with an FN3CV of 21%. The VIFmax value for the integrated test with CT marker ratios, calculated from the correlations in affected pregnancies, was 3.0.
Integrated test with cross-trimester (CT) marker ratios of PAPP-A, uE3, total hCG and inhibin-A: false-negative rate for a 3% false-positive rate (FN3) for each simulated population for the test based on the SURUSS parameters applied to populations with median PAPP-A, uE3 and their CT marker ratio values in Down's syndrome pregnancies shifted by ±0.2 standard deviations (SD). The coefficient of variation of the FN3 estimates (FN3CV) is shown together with the maximum variance inflation factor (VIFmax) for the test
PAPP-A, pregnancy-associated plasma protein A; uE3, unconjugated oestriol; SURUSS, serum urine and ultrasound screening study
*CV, coefficient of variation (the SD of the FN3 values divided by the mean of the FN3 values expressed as a percentage)
Table 4 shows similar results to Table 3, with the median values of PAPP-A and uE3 in both trimesters being shifted by ±0.2 SD and the repeat measures method being used. The FN3 values varied from 2.4% to 37.8%, with an FN3CV of 112%. The VIFmax value for the integrated test with repeat measurements, calculated from the correlations in affected pregnancies, was 93.7.
Integrated test with repeat measures of PAPP-A, uE3, total hCG and inhibin-A: false-negative rate for a 3% false-positive rate (FN3) for each simulated population for the test based on the SURUSS parameters applied to populations with median PAPP-A and uE3 values in both trimesters in Down's syndrome pregnancies shifted by ±0.2 standard deviations (SD). The coefficient of variation of the FN3 estimates (FN3CV) is shown together with the maximum variance inflation factor (VIFmax) for the test
uE3, unconjugated oestriol; PAPP-A, pregnancy-associated plasma protein A; SURUSS, serum urine and ultrasound screening study
*CV, Coefficient of variation (the SD of the FN3 values divided by the mean of the FN3 values expressed as a percentage)
The first two columns of the upper portion of Table 5 summarize the results from the previous three tables and from the serum integrated test (not previously shown). The third column indicates the performance of these tests on the independent set of 27 Down's syndrome pregnancies. The table shows that a high FN3CV corresponds to a high VIFmax. For the integrated test, the repeat measures had a VIFmax value of 93.7, and 18 of the 27 affected pregnancies had meaningless risks of less than 1 in 10,000. For the serum integrated test, the repeat measures methods again had a high VIFmax (57.9) and a similar proportion of affected pregnancies had meaningless low risk estimates (17/27 with risk less than 1 in 10,000).
FN3CV and VIFmax and numbers of affected pregnancies in the validation data set of 27 Down's syndrome pregnancies with risks <1 in 10,000 according to the test performed, whether markers were measured twice and the method used to calculate risk
FN3, 3% false-positive rate; FN3 CV, coefficient of variation of the FN3; VIFmax, variance inflation factor; CT, cross-trimester
*Combinations of markers in the tests are the same as those for the integrated tests except that NT is not measured
Figure 1 shows the association of the FN3 CV with the log of VIFmax for several different tests. The FN3 CV increases continuously with increasing VIFmax values over 5. Textbooks (for example, Montgomery and Peck 10 ) suggest that tests with VIFmax values greater than either 5 or 10 are unstable. This, combined with the results from Figure 1 suggest that tests with a VIFmax greater than 5 are likely to be insufficiently robust to imprecision of the distribution parameters.
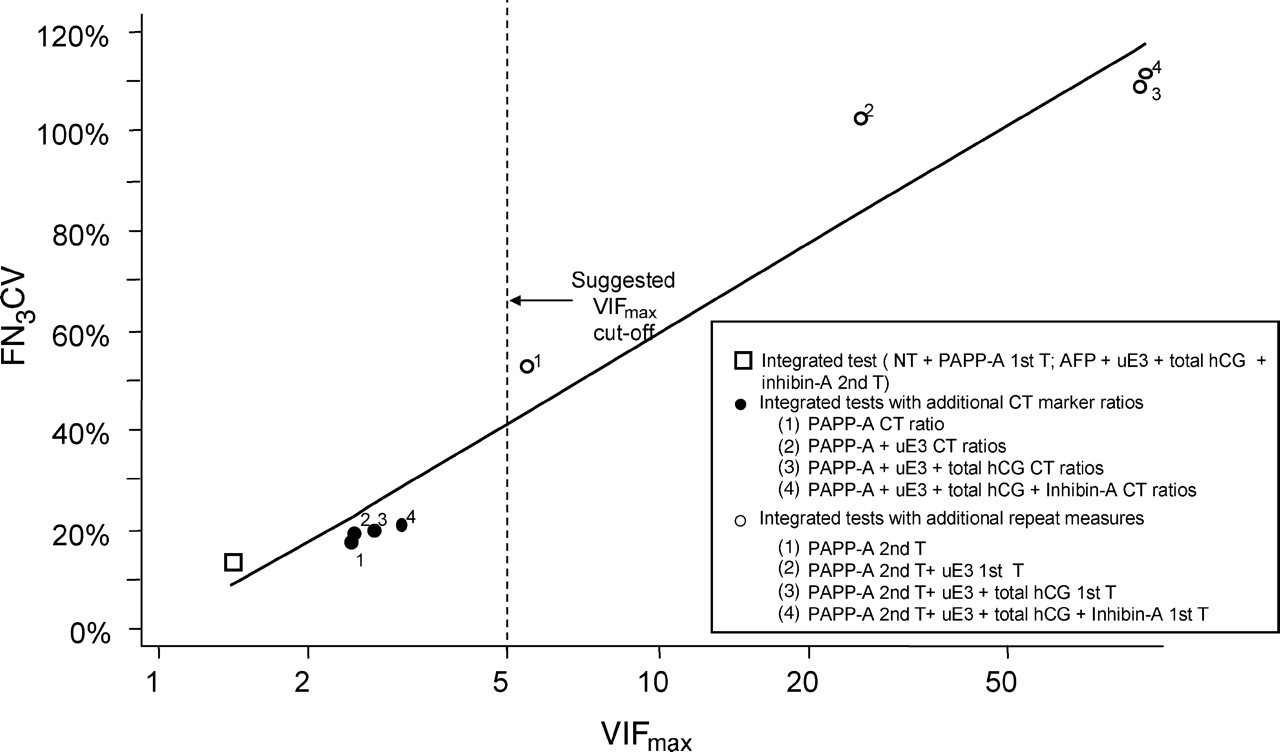
Coefficient of variation of FN for 3% false-positive rate (FN3CV) plotted against the maximum variance inflation factor (VIFmax) for Down's syndrome screening test based on the integrated test. NT, nuchal translucency; PAPP-A, pregnancy-associated plasma protein A; AFP, alpha-fetoprotein; uE3, unconjugated oestriol; hCG, human chorionic gonadotrophin; CT, cross-trimester
DISCUSSION
The use of PAPP-A, uE3, total hCG and inhibin-A measured in both trimesters with the CT marker ratio method both increases the performance of the integrated test and is substantially more robust than the repeat measures method. The FN for a 3% FPR decreases from 7.9% for the integrated test to 3.7% for the integrated test with the additional four CT marker ratios. Alternatively, the false-positive rate decreases from 2.0% to 0.3% for a 10% FN.
We calculated VIFmax for three combinations of markers suggested by Wright and Bradbury 3 using the repeat measures method, namely (a) PAPP-A and uE3 in both trimesters; (b) PAPP-A and uE3 in both trimesters and NT and (c) PAPP-A, uE3 and inhibin-A in both trimesters. These tests had relatively high FN3CV values of 73%, 159% and 106% respectively with corresponding VIFmax values of 4.9, 5.4 and 8.4. The VIFmax values for marker combination (a) is close to the suggested VIFmax cut-off of 5 and combinations (b) and (c) exceed it. The numbers of affected pregnancies with meaningless low risks were 4, 6, and 10, respectively for the three specified marker combinations.
In 1995 and in 2001, Hackshaw et al. 1,2 examined the use of repeated measurements of AFP, uE3, hCG (free β-hCG or total hCG) and inhibin-A in the second trimester in a repeat measures model and showed an improvement in screening performance; they estimated that the decrease in FN for a 5% false-positive rate was about 4 percentage points and concluded that it was probably not worthwhile given the need to collect a second sample. They did not investigate the stability of the method. We calculated the VIFmax for the model suggested. It had a VIFmax of 35 and would therefore not have been judged robust.
Palomaki et al. 11 used the repeat measures method of the serum integrated test with values of PAPP-A only repeated in both trimesters on a sample of 32 Down's syndrome pregnancies. They found that no affected pregnancies in their sample had meaningless low risks. Applying this model, we also found that no affected pregnancies in our independent set had meaningless low risks. The VIFmax value for this test is 5.4 with an FN3CV of 53, indicating that VIFmax of 5 is likely to be a reasonable cut-off level.
If a test involves 10 markers, then there will be 45 correlation coefficients. While one or two of these might be high, (say 0.85 or higher) this in itself is insufficient to indicate whether the overall test is robust or not. One or two such high correlations would not necessarily invalidate the test. Similarly, there may be none of the correlation coefficients greater than say 0.85, but the test could still be unstable. The measure of the robustness of the test needs to use one single statistic that assesses the overall correlations collectively, in this example, all 45 together, and that is what the VIFmax does.
In Table 4, some of the estimates of FN3 may appear to be outliers that should be censored. However, extreme values such as those in table 4 are not unexpected, and illustrate the instability of the model. Such extreme results will tend to occur if by chance, a first trimester median is underestimated and the second trimester median is over estimated, or vice versa when first and second trimester values of that marker are strongly positively correlated.
In theory, the CT marker ratio method and the repeat measures method are mathematically equivalent on a log scale, because one set of parameter estimates can theoretically be derived from the other set. For example, if the median of a marker in the first trimester (log(m1)) and in the second trimester (log(m2)) are known, then the median of the CT marker ratio is log(m1)/log(m2) = log(m1 – m2). However, in practice the two sets of parameter estimates will not be equivalent 4 due to adjustments made to the parameters derived from the data, including the removal of outliers, the setting of truncation limits, the adjustments for gestational age and the use of data from other published studies, all of which are useful in producing more accurate estimates of the medians, SD and correlation coefficients of the markers. Consequently, estimating a median CT marker ratio with these adjustments will not necessarily be equal to log(m1)/log(m2). The estimated FN3 without any shift in medians was 2.8% for the integrated test with repeat measurements and 3.7% for the integrated test with CT marker ratios. Comparison of these estimates is, however, unhelpful because without data adjustment to improve accuracy they should be the same.
In this paper, we present data showing limited shifts (ie errors) to the estimates of only the medians of two markers (PAPP-A and uE3). PAPP-A and uE3 were chosen as they were the markers likely to give more extreme results as values of each in the first and second trimester were highly correlated. We assumed that the shifts were due to random errors and would therefore not be expected to have the same correlation structures of the true markers. In other words although, for example, PAPP-A is highly correlated across both trimesters we assumed that the errors could be of the form +0.2 SD in one trimester and -0.2 SD in the other trimester.
We also investigated the effect of modelling errors in the estimation of the SD and the correlations between these two markers (not reported here). The FN3CV values were much higher for tests with high VIFmax values when deviations in these parameters were considered.
Tests with a high VIFmax are likely to be more sensitive to deviations of the data from the Gaussian distributions than tests with a lower VIFmax, reinforcing the significance of using tests with a low VIFmax. Univariate truncation limits can only be used with tests based on markers that are not highly correlated. If two or more markers are highly correlated, then multivariate truncation limits (an extension of the bivariate truncation limits described by Palomaki et al. 11 ) would need to be used and this is not methodologically straightforward. The presence of just one outlying marker value could mean all marker values for that pregnancy would be altered to the multivariate truncation limit, which could result in a large proportion of affected pregnancies having truncated values. In some of the tests considered, over 50% of the affected pregnancies in the validation set would need to be truncated in this way; on general grounds, it does not seem desirable to use a method that requires such a large proportion of observed data to be altered.
With the introduction of the greater number of screening markers in antenatal screening for Down's syndrome, particularly when these are necessarily highly correlated because they may include the same markers measured at different times in pregnancy, it is of considerable importance that people developing screening tests assess the stability of their screening model, and this paper describes a way to do this in a simple manner. The VIFmax value is a recognized numerical measure of statistical robustness. It is simple to calculate requiring only the matrix of correlations of markers in affected pregnancies. A VIFmax value greater than 5 is an indication of the risk of statistical instability. In essence, we propose a mathematical ‘screening test’ to assess the validity of potential new Down's syndrome screening tests involving multiple markers.
Footnotes
ACKNOWLEDGEMENTS
We thank Jack Canick, Allan Hackshaw, Alicja Rudnicka, Glenn Palomaki and Mark Simmonds for their comments on earlier versions of the manuscript.