
Abstract
Introduction
Objectives When evaluating screening for the early detection of cancer, it is important to estimate both harms and benefits. One common harm is a false-positive (FP), which is a positive screening result, perhaps followed by an invasive test, with no cancer detected on the diagnostic work-up or within a specified time period. An important goal is to estimate the risk of at least one FP, which we call the cumulative risk of an FP, if persons took a regimen of various screening tests, as is commonly recommended. The estimation is complicated because the data come from a study in which subjects are offered various screening tests in rounds with some missing tests in most subjects. Previous methods for estimating cumulative risk of FPs with a single type of test are not directly applicable, so a new approach was developed.
Methods
The tests were ordered by appearance, where the last test was either the first FP (analogous to a failure time) or the last test taken with no FPs having occurred on that test or previously (analogous to a censoring time). We applied a Kaplan-Meier approach for survival analysis with the innovation that the hazard for a first FP for a given test depends on the type of test and number of previous tests of that type which were taken.
Results
The method is illustrated with data from the screening arm of the randomized Prostate, Lung, Colorectal and Ovarian (PLCO) Cancer Screening Trial. With an FP defined as a diagnostic work-up in the absence of cancer (or advanced adenoma) within three years, the probability of at least one FP among 14 tests in men was 60.5% with 95% confidence interval of (59.3%, 61.6%).
Conclusion
A simple estimate is proposed for the probability of at least one FP if persons took a regimen of multiple screening tests of different types. The methodology is useful for summarizing the burden of multiphasic screening programmes.
Background
Methods have been developed to estimate the risk of at least one FP in a regimen of a single type of screening test.1–5 There are two ways to directly apply methods for a single screening modality to multiple types of tests. One way is to separately model the FP rate for each type of test. However, this approach assumes independence of FP rates among different types of tests, which is not likely to hold for two tests for the same cancer (such as digital rectal exam [DRE] and prostate-specific antigen [PSA] for early detection of prostate cancer) or when a single risk factor (e.g. smoking) predisposes to FP tests for more than one cancer. A second approach is to list all tests (regardless of type) by order of appearance in each subject and invoke the methodology for a single type of test. 6 The problem is that, because of the missing data, a particular ‘test’ is a composite of different types of tests, which complicates the interpretation of assumptions and results.
We propose a novel approach that avoids the aforementioned difficulties by treating the type of test and the number of previous tests of that type as a time-varying covariate in a survival framework. A related survival approach that uses the type of test and testing round as a time-varying covariate was applied in a companion paper, 6 but without statistical justification.
Methods
We describe the method in terms of the ongoing Prostate, Lung, Colorectal and Ovarian (PLCO) Cancer Screening Trial, which randomized 154,935 persons aged 55-74 between 1993 and 2001. Our goal was to estimate the probability of at least one FP in 14 tests for men if no tests were missing. The data available for our analysis consisted of screens at rounds (yearly clinical visits) 0, 1, 2, 3, which correspond to years since randomization among 38,349 men 6 in the screening arm of the trial. Four screening tests were offered to men in the trial: PSA and DRE for early detection of prostate cancer, postero-anterior view of chest X-rays for early detection of lung cancer and 60-cm flexible sigmoidoscopy (FSG) for early detection of colorectal cancer. For PSA, X-ray and DRE screening, we defined an FP as a positive test (i.e. suspicious for cancer) and no cancer detected within three years. For FSG screening, we defined an FP as a positive test and no advanced adenoma (namely no adenoma greater than or equal to 1 cm, no severe dysplasia and no villous components) detected within three years. (In the definition of FP used here, some subjects with an FP had an invasive work-up and others did not.)
Prostate, lung, colorectal and ovarian data for false-positive (FP) rate in men
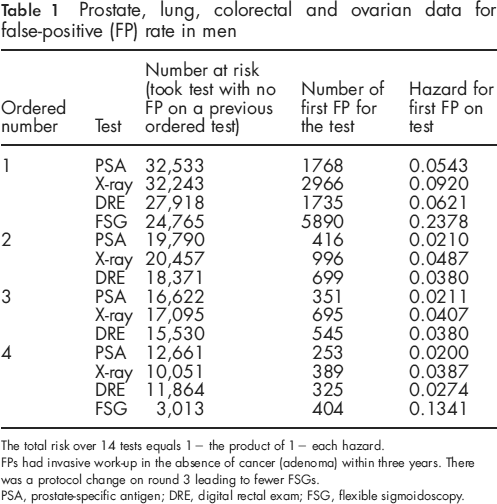
The total risk over 14 tests equals 1 - the product of 1 - each hazard.
FPs had invasive work-up in the absence of cancer (adenoma) within three years. There was a protocol change on round 3 leading to fewer FSGs.
PSA, prostate-specific antigen; DRE, digital rectal exam; FSG, flexible sigmoidoscopy.
Most subjects were missing various tests, with some missingness because of changes in protocol. During the trial, the second FSG screening was changed from round 3 to round 5 owing to changes in common practice and guidelines. This meant that fewer subjects received FSG on round 3 than originally anticipated.
It is convenient to describe the analysis method using hypothetical data in Table 2. Table 2a depicts the hypothetical data of four people who enter the screening programme. The first step in the analysis was to treat any test result after a first FP as censored (Table 2b). The second step, at least conceptually, was to list the tests taken in the order of appearance until the first FP (Table 2c). The last test in the ordering was either the first FP (analogous to a failure time) or the last test taken with no FPs having occurred on that test or previously (analogous to a censoring time). The key to our method is to treat the test type and the number of previous tests of that type that were taken as a ‘time-varying’ covariate. We then made two assumptions:
Assumption 1
The probability of an FP on a given test conditional on no FPs in any of the previous tests (regardless of type) depends only on the type of test (PSA, DRE, X-ray or FSG) and the number of previous tests of that type that were taken.
Assumption 2
The probability a test is censored can depend on the number and the type of previous tests taken, but not on any information about the censored tests.
Under Assumption 1, the quantity of interest is the hazard $TH rt , which is the probability that a subject has a first FP (among all tests regardless of the type) on the r-th test of type t.
The third step in our analytical method was estimation of the hazard. As derived in Appendix A, under Assumptions 1 and 2 (the latter analogous to non-informative censoring), the maximum likelihood estimate of the hazard is
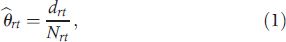
drt = number of subjects who were a first FP on the r-th type t test.
Estimation of the hazard in Equation (1) is easily accomplished by taking the modified raw data in Table 2b and ‘shifting’ the data for each type of test to the left, according to Table 2c, which fills in some of the missing entries. This gives Table 2d. In Table 2d the estimated hazard for each column, corresponding to a particular type of test and its ordered occurrence, equals the number of FP's in the column divided by the number of non-missing values in the column.
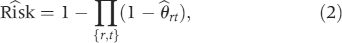
The last step was to compute the estimated risk of at least one FP, called the cumulative risk of an FP, for the scheduled regimen of screenings. The estimated cumulative risk of an FP equals one minus the estimated risk of no FPs,
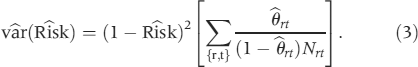
The asymptotic 95% CI is Rîsk + 1.96 √ Vâr(Rîsk).
Hypothetical example of data analysis
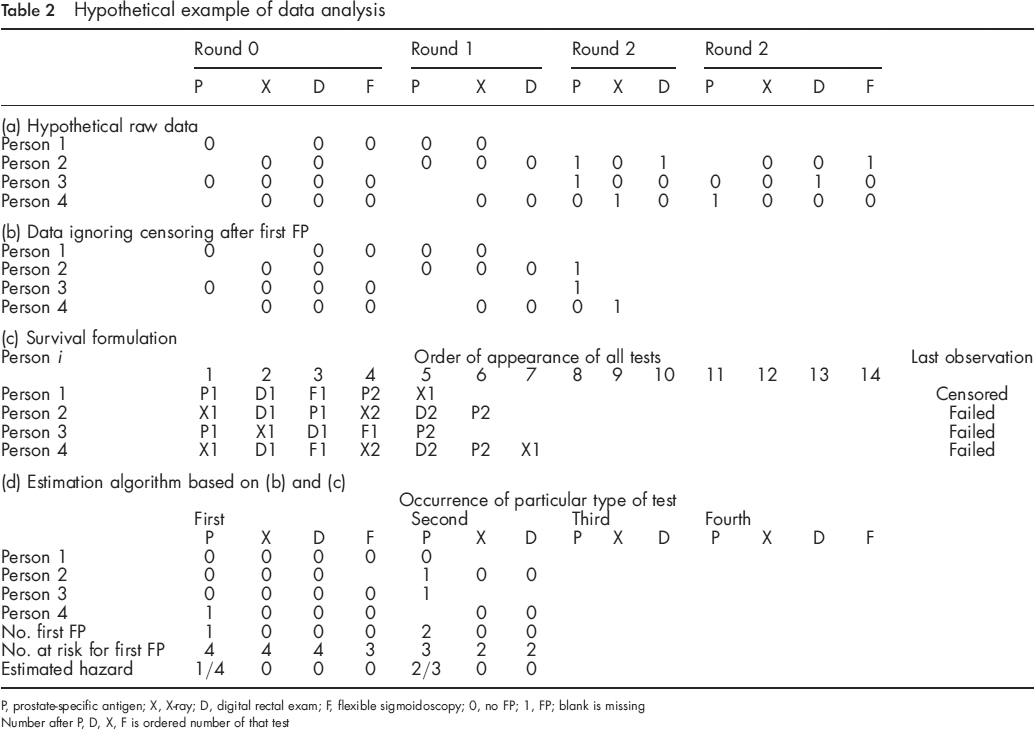
P, prostate-specific antigen; X, X-ray; D, digital rectal exam; F, flexible sigmoidoscopy; 0, no FP; 1, FP; blank is missing Number after P, D, X, F is ordered number of that test
Results
The estimated hazards for the primary scenario are presented in Table 1. Within most rounds, the number taking in each test was fairly similar except for FSG on round 3, owing to changes in study protocol. For this primary scenario, the estimated probability of an FP in 14 a tests was 60.5% with 95% CI of (59.3%, 61.6%). As sensitivity analysis, we investigated a secondary scenario that reversed the order of DRE and X-ray, and obtained the same estimates for three significant figures.
Discussion
This paper involved various methodological considerations and innovations. To accommodate missing data, we used an ordered list of tests taken for each person, which is a common technique in the methods for estimating cumulative risk of a single type of test1–4 and applied here to multiple types of tests. By making missing occur at the end as a censoring, we circumvented the added complexity when modelling the probability a test is missing within a set of tests. An implicit assumption of this ordering approach is that the time between tests is not predictive of whether or not a later test was censored or was an FP.
Importantly, we allowed censoring to depend on the previous history of tests. In contrast, some methods for estimating the cumulative risk of FPs unrealistically assume a constant probablity of censoring.1,2 Nevertheless, bias could arise if a subset of subjects, such as older subjects, were both more likely to be censored and have an FP after censoring. This bias can be avoided by stratifying the analysis by this subset. 7
A key innovation for combining data from different types of tests is the introduction of a covariate that is analogous to a time-varying covariate in survival analysis. From this perspective, the formulation is an extension of the Kaplan-Meier approach to a time-varying covariate. In this study, our time-varying covariate was the type of test and number of previous tests of that type that were taken.
In a companion paper 6 , the time-varying covariate was the type of test and round. Round is likely less relevant than the number of previous tests because the first test, regardless of round, may have a different FP rate than later tests as there is no background information to modify clinical interpretation. Our estimates of cumulative risk of FPs among men in the PLCO study were similar to those in the companion paper. The likely reason is that there was little data missing in the first round, so that the first round corresponded to the first test in most instances.
Although the focus of the paper is on methodology, some discussion is warranted about clinical definitions and assumptions. For this analysis, advanced adenomas (including those with villous histology, severe cellular dysplasia or >1 cm diameter) were considered true-positives. However, it is possible that the identification of smaller lesions (which are classified as FPs), which would then lead to their removal, could prevent cancer. Such FPs could in theory confer eventual benefit. But because the natural history is unknown, it could also as well be the case that these small lesions would never progress to cancer and identifying and removing them could confer net harm owing to bleeding, infection or colon perforation. Here, we take the view that identification of the smaller lesions is detrimental and included as an FP.
We defined FPs based on no cancer in a three-year interval after screening. The longer the time interval, the more likely one will correctly detect a cancer missed on screening, but also the more likely one will incorrectly count a cancer arising after screening as an FP. This trade-off depends on the natural history of the disease.
Our results have important implications. Recommendations for cancer screening need to be based on both the expected cancer mortality reduction, if any, owing to screening and the harm from FPs. Separate estimates of FP rates for particular tests do not capture the harm from an entire screening programme. For example, a high cumulative FP rate in a multiphasic screening programme may cause screening participants to avoid further screening of other types of tests in the same programme, even though there might still be a net benefit of screening.
Estimates of the burden of FP rates of a specific test are often made in isolation, test-by-test, sometimes by organizations or specialties with a particular interest in a specific disease. This can lead to a plethora of screening recommendations, each associated with separate estimates of FP rates. The method used in this paper can provide a broader estimate of the impact of such recommendations.