
Abstract
Objectives
Mean sojourn time (MST) and screening test sensitivity (STS), is usually estimated by Markov models using incidence data from the first screening round and the interval between screening examinations. However, several screening programmes do not have full registration of cancers submerging after screening, and increased use of opportunistic screening over time can raise questions regarding the quality of interval cancer registration.
Methods/settings
Based on the earlier used Markov model, formulas for expected number of cases given time since former screening activity was developed. Using questionnaire data for 336,533 women in the Norwegian Breast Cancer Screening Programme (NBCSP), mean square regression estimates of MST and STS were calculated.
Results
In contrast to the previously used method, the new approach gave satisfactory model fit. MST was estimated to 5.6 years for women aged 50–59 years, and 6.9 years for women aged 60–69 years, and STS was estimated to 55% and 60%, respectively. Attempts to add separate parameters for breast cancer incidence without screening, or previous STS, resulted in wide confidence intervals if estimated separately, and non-identifiably if combined.
Conclusion
Previously published results of long MST and low screen test sensitivity were confirmed with the new approach. Questionnaire data on time since previous screening can be used to estimate MST and STS, but the approach is sensitive to relaxing the assumptions regarding the expected breast cancer incidence without screening and constant STS over time.
INTRODUCTION
Breast cancer is difficult to prevent, but large-scale trials indicate that early treatment based on mammography screening is likely to reduce breast cancer mortality. 1,2 As a result, mammography screening for early detection of breast cancer has become a standard health service in most developed nations.
Screening test sensitivity (STS) and the mean time in screening detectable phase, so-called mean sojourn time (MST), represent central parameters in the evaluation of screening procedures. 1,3 Several methods are applied in the estimation of MST and STS, based on the increased incidence during screening and the reduced incidence after screening. 4–8 Most studies have used Markov models, where tumours are assumed to move from ‘no screening detectable breast cancer’, to ‘preclinical screening detectable breast cancer’, to ‘clinical detectable breast cancer’, at constant rates.
The common Markov approach is based on the observed incidence increase during screening and following incidence reduction. It is important to distinguish between cancers that are detected as a result of screening and cancers that were clinically detected in the interval between screening examinations. The early randomized screening trials had reliable information about interval cancers, and the model gave acceptable fit to the observed data. 4–6 However, recently launched public screening programmes are accompanied by unregistered opportunistic screening that makes ascertainment of (true) interval cancer much less reliable, and a recent study shows substantial difficulties with model fit. 9
Information on whether the breast cancers were diagnosed through routine screening or on the basis of clinical symptoms is included in the Norwegian breast cancer report form. Hence, it should, at least in theory, be possible to identify cancers detected at opportunistic screening for women with no previous symptoms. However, while the general cancer registration in Norway is of very high quality, the indication for mammography is often insufficient and sometimes incorrect. The Cancer Registry of Norway work towards mandatory reporting of screening at private institutes, but at present, reliable information regarding interval cancers is lacking. This as private mammography laboratories in practice perform both ‘routine opportunistic screening’ and clinical mammography based on symptoms.
During the last decade, new screening procedures, improved screening technology 10 and increased use of hormone replacement therapy (HRT) 11 are factors that may have changed MST and STS substantially. Consequently, there is increasing uncertainty regarding the current validity of using previous MST and STS estimates. Since the previously used method may give biased estimates, 9 there is a need for more robust methods to estimate MST and STS. In addition, many screening programmes do not include complete registration of interval cancers, which further emphasizes the need for additional methods of estimating MST and STS that do not depend on information on interval cancers. Chen et al. (2000) 12 demonstrated that data from two screening rounds could be used to estimate MST and STS, and we will in this paper explore the possibility of using data from only one screening examination combined with questionnaire data on time since previous screening.
MATERIALS AND METHODS
Data
In 1995, the Norwegian government initiated an organized population-based screening programme, 13 in which mammography results and interval cancer cases were carefully registered by the Cancer Registry of Norway. Initially, the Norwegian Breast Cancer Screening Programme (NBCSP) comprised four counties. Other counties were subsequently included, and by 2004 the screening programme achieved nation wide coverage. All women between 50 and 69 years of age receive a written invitation every second year, and at first attendance, each women is asked to answer a short questionnaire, including a question about time since previous screening (private or public). Until now, approximately 94% of the women have filled in the questionnaire.
The two-view mammograms are independently evaluated by two readers. The present study includes screening data from 1995 through 2002. Overall, 78% of invited women participated during this period, resulting in 364,731 screened women 50–69 years of age. Among these women, 314,865 answered the question regarding former screening experience at their first attendance in the NBCSP and 113,238 reported no previous mammography. For an overview of the data used in the estimation, see Table 1.
Basic data used in the estimation; screening outcome as function of time since previous screening
Generally, there are good opportunities for population-based cancer research in Norway. A high quality Cancer Registry 14 and a unique personal identification number for each inhabitant in the country enable long-term follow-up of cancer incidence. Reporting of cancer is mandatory, and information is obtained independently from clinicians, pathologists and death reports.
To make results comparable with previous studies, 6,7 we included all cases of ductal carcinoma in situ (DCIS) and all invasive breast cancer cases. Control estimations using only invasive cancer were done in order to study the effect of excluding DCIS. Only new primary breast cancers were included, and several tumours detected at the same time in one woman were counted as one case.
Estimation using time since previous screening
As for the earlier used method of estimating MST and STS, we assume a continuous time Markov model, 5,15 consisting of three stages; ‘No screening detectable breast cancer’, ‘Preclinical screening detectable breast cancer’ and ‘Clinical detectable breast cancer’ (Figure 1). This corresponds to a model where women move from one stage to the next at a constant rate, with no possibility of regress once the tumour is visible at screening. The assumption of constant transition intensities imply a substantial variation in sojourn times, and has given good model fit in several earlier mammography screening studies. 4,6–8

Markov model for breast cancer screening
In practice, the proportion of positive mammograms will vary with time since previous screening, as some of the potential cancers will already have been detected at the previous screening. With increasing time since previous screening, the size of the reduction decreases, as fewer of the preclinical cancers were visible on the previous screening. With lower MST, the effect of the previous screening disappears faster, and we would suspect a steeper increase in the proportion of positive mammograms with time since previous screening. On the other hand, a high MST would be suspected to give a more gradual increase in the proportion of positive mammograms with time since previous screening, as the proportion of tumours visible on the last screening decreases more gradually. Similarly, a high STS would be expected to give few cancer cases among recently screened women, since most cancer cases in preclinical detectable phase then was suspected to already have been found at the recent screening.
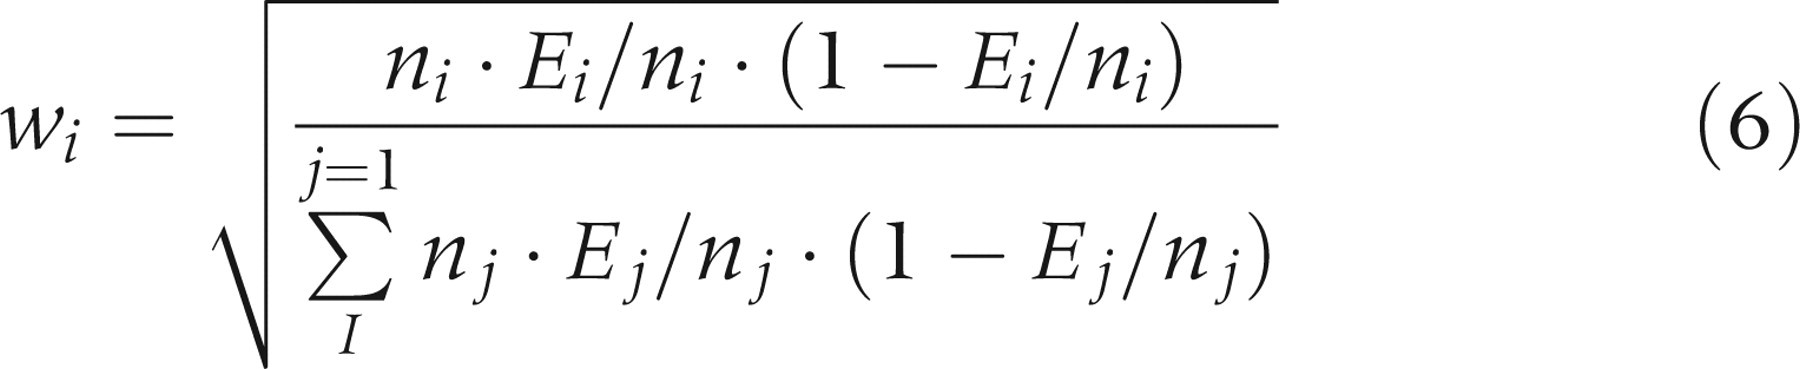
Using screening data with time since previous screening, it is possible to utilize the differences in the proportion of positive mammograms between groups with different time since previous screenings to estimate MST and STS. To estimate the expected number of cases, we use the conditional probability of having a screening detectable cancer given the previous screening history. As deduced in the Appendix I:
STS is screen test sensitivity λ = 1/Mean sojourn time (=1/MST)
J is the transition intensity from ‘No screening detectable cancer’ to ‘Preclinical screening detectable cancer’; in practice equalling the expected cancer incidence without screening
t the age of the screened women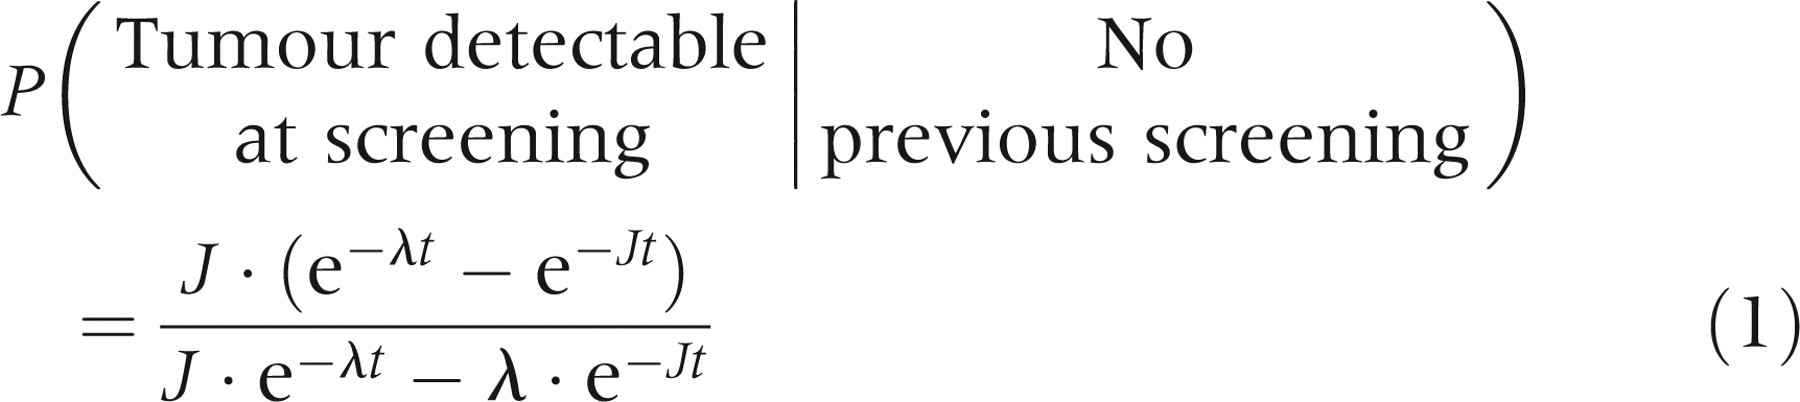
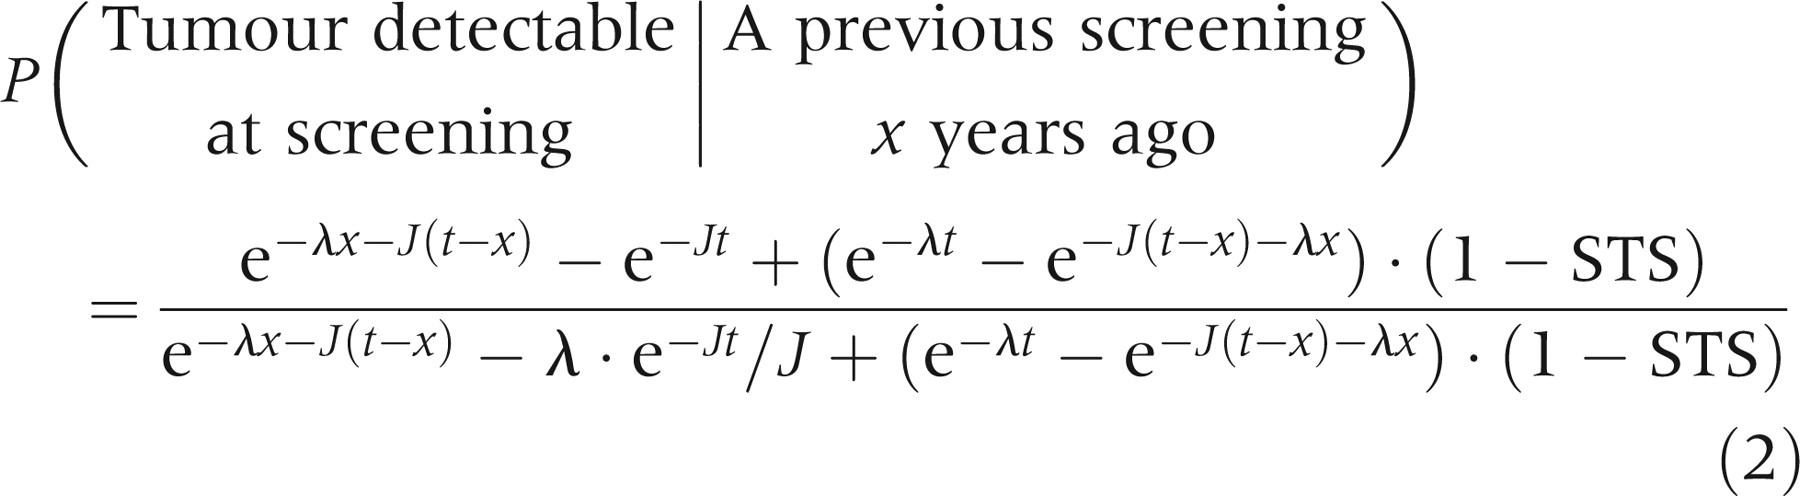
Since J is assumed known from other sources, we can estimate MST and STS using either non-linear regression or maximum likelihood estimation. As MST and STS are known to vary with age,
1
we have grouped our data into two age groups, estimating MST and STS separately for the two age groups. The data for each age group is given on the form

Using this, the probability of detecting a tumour at screening becomes
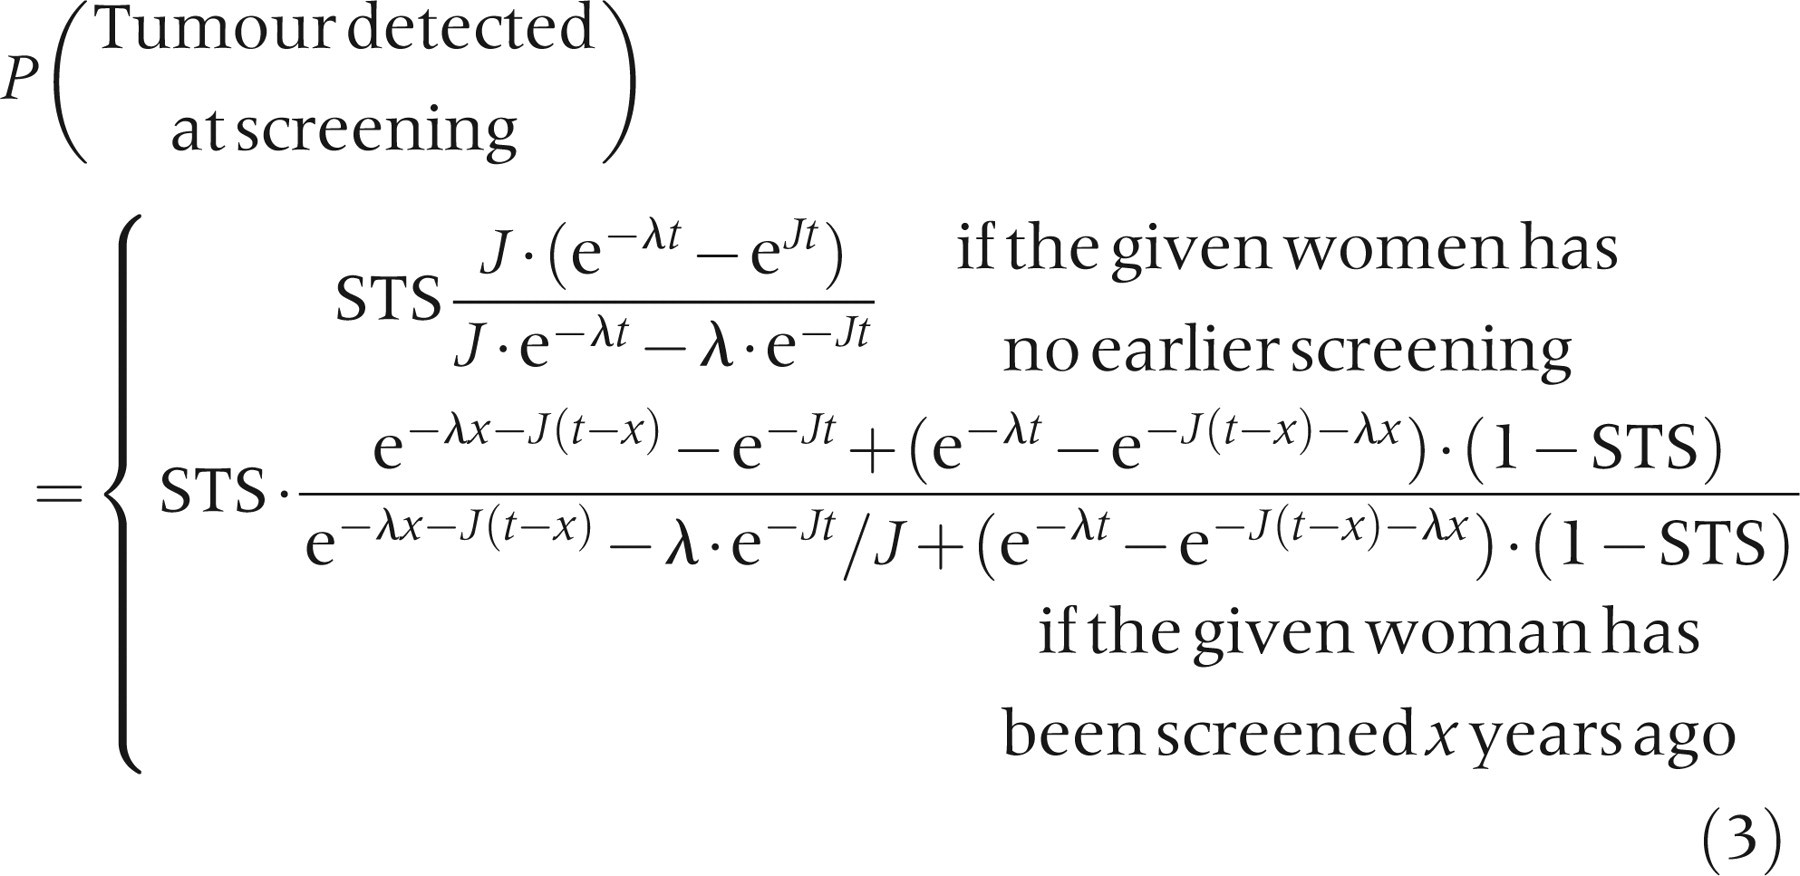

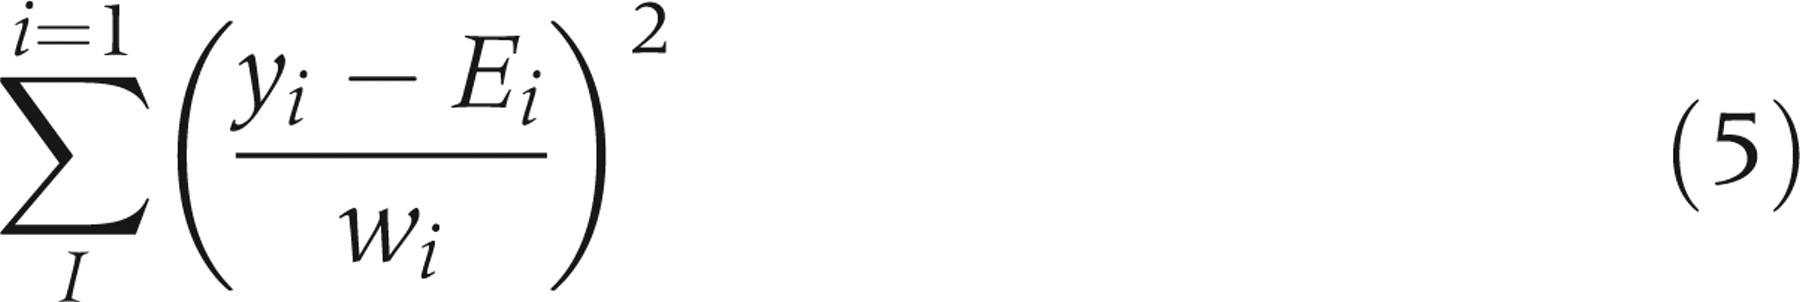
Based on these formulas, MST and STS estimates are found by minimizing:
Data handling
In the questionnaire, time since previous mammography was given in the categories 0–1, 1–3, 3–5 and 5 + years. This format was not suitable for the estimation, so 0.67, 2, 4 and 6.5 years were chosen as appropriate representative points for each interval (i.e. the values of x i defined above). Other choices for representative points were also tested, to make sure that this choice did not substantially influence the results (data not shown).
NBCSP offers screening to all women in the defined population, so no parallel control group is available to estimate incidence without screening. In addition, commitment to screening can, and probably does vary by individual risk factors, so women not attending are not considered a suitable control group. Hence, background incidence was calculated from historical data combined with an estimated time trend. In practice, incidence data from 1990 to 1994 were used with time trend estimates from a special age-period cohort model with additional screening parameters. This model has been described in detail by Møller et al. 16 Incidence rates vary among age groups and between counties, and the estimate was therefore weighted by the number of person years in each age group and county.
As for the previously used method that utilized the incidence of interval cancers, the assumed background incidence without screening (J) is essential in the estimation. Hence, our estimated background incidence is important, but the strong increase in HRT use in the 1990s 17 may have influenced and distorted the historical time trends. In a large Norwegian cohort study, Bakken et al. (2004) 17 found a relative risk of 2.1 of breast cancer for current use of HRT. Combining sales figures with risk estimates, Bakken et al. estimated that 27% of breast cancer cases could be attributable to the use of HRT among Norwegian women aged 45–64 years. The use of HRT increased sharply from our historical comparison data (1990–1994) to the estimation period (1996–2002), and this could have changed the historical trends significantly. Combining HRT sales figures and risk estimates found in Bakken et al., breast cancer incidence is estimated to increase 21% from our historical data to our estimation period due to increased HRT use. Hence, estimates were (when otherwise not noted) calculated with a 21%-added background incidence, to account for a probable increase in HRT use.
One possible problem when using time since previous screening in the analysis is potential bias caused by different frequencies of both opportunistic/private screening and breast cancer according to socioeconomic status. To evaluate the probable impact of this potential problem, adjusted estimates were calculated taking into account the observed differences in HRT use (ever), children (yes/no), number of children, age at first birth, alcohol consumption, education and county of residence, among women with and without a previous screening history. Calculations were done in a three-steep approach; first, the relationship between covariates and the risk of breast cancer among women with no reported previous screening history was estimated, using logistic regression. Then an adjusted risk of breast cancer for women without previous screening history was calculated, combining the estimated covariate coefficients with the distribution of covariates among women with and without a previous screening history. Finally, the new adjusted level of breast cancer cases among women with no reported screening history was used to calculate adjusted MST and STS estimates.
In order to compare the new estimation method with the previously used method, estimates from Weedon-Fekjær et al. (2005) have been included in Table 2.
Mean sojourn time (MST) and screening test sensitivity (STS) estimates; using time since previous screening (new method), or number of cancers found at screening combined with the interval cancer rate (previous method)
*Excluding earlier screened women from screening data
**95% bias-corrected bootstrap confidence interval
***95% smoothed bias-corrected bootstrap confidence interval
Estimation of model parameters
Parameters are estimated using non-linear weighted mean square regression. The main estimates of MST and STS were given with robust 95% bias-corrected bootstrap confidence intervals (CI), calculated from 2000 bootstrap replications. For a validation of the model fit, observed versus expected values were plotted. All calculations, simulations and figures were performed using the R statistical package. (R Development Core Team [see http://www.r-project.org/contributors]). 18
RESULTS
MST was estimated to 5.6 years for women aged 50–59 years, and 6.9 years for women aged 60–69 years (Table 2), and STS was estimated to 55% and 60%, respectively. Comparing the new estimates with estimates based on the number of interval cancers, MST estimates were 1.7 years higher for women 50–59 years and 1.9 years higher for women 60–69 years, with both CIs overlapping (slightly) with results from the previously used method. As for STS, there were substantial differences, with STS for women 50–59 years of 55% versus 75% with the previously used method based on interval cancers, and for women 60–69 years 60 % versus 85 %, respectively.
The earlier estimation method, using number of interval cancers, gave only moderate fit to the observed NBCSP data, 9 while the new method using time since previous screening fitted well to the observed data (Figure 2).
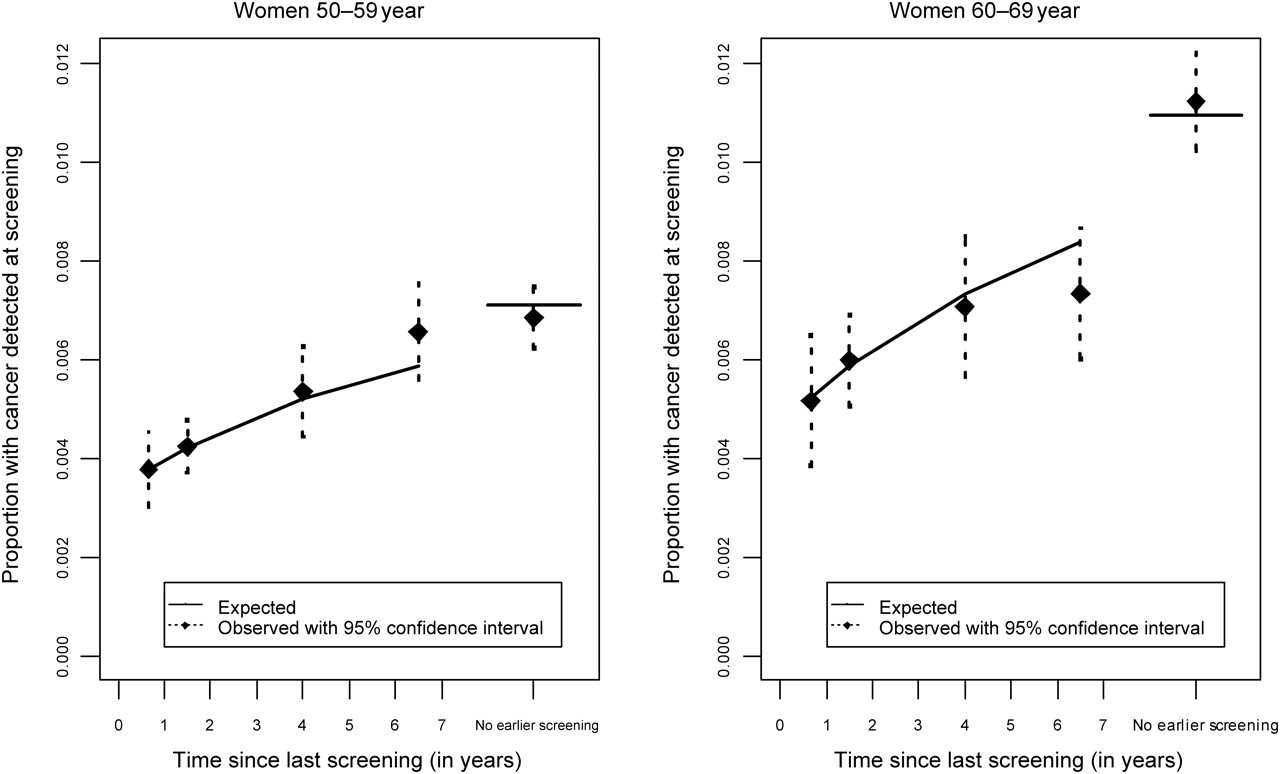
Model fit using time since last screening (dotted lines mark 95% confidence interval for observed values)
Without the assumed 21%-added background incidence due to increased HRT use (Table 3), MST estimates increased from 5.6 to 7.2 years for women aged 50–59 years and from 6.9 years to 8.6 years for women aged 60–69 years. The corresponding STS decreased to 52% and 58% for the two age groups. Excluding DCIS cases, MST was estimated to 4.7 years for women 50–59 years of age and 6.0 years for women in the age group 60–69 years, while STS estimates remained constant. Adjusting for different risk factors among women with and without previous opportunistic screening had little effect on the estimated values (Table 3).
Mean sojourn time (MST) and screening test sensitivity (STS) estimates based on different assumptions; Main estimates, excluding Ductal cancer in situ (DCIS), without correcting the assumed background incidence due to increased hormone therapy (HRT) use, and adjusting for different covariates among women with and without previous screening
*Hormone therapy use (ever), children (yes/no), number of children, age at first birth, alcohol consumption, education and county of residence
DISCUSSION
Most previous studies of MST and STS have used the Markov model approach of estimation by number of cancer cases at first attendance and in the interval between screening examinations. 1,7,19 However, given the recent increase in opportunistic screening between ordinary screening rounds, the usefulness of the model may be questioned, and Weedon-Fekjær et al. (2005) found only moderate fit to the observed NBCSP data. To solve the problems caused by unregistered opportunistic screening, a new approach using time since previous screening is suggested. Applied to the NBCSP data-set, the model gave good fit to the observed data (Figure 2), and the method seems to be a good supplement for the previously used method. The new approach requires good quality questionnaire data about time since previous screening, but allows MST and STS estimation in screening programmes without registration of interval cancer cases. As in Chen et al. 12 there is no need of information regarding interval cancer, and in addition only data from one screening examinational can be used in populations with widespread non-registered screening.
Based on the previously used method and the Swedish two county study data, 1 Tabar et al. (1995) estimated MST to around 3.5 years and STS to 92–94%, both estimates increasing with age. Compared with the Swedish Two County study and several other studies, 1,4,19,20 Weedon-Fekjær et al. (2005) found significantly higher MST and lower STS in the NBCSP. When adjusting for a higher incidence due to increased HRT use, MST in the NBCSP programme was estimated to 3.9 years for women aged 50–59 years and 5.0 years for women aged 60–69 years, and the corresponding STS was estimated to 75% and 85%, respectively. The authors suggested that some of these differences could be attributed to bias due to opportunistic screening, but the new estimating method presented here confirms the long MST and low STS, without the problem of bias from opportunistic screening.
As MST and STS often are highly correlated in the simulations estimation of these Markov models, 7 it could be suggested that a higher STS and lower MST could explain the observed data. Locking STS to 90%, MST decreases towards values observed in earlier studies, but with a considerable loss of model fit (Figure 3).
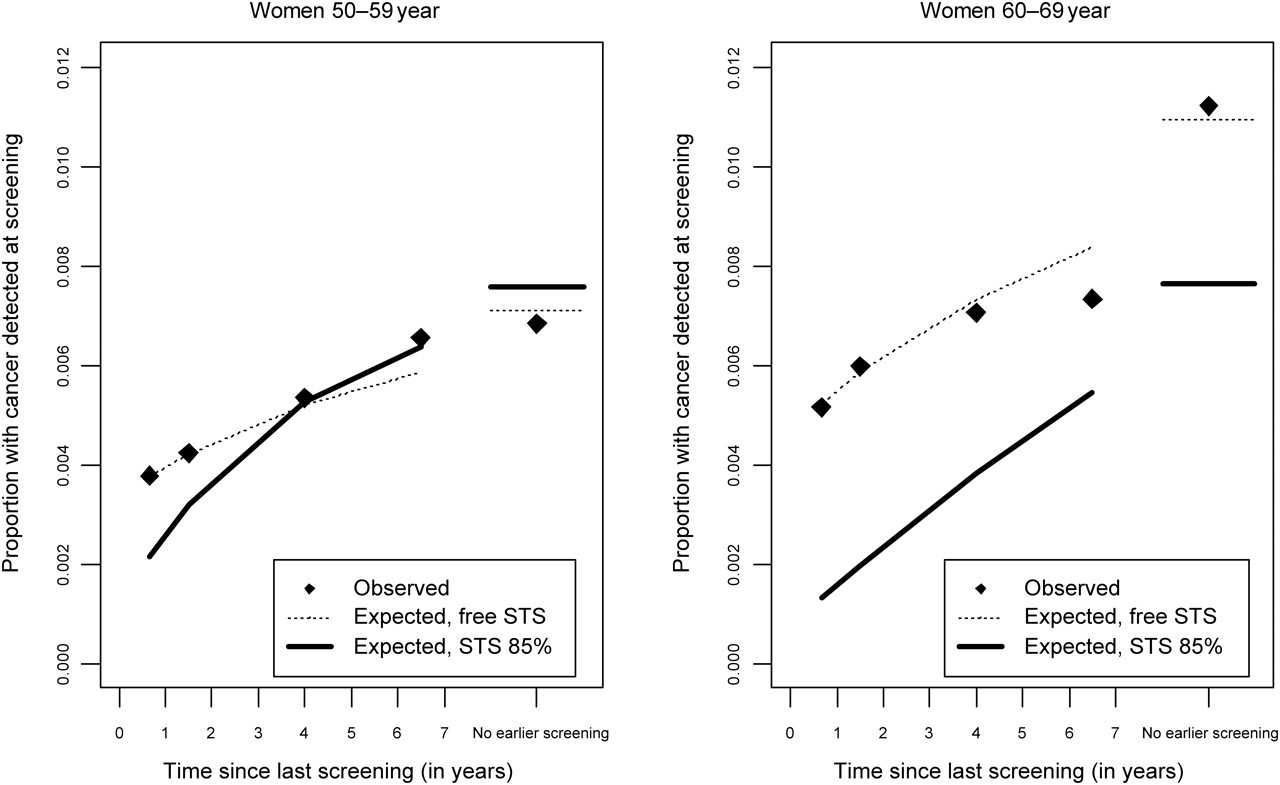
Model assuming screening test sensitivity (STS) of 90% versus separate STS variable (MST estimate with STS = 0.9 is 3.0 for women 50–59 years and 4.8 for women 60–69 years)
However, the new method could also be subject to bias, especially by variations in STS over time, as one assumption of the new method is constant STS over time. If the sensitivity of the screening test increases, the estimated STS for the new test will be too low. Usually, bias due to variation in STS would only constitute a minor problem in breast cancer mammography screening, since STS changes slowly over time, but new screening methods and routines could in some situations bias the estimates. One example is digital mammography, but use of digital mammograms in Norway was limited during the study period. A related problem is possible systematic differences in STS between the official screening programme and the previous screening tests conducted outside the programme. In Norway, this may explain the lower STS estimates seen with the new method, since a substantial part of previous mammograms were conducted by private practitioners with a possibly different set of routines than the public screening programme.
Generally, with STS varying from previous to present screening, STS estimates using time since last screening can be seen as a compromise between previous and present STS. On the other hand, STS estimates based on the number of interval cancers only estimate the present STS. As for MST, the estimate is in practice probably mostly based on the observed incidence at screening, combined with STS and the expected incidence in the absence of screening. With lower STS estimates, MST estimates will probably also be biased (upward). Hence, the approach using time since last screening should mainly be used when there are no indications of considerable changes in STS over time.
Probably the most problematic assumption is the estimated breast cancer incidence without screening. Removing the correction for a likely increase in breast cancer incidence due to more HRT use, MST increased considerably while STS increased slightly. Hence, the longer MST and low STS could not be an effect of an over correction. Still, the effect of HRT could be even higher than assumed, but it is not likely to explain all the observed differences from earlier screening programmes/trails.
As there is some uncertainties regarding both the assumed constant STS and the assumed background incidence without screening, two model extensions taking into account these possible departures were tested. As shown in appendix II, a change in STS from the previous tests is impossible to separate from a change in the assumed background incidence without screening. Hence, the details of these calculations must be interpreted with great care. However, the long MST and low STS of both models further confirm a possible change in MST and STS compared with earlier screening programmes/trials (Table 4).
Estimates (with 95% bias-corrected bootstrap confidence interval) of different models with additional parameters for either screening test sensitivity (STS) of previous screening or underlying breast cancer incidence without screening
MST, mean sojourn time
*Compared with historical trend
Another possible bias could come from non-progressive (or regressive) cancers. Earlier studies of MST and STS have assumed only progressive cancers, 4–8 and good model fit indicates that this is a minor problem with the new method. There are few reports of regression of invasive breast cancers, 21,22 but there is uncertainty regarding non-invasive cancer DCIS. Some studies have suggested that only a small proportion of DCIS regresses, 23 but this question is currently under discussion. To explore the effect of possible regressive DCIS cases, special calculations excluding DCIS were performed. As shown in Table 3, the effects of excluding DCIS on the estimated MST and STS were quite modest, yielding a slightly shorter MST and minor changes in sensitivity.
Since opportunistic screening is not uniformly distributed among different social groups, variations in the probability for earlier screening may correlate with different risk factors. It is conceivable that this could have biased our new estimates. However, adjustment for socioeconomic factors had only a negligible effect on the estimates (Table 3).
The increased MST implies that patients spend more time in the preclinical screening detectable phase, and may indicate an increase in screening efficiency. During the last years, substantial effort has been made to increase the quality 10,24 of mammographic images and other aspects of mammography screening. These improvements have most likely resulted in earlier detection of tumours, and preliminary findings indicate that the NBCSP is successful in detecting small tumours. Compared with EU guidelines, the NBCSP performs well on tumour size, the proportion of detected DCIS cases, and the proportion of lymph node positive cases. 25 Comparing NBCSP with the Nijmegen and Utrecht trials, 20 the proportion of DCIS in the first screening round was 17% and 13%, respectively. Similarly, the proportion of invasive cancer cases 20 mm or larger in the first round was 19% for NBCSP, compared with 28% combined for the Nijmegen and Utrecht trials.
The low sensitivity may seem strange in the light of a possible increase in mammographic quality. However, one should note that sensitivity in these Markov models is not an absolute measure of quality, and that the expected number of diagnosed cancer cases at each screening round was actually higher than reported in most previous studies (illustrated by MST × STS). Therefore, the new techniques may enable the detection of additional small tumours, but simultaneously yield low STS. Use of HRT is also known to reduce STS, 11,26,27 at least partly by increasing breast density. In Norway, the use of HRT was common during the study period, 17 and the reduced STS may, to a certain extent, be an effect of HRT, especially among women 50–59 years of age, in whom HRT use was highest. 28
To summarize, the new method using time since previous screening seems to be a good substitute for the previously used method of estimation based on number of interval cancer cases. The new method is robust against unregistered opportunistic screening, and gives good model fit to mammography screening data, but it is not recommendable to extend the model with additional parameters for either a change in STS over time or breast cancer incidence without screening. It requires information on time since last screening, but it does allow for estimation of MST and STS in screening programmes without registration of interval cancers. These analyses confirm estimates from Weedon-Fekjær et al. (2005), with higher MST and lower STS in the NBCSP compared with results from other mammography programmes or trials. New mammography methods have probably increased the number of tumours that may be detected at screening, while increasing use of HRT has probably reduced STS. This study is (probably) the first to apply time since previous screening in the estimation of MST and STS, and we therefore encourage new studies on data from other programmes to verify our results. An implementation of the new method for the free R statistical package
18
is available at
Footnotes
ACKNOWLEDGEMENTS
The authors would like to thank Bjørn Møller, Solveig Hofvind, Unn E Hestvik and Tom Grotmol for valuable comments on the article, and Solveig Hofvind and Wenche Melbye for sharing there excellent knowledge about the Norwegian breast cancer screening programmes and database.
FINANCIAL SUPPORT
The project has received financial support from the Norwegian Cancer Society (grant E03031/001), and is connected to the Centre for Biostatistical Modelling in the Medical Sciences group at University of Oslo, Norway.