
Abstract
Introduction
Objectives The objective of this study is to analyse cervical screening coverage data over time.
Methods
Routinely collected cervical screening statistics, in England, on the proportion of women who have undergone cervical screening with cytology during the preceding five years. The participants included all women residents eligible for cervical screening.
Results
Overall coverage remained at about 82% or over between 1995 and 2000. Since 2000, however, coverage has drifted slowly down to just over 80% in 2005. Coverage has long been observed to be related to age. In 2005, the coverage rate was 71% in women aged 25-29, 83% in those aged 35-54 and 75% in those aged 55-64. Comparing coverage by age in the three years, 1995-2000 and 2005 - shows broad conformity with this pattern in each of the three years, but overlaid is the fact that at ages below 50, the rate has been falling while at ages above 55, the rate has been rising. The fall in screening coverage appears to be largely a cohort effect, with women born in the 1960s and later being increasingly less likely to participate.
Conclusions
No specific reason for this effect is evident. Action could be targeted at women aged 25-34 to address falling coverage.
Introduction
Methods
Cervical screening programme coverage data form part of an annual ‘snapshot’ that records the screening status of women on 31 March each year. Coverage is defined as the number of women screened in the population as a percentage of the number of women eligible for screening. For the present purpose, ‘screened’ has been taken to mean having at least one screening test producing an adequate result in the five years before the date on which coverage was calculated. Eligible women included all those who resided on that date excluding those ‘ceased’ from recall for clinical reasons; absence of the cervix being the most common reason for cessation. 2 It should be noted that although the definition of ceased women was different when the 1995 data were published, revised data for earlier years were issued in 1999 and have been used to ensure comparability.
Data from which coverage is calculated were collected by five-year age group rather than by single year of age. Although this enables trends by age to be observed in broad terms, it is only now with 11 years of consistently collected data available, that the same five-year birth cohort of women can be tracked at three successive points. Data prior to 1995 are not included as they relate to a 5.5-year coverage period and thus are not comparable.
In the present analysis, the published coverage data by age group as at 31 March in each of the three years 1995, 2000 and 2005 have been extracted and evaluated. Similar data for all 11 years, 1995-2005, have also been analysed separately. All data were as published in Table 1 of the 2005 annual publication. 1
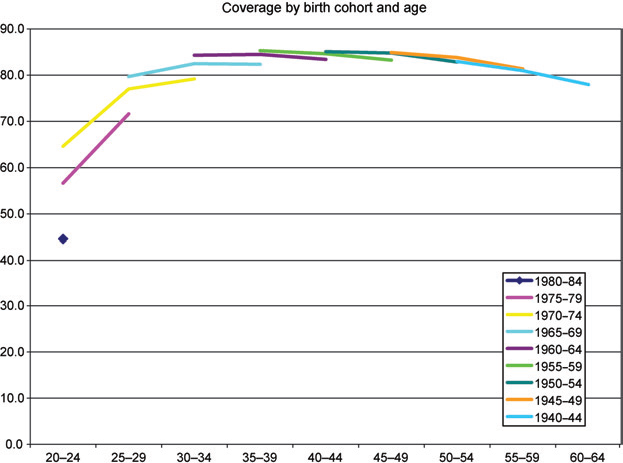
Grouping the data by birth cohort rather than by age group can be done, for example, by considering women aged 30-34 in 1995, those aged 35-39 in 2000 and those aged 40-44 in 2005. These three sets of data were different views of the same birth cohort of women, those born between 1 April 1960 and 31 March 1965. These women were referred to here as the 1960-1964 cohorts. Other cohorts may be similarly identified, although for the youngest two cohorts only one or two data points were available. Looking at cohort data were usually difficult as the data for a cohort were split between age groups in four out of every five years. It is only with six years data that the same cohort can be separately identified at a second point in time; and only with 11 years data can a cohort have three separate independent data points.
Results
Overall coverage for the whole of the programme in the age range 25-64 remained just above 80% between 1995 and 2005.
1
During most of the period from 1995 to 2005, women would be invited for their first test at 20 years old. Since October 2003, the target age group for cervical screening has been 25-64. However, the move to the new starting age for screening has been gradual and women already in the system are reinvited on their original schedule. There would therefore have been little impact on coverage by March 2005. As reporting systems have not yet been updated, data for the 20-24 age group are included in the analysis and in Figures 1 and 2. Overall coverage remained at about 82% or over between 1995 and 2000. While coverage remains at a high level, since 2000 the rate has drifted slowly down to 80% in 2005.
Coverage by age, england 1995, 2000 and 2005 Coverage by birth cohort and age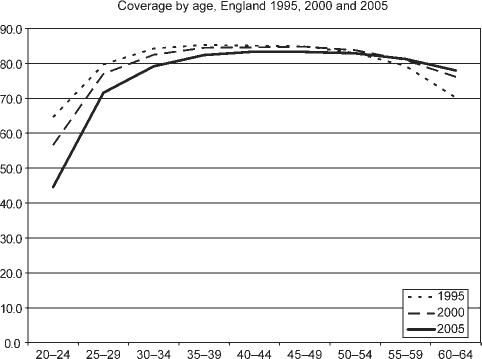
Coverage has long been observed to be related to age. The coverage rate is relatively low at ages under 30, is at its highest between the ages of 35 and 55, and then starts to tail-off. Comparing coverage by age in the three years 1995, 2000 and 2005 (Figure 1) shows broad conformity with this pattern in each of the three years, but overlaid is the fact that at ages below 50, the rate has been falling while at ages above 55 the rate has been rising.
Figure 2 shows the data described above analysed by birth cohort; the data for each cohort consist of three data points. The data point furthest to the right of the three is the most recent, i.e. that for 2005. The broad pattern of coverage by age seen in Figure 2 is apparent here too. Figure 2 also shows that the pattern of coverage by age for the 1950-1954 cohort (i.e. women aged 50-54 in 2005) is very similar to that of the earlier cohorts. However, each successive more recent cohort, while also conforming to the typical pattern of coverage by age, appears to enter with a lower coverage than its predecessor cohort. Furthermore, none of these recent cohorts appears to catch up, that is, to reach at older ages the coverage of the preceding cohort.
Discussion
Although the birth cohort definition is stable, some of the women who make up each cohort may have moved out through emigration or death. Other women may have moved into the cohort through immigration or have otherwise been identified for the first time. Nevertheless, the vast majority of each cohort consists of the same women at each of the three points in time and it is unlikely that the changes observed could be due to incoming women being less likely to accept screening than outgoing women.
There are many other possible reasons for the observed decline in screening coverage. These may include increasing emphasis on patient choice and less on persuading women to be screened, although the new ‘informed choice’ national leaflet was not introduced until 2001. There could now be greater distrust of health services generally and cervical screening in particular (for example, following highly publicized adverse incidents in the 1990s). There may be a broader disillusion with public services in general (seen, for example, in lower turnout for elections). The fall could even reflect the success of the programme itself in reducing the incidence of cervical cancer (with each succeeding cohort, the perceived threat of cervical cancer has receded and so the need to be screened is seen as less important). The decline may be a combination of some or all of these and other reasons. However, the question remains, why would the younger cohorts have been affected to a greater extent?
In order to obtain some initial indication of where research might be focused as to the reasons for this falling coverage, an electronic survey was carried out for the cervical screening programme, by YouGov in September 2006. A total of 2275 women aged 26-44 responded to a web-based questionnaire; half were 26-34 and other half were 35-44. All respondents were prepared to answer questions about the reasons why they might have refused cervical screening or would be willing to accept a future invitation. The questions focusing on women's non-participation in cervical screening did not suggest adverse publicity as a cause at any age. 3 Women aged 26-34 did, however, report a greater degree of embarrassment about the procedure and concern about potential discomfort as reasons for not taking up invitations to be screened, compared with those aged 35-44. Otherwise, there were few differences between women of different ages. Unfortunately, no similar survey results are available from 5 or 10 years ago to allow an assessment of changes in attitudes over the period. It has been suggested that calling women when at 20 years old encouraged the inculcation of the screening habit. This analysis covers a period when women were invited from age 20; whereas it shows falling coverage in the 20-24 age group, it neither supports nor refutes this argument.
A recent report from the North-East and Yorkshire and the Humber regions has shown an even greater decline in coverage rates than we have described for England as a whole. 4 There was a very strong correlation between age and rate of change of coverage rates. An association was also found with local deprivation measures and there was some indication that areas with high proportions of black or mixed ethnicity might have a faster rate of decline. The authors suggest that targeting interventions at younger women and those living in deprived areas might be valuable. Although this report is important, it does not provide an explanation for the declining rates of coverage seen locally or nationally.
Conclusion
The fall in overall screening coverage between 1995 and 2005 was small; it appears to be largely a cohort effect, with a worryingly large fall in women born in the 1960s and later. No specific reason for this effect is evident. Action targeted at women aged 25-34 could to be taken to address falling coverage, perhaps, by reconnecting to maternity care, which has largely been neglected by the cervical screening programme since call and recall was introduced.