
Abstract
Objectives
This study aims to determine the association of two versus three year screening intervals with the likelihood of detection of a high-grade cervical abnormality and cervical cancer.
Methods
Data were obtained from the New South Wales (NSW) Papanicolaou (Pap) Test Register (PTR) and NSW Central Cancer Registry (CCR). Subjects were human papillomavirus (HPV) unvaccinated women aged 20-69 years who had a minimum of two Pap tests with a negative result at their first recorded Pap test (n = 1,213,295). Logistic regression was used to determine the association between screening interval and the likelihood of: (1) a cytological prediction of high-grade abnormality, defined as cervical intraepithelial neoplasia (CIN) 2 or greater; (2) a histologically confirmed high-grade abnormality; (3) a cytological prediction of cervical cancer and (4) a confirmed diagnosis of cervical cancer, controlling for potential confounders of age and socioeconomic status (SES) of area of residence.
Results
For each year increase in the screening interval, the odds of a histologically confirmed high-grade abnormality increased significantly in women aged 20-29 years (odds ratio [OR] 1.24, 95% confidence interval [CI] 1.20-1.28) and in women aged 30-49 years (OR 1.11, 95% CI 1.06-1.16), but not in women aged 50-69 years (OR 1.08, 95% CI 0.89-1.32). Similar results were observed for cytologically detected high-grade abnormalities. The screening interval was significantly and positively associated with a cytological prediction of cervical cancer (OR 1.40, 95% CI 1.28-1.54) and a confirmed cervical cancer diagnosis (OR 1.66, 95% CI 1.33-2.07) in women aged 20-69 years. We estimate that if the screening interval were increased from two to three years, and the number of women participating in triennial screening participation was the same as for biennial participation in NSW, then 267 (95% CI 186-347) extra cases of high-grade abnormalities would be detected annually by cytology and 225 extra cases (95% CI 160-291) confirmed by histology, mostly confined to women aged 20-49 years. Equivalently, 2.3 (95% CI 1.8-2.8) and 1.9 (95% CI 1.5-2.4) extra cases of high-grade cytology and histology, respectively, would be expected per 1000 women with initially negative cytology if the screening interval were extended from two to three years.
Conclusion
Increasing the cervical screening interval from two to three years would be expected to significantly increase the odds of detection of a high-grade abnormality for NSW women aged 20-49 years and cervical cancer for NSW women aged 20-69 years. Accordingly, our study provides evidence in support of retaining the recommended cervical screening interval at two years for HPV unvaccinated, well women.
Introduction
The current recommended cervical screening policy in Australia is routine screening with Pap smears every two years for women who have ever been sexually active and have no symptoms or history suggestive of cervical pathology.4,6 During the five year period (1 July 1999-30 June 2004), a total of 1,636,030 NSW women were screened. This represents a screening rate of 94.5% of the target population. The three-year screening rate was 75.8% (1 July 2001-30 June 2004), while the two-year screening rate was 59.7% (1 July 2002-30 June 2004). 7 Integral to the NSW Cervical Screening Program is the opt-off Pap Test Register (PTR) which (1) records all Pap tests and cervical histology tests and their results on NSW women; (2) acts as a safety net for screening reminders for women who are overdue for a subsequent test; and (3) is charged with implementing a programme of quality assurance at all steps along the screening pathway.
In other countries with population-based cervical screening programmes the recommended screening interval for well women varies, but generally is two-, three- or five-yearly (although Germany and some parts of the United States recommend annual screening). 8 In some countries, the screening interval varies with age also. For instance, in the UK the screening interval is five years for women aged 50 years or older and three years for younger women.
The Australian National Cervical Screening Program adopted a two-yearly screening interval, based largely on the 1986 review by a working group for the International Agency for Research on Cancer (IARC), which recommended a screening interval of three years or less for well women. 9 A two-year interval for Australia was adopted to include a safety margin as PTRs were not yet configured in all states and full quality assurance measures for each step along the screening pathway were not well established. 8 In June 2005, the National Health and Medical Research Council (NHMRC) recommended that the ‘screening interval for Pap smears in Australia be reviewed to ensure that the programme here is consistent with international best practice’. 10 A change to a screening interval of three years would be one option considered under such a review.
A recent study by Canfell et al. 11 concluded that the two-yearly screening policy in Australia and the predominantly three-yearly screening policy in the UK were similarly effective in reducing cervical cancer incidence and mortality rates. Nonetheless, further evidence is needed to assess possible outcomes resulting from a change in the recommended screening interval in the Australian setting, since this recent study did not examine in detail factors that might explain the similarity of the relative reductions in cervical cancer incidence and mortality. Accordingly, the present study aims to determine the effect of screening interval on the detection of high-grade abnormalities (including cervical cancer) in NSW women aged 20-69 years, using data from the NSW PTR and NSW Central Cancer Registry (CCR). High-grade cervical abnormalities were chosen here as the key outcome because these have the highest progression rates to invasive cancer, where approximately 12% of cases of minimally treated cervical intraepithelial neoplasia (CIN) 3 are estimated to progress to cervical cancer, 12 and because harms associated with treatment of high-grade cervical lesions have begun to emerge in the literature.13–16
Methods
Data and definitions
Subjects were selected from de-identified NSW PTR records, and records containing cytology test results dating from 1 August 1996 though to 31 March 2006 were selected for the analysis. No woman vaccinated against the human papillomavirus (HPV) was in these data, since the vaccine only became available in August 2006. All women aged 20-69 years at their first PTR-recorded screen, who had a minimum of two Pap tests, and whose initial Pap test result was negative, were selected for this study (n = 1,213,295). The main outcomes investigated were proportions and odds ratios (OR) of high-grade abnormalities and cervical cancer. The main study factor of interest was the interval between the initial negative Pap test and the second Pap test, defined as the difference between the request dates for each Pap test. For the descriptive part of this study screening interval categories were defined as: two-yearly if the difference between the initial and second cytology request dates was greater than 640 days and less than 820 days (i.e. two years ±3 months); three-yearly if the difference was greater than 1005 days and less than 1185 days (i.e. three years ±3 months); and so on to eight years. Logistic regression was used with these screening interval categories as the main study factor and also with screening interval treated as a continuous variable to estimate the effect of interval after controlling for potential confounders. For women who have had more than two Pap tests, only the result of their second recorded Pap test was considered as the outcome in this study.
Women whose second screen result was ungraded or not applicable were excluded from the analysis. High-grade abnormalities were defined as Pap test results reported as CIN grade 2, CIN3 or cervical cancer. The outcomes of interest were: (1) High-grade abnormalities predicted by cytology alone; (2) cytological high-grade abnormalities confirmed histologically; (3) cervical cancer predicted by cytology alone; and (4) cervical cancer as confirmed by the CCR. All cervical cancers were included, without distinction between squamous and non-squamous cancer.
Age of the woman at the time of the initial Pap test was classified as: 20-29, 30-49 and 50-69 years.
Women were allocated measures of socioeconomic status (SES) using the Australian socioeconomic indexes for areas (SEIFA) tool. 17 SEIFA 2001 consists of 4 indices: index of economic resources, index of advantage/disadvantage, index of disadvantage and index of education and occupation. Within each index, lower scores represent areas of disadvantage. We assigned each woman's Local Government Area of residence to approximate equal-population quintiles of these indices (where quintile 1 = areas with lowest SEIFA index scores, 5 = highest).
In order to determine the effect of screening interval on the likelihood of diagnosis of cervical cancer as reported by the NSW CCR, cancer case data were linked to their screening history data on the PTR. For the current study, only cervical cancer cases stemming from initial negative Pap tests were included where the second test showed a high-grade abnormality (as reported by cytology) and where the date of diagnosis of cervical cancer fell within six months following the request date of the second Pap test. Forty-three women satisfied these criteria and their ages ranged from 23 to 66 years. The year of second Pap test for these cancer cases ranged from 1999 to 2003. All women on the NSW PTR who were negative on their first recorded screen, and presented for their second screen during the corresponding 1999-2003 period (n = 782,208) were selected for this particular analysis.
Analysis
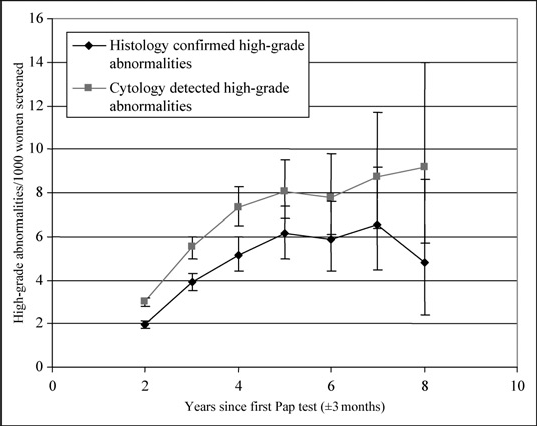
Proportions of high-grade abnormalities at second screen (per 1000 women with initial negative test) were determined for each screening interval category by age group, and exact binomial 95% confidence intervals (CI) calculated. The same analysis was repeated for histologically confirmed high-grade abnormalities, where histology relevant to the cytology result was defined as that occurring no later than 180 days after the cytology request date. In cases with several histology records, the histology test record with the highest grade result was used. High-grade abnormalities by histology were defined as a CIN2/3, carcinoma in situ, micro-invasive cancer or cervical cancer. For the histology analyses, the screening interval remained as that between the first and second Pap tests, not to when histology was requested or performed. These analyses were also conducted by year of second test, since improvements in high-grade detection rates by cytological laboratories may have occurred during the study period as a result of an educational programme for NSW cytotechnologists. 7 Logistic regression modelling of screening interval was also conducted in relation to all intervals between one year and nine months and four years and three months. This was done first because the question of interest is what are the differences between a two-year versus three-year screening interval and secondly because empirically the relationship between screening interval and high-grade abnormality rates is approximately linear between two and four years but overall is curvilinear (Figure 1).
In the logistic regression modelling, the outcomes of interest were: (1) a cytological prediction of a high-grade abnormality (including cervical cancer) and (2) detection of a high-grade abnormality (including cervical cancer) confirmed by histology. Modelled covariates included age at the time of the initial Pap test, year of second Pap test, SEIFA quintile (where each index was included in models separately). These potentially confounding factors were included to test for alternative explanations to the hypothesized screening interval for an increased likelihood of a high-grade abnormality.
Secondly, to determine whether there was a SEIFA gradient within the different screening interval categories, we performed logistic regression modelling within each screening interval category. The event of interest was a histologically confirmed high-grade abnormality and modelled covariates included age at first Pap test, year of second Pap test, with SEIFA quintile (again with each socioeconomic index modelled separately) considered as the main study variable.
Linear regression modelling was also used to determine whether SES of local area of residence was associated with screening interval. The outcome of interest was interval in years between first and second Pap test and the SEIFA quintile the main study variable (testing each SEIFA index separately).
OR estimates from the logistic regression models of the screening intervals modelled for the attenuated screening interval range of one year nine months to four years three months were applied specifically to the three-year interval category to estimate the number of extra cases of high-grade lesions that would be detected annually if the screening interval were extended from two to three years in NSW. For this, it was assumed that the number of women participating in triennial screening would be the same as for biennial screening. That is, the adjusted OR estimates were applied to numbers of women screened in the two-year period who had a negative result then pro-rated by two-thirds to estimate the extra numbers of high-grades detected annually, assuming that the same number of women who screened in a biennium would screen in a three-year interval under a triennial Pap screening policy.
All analyses were performed using SAS version 9.1.3 (SAS Institute Inc, Cary, NC 27513).
Ethics
This study was approved by the NSW Population and Health Services Research Ethics Committee.
Results
Descriptive results - screening interval as category
Proportions (per 1000 women screened) of high-grade ([cervical intraepithelial neoplasia] ≥CIN2) abnormalities detected by cytology and histology at second smear following an initial negative smear, by age group and screening interval, NSW women aged 20-69 years
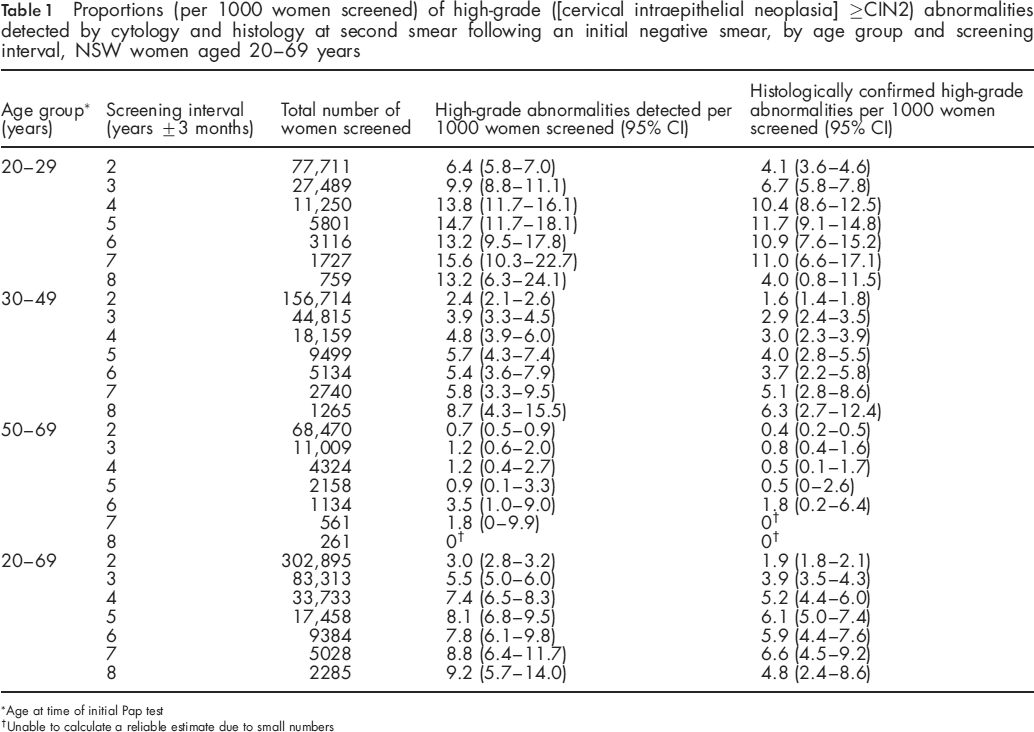
Age at time of initial Pap test
Unable to calculate a reliable estimate due to small numbers
After stratification by broad age group at first test, women aged 20-29 years had significantly higher proportions of high-grade abnormalities at each screening interval compared with two-yearly, and compared with the older age groups (Table 1). The increase in the proportion of high-grade abnormalities with screening interval was also steeper for the 20-29 and 30-49 year age groups than in women aged 50-69 years.
For women aged 20-29 and 30-49 years, the proportions of high-grade cytology and histologically confirmed high-grade abnormalities were significantly higher in those who screened three-yearly than those who screened two-yearly. This proportion increased further in women who screened four-yearly, and the increase was also significant for the 20-29 year age group. Proportions of high-grade abnormalities in women who screened at longer intervals (up to eight years) were not significantly different to those who screened four-yearly (for women aged 20-29 years) or three-yearly (for women aged 30-49 years).
Screening interval and cytologically detected and histologically confirmed high-grade ([cervical intraepithelial neoplasia] ≥CIN2) abnormalities
In women aged 50-69 years, the proportion of high-grade abnormalities for those who screened two-yearly were not significantly different to those who screened three to six yearly. Due to small numbers, it was not possible to calculate reliable histologically confirmed high-grade proportions for those who screened seven-yearly or longer.
Significant trends in proportions of high-grade cytology were also found to occur with the year in which the second Pap test was performed. For biennial screeners, the proportion of high-grades increased from 2.2 (95% CI 1.9-2.5) per 1000 women whose second screen occurred in 1999 to 4.2 (95% CI 3.4-5.3) per 1000 women who presented for their second screen in 2002. By 2004, this increased further, and significantly, to 5.5 (95% CI 4.4-6.8) per 1000 women screened (Figure 2).
Results from regression modelling
Logistic regression modelling of cytological and histological high-grade abnormalities against the screening intervals as categories as defined above, after controlling for age and year of second screen (n = 446,572), showed that the OR for a cytological high-grade abnormality in the three-year screening category was 1.47 (95% CI 1.31-1.66) and was 1.64 (95% CI 1.43-1.89) for histologically confirmed high grades (compared with OR = 1.0 in the two-year control group).
Unadjusted and adjusted odds ratios of confirmed cervical cancer diagnosis, cytological prediction of cervical cancer, histologically confirmed high-grade abnormality ([cervical intraepithelial neoplasia] ≥CIN2, including cancer) and cytology-detected high-grade abnormalities (≥CIN2, including cancer) for each yearly increment of screening interval
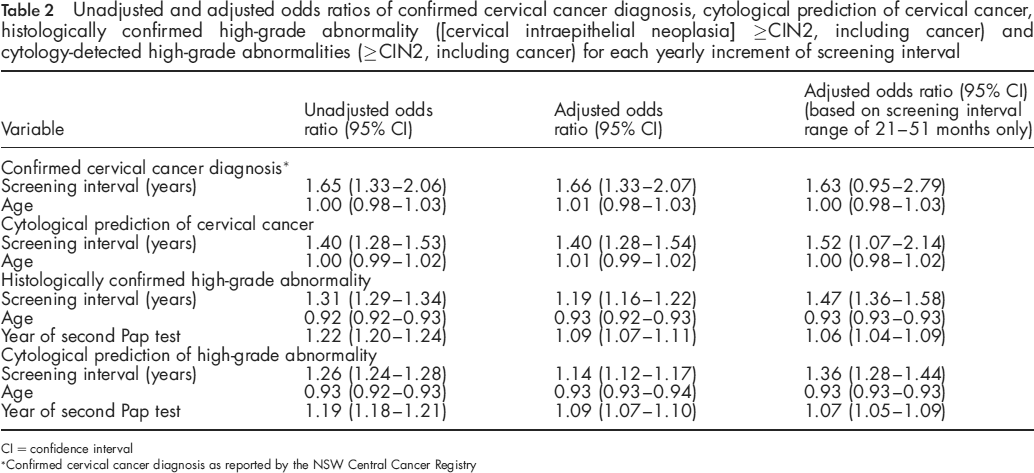
CI = confidence interval
Confirmed cervical cancer diagnosis as reported by the NSW Central Cancer Registry
Logistic regression modelling was then performed on all women on the NSW PTR recorded as negative on their first screen and who presented for their second screen at various intervals subsequently (n = 1,213,295), this time treating screening interval as a continuous variable (Table 2). None of the SES measures, the SEIFA index quintiles, were found to be significantly associated with the outcome (presence of a high-grade abnormality, either cytologically detected or histologically confirmed) and their inclusion in the model did not affect the estimate for the screening interval. Accordingly, SES was excluded from the final models. After adjusting for age at first Pap test and the year of second Pap test, the odds a high-grade abnormality being detected by cytology, and a high-grade abnormality being confirmed histologically increased by a factor of 1.14 (95% CI 1.12-1.17) and 1.19 (95% CI 1.16-1.22), respectively, for each unit year increase in screening interval.
When logistic regression modelling was repeated for each age group separately (controlling for year of occurrence of second Pap test), the odds of a confirmed high-grade abnormality increased by a factor of 1.24 (95% CI 1.20-1.28) for each yearly increment in screening interval for women aged 20-29 years, by 1.11 (95% CI 1.06-1.16) for women aged 30-49 years, but did not increase significantly for women aged 50-69 years (OR:1.08, 95% CI 0.89-1.32). The odds of a cytologically detected high-grade abnormality increased significantly for women aged 20-29 years (OR: 1.18, 95% CI 1.15-1.22) and for women aged 30-49 years (OR: 1.08, 95% CI 1.04-1.12) with each yearly increment in screening interval, but not for women aged 50-69 years (OR 0.93, 95% CI 0.80-1.08).
Proportion of cytological high-grade abnormalities ([cervical intraepithelial neoplasia] ≥CIN2) per 1000 women screened by year of second screen for women who presented for their second Pap test 2 years + 3 months after their first Pap test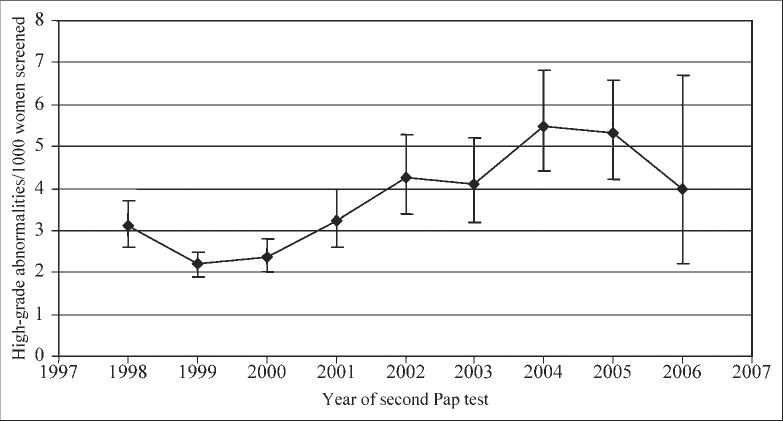
Restricting the modelling to a screening interval range of one year nine months to four years three months, to cover the 2-4 year, approximately, linear segment of the interval versus high-grade abnormality plot (Figure 1), the adjusted OR of a cytological high-grade abnormality was 1.36 (95% CI 1.28-1.44) per year increment in screening interval, while the OR for a histologically confirmed high-grade lesion was 1.47 (95% CI 1.36-1.58). These ORs translated into 267 (95% CI 186-347) extra cases of high-grade abnormality from cytology, and 225 (95% CI 160-291) extra cases of histologically confirmed high-grade abnormality, to be expected annually in NSW women if the screening interval were increased from two to three years and assuming the number of women screening three-yearly to be equal to the number screening biennially. Expressed another way, based on the observed high-grade abnormality rates of 6.4 (by cytology) and 4.1 (by histology) per 1000 women screened biennally following an initial negative screen (Table 1), 2.3 (95% CI 1.8-2.8) extra cases of high-grade cytology would be expected if the screening interval were changed from two to three years. Correspondingly, 1.9 (95% CI 1.5-2.4) extra cases of high-grade histology would be expected per 1000 women screened following a negative screen if they screened three-yearly instead of biennially.
From linear regression modelling of the screening interval as the outcome, all four SES measures were found to be highly significantly negatively associated with longer screening interval (P < 0.0001). That is, the higher the SES the shorter the screening interval. This result suggests that the mechanism for higher rates of abnormality and cancer in lower SES women who screen regularly overwhelmingly is the longer screening interval.
Finally, logistic regression analysis was performed using all women on the NSW PTR who were negative on their first screen and who presented for their second screen during 1999-2003 only (n = 782,208), to determine the association between screening interval and a gold-standard diagnosis of cervical cancer as reported on the NSW CCR. Of these women, 43 (aged 23-66 years) had cervical cancer diagnosed within six months of their second test following the initial negative Pap test. The odds of being diagnosed with cervical cancer increased by a factor of 1.66 (95% CI 1.33-2.07) with each year increase in screening interval. Again, age (at first screen) was not significantly associated with the odds of detection of cancer (OR 1.01, 95% CI 0.98-1.03). With the screening interval restricted to one year nine months to four years three months, the adjusted OR of a confirmed cervical cancer remained largely unchanged, although smaller numbers rendered the estimate statistically non-significant.
Discussion
It should be indicated at the outset that the present study is of screening outcomes occurring in independent cohorts of women who have screened at differing intervals. The study is not an analysis of the effects of ‘cumulated screening’ in which women screened at least once in a given interval will also cumulate abnormalities accordingly as the interval is increased. The screening interval for each woman in the study was calculated according to when her next and only screen occurred. Accordingly, the results reported here are not the simple artefactual outcome of an increased screening interval cumulating more abnormalities with women screened at least once and who are counted once only as screening in the interval when they may or may not have had several screens in the given interal.
The present study has found that the proportion of high-grade abnormalities detected in NSW women increased significantly with each year increase in screening interval for women aged 20-29 years who screened two-, three- to four-yearly and for women aged 30-49 years who screened two- to three-yearly. However, the proportion of high-grade abnormalities did not increase significantly for women aged 50-69 years who screened at intervals covering two to six years. In women aged 20-29 years, the odds of a histologically confirmed high-grade abnormality also increased significantly with each year increase in screening interval.
The estimates of associations between screening interval and the likelihood of detection of a high-grade abnormality, both cytologically predicted and histologically confirmed, were not significantly altered by the area-based measures of socioeconomic status used in the present study. However, living in lower socioeconomic status areas was found to be significantly associated with a longer screening interval, which has been demonstrated in other countries. 18 However, SES was not significantly associated with a high-grade test result with screening interval in the model. Moreover, the estimate of likelihood of a high-grade cervical abnormality with increased screening interval remained unaffected when SES was controlled for in the modelling.
Year of second Pap test was significantly associated with the odds of high-grade abnormality detection, and suggests improvements in high-grade detection rates by cytology laboratories occurred during the study period. To an extent this was expected, as an education programme for cytotechnologists to improve their high-grade detection rates was conducted by the NSW Cervical Screening Program in 2003, and this intervention reached 84% of NSW cytotechnologists at the time. 7
Screening interval was significantly associated with a cytological prediction of cervical cancer diagnosis as recorded on the NSW CCR, irrespective of age. Other studies have demonstrated that women who are aged 50 years and older have a greater than a three-fold risk of cervical cancer compared with women under 50 years. 2 However, our study selection criteria clarifies why such a relationship was not seen in our analysis. Analysis of the PTR revealed that women who had cervical cancer detected at their first Pap test tended to be older (mean age 50.8 years) than women who had cervical cancer detected at subsequent Pap tests (mean age = 43.5 years). Since we selected only women who had an initial negative test, many of these older women whose first Pap smear revealed a cytological prediction of cervical cancer would have been excluded from the analysis. Also, it should be borne in mind that cancer cases analysed here are of screened women, not the general population. In NSW the majority of new cervical cancer cases occur in unscreened women. Given the predominantly preventative role of cervical screening vis-a-vis cervical cancer, it would be expected that cancer rates among screened women should show an attenuated age gradient compared with unscreened women.
In this study, we considered only the interval between the initial smear (provided it was negative) and the second smear in order to maximize the number of women included in the analyses. To check for sampling bias from this source, we re-analysed screening interval with respect to a cytological prediction of cervical cancer by considering test intervals between the first negative smear (which may not necessarily be the first recorded smear for an individual) and subsequent smear. This analysis found that the odds of cervical cancer prediction by cytology increased by a factor of 1.48 (95% CI 1.10-1.97) with each year increase in screening interval. This result is very similar to our result from the original sampling approach (OR 1.45, 95% CI 1.05-2.00), and suggests that our results were not affected by significant or substantial sampling bias.
We did not include women who had an abnormal result recorded at their first Pap test due to the special management of such women with screen-detected abnormalities, as outlined under the NHMRC Cervical Screening Guidelines. 6 However, we also did not distinguish between women presenting for a Pap test for screening purposes or for diagnostic purposes, as reasons for women presenting for a Pap test initially would not influence the effect of screening interval on cytological outcome since only those women testing initially negative were selected for analysis. Furthermore, smears taken for screening purposes comprise the vast majority of records in the NSW PTR. Nonetheless, we re-analysed the effect of screening interval on the cytological prediction of cervical cancer after removing all smears recorded as diagnostic and found little difference in our results - screening interval remained significantly associated with the cytological prediction of cervical cancer (OR 1.51, 95% CI 1.05-2.18).
It is possible that a proportion of the initial negative smears recorded on the PTR used in this study may have been false negatives. After all, the Pap test is not a highly sensitive screening test, and one of the many considerations behind determining an optimum screening interval for a population-based screening programme is that such false negatives would have a high probability of being picked up at the next screen - provided that women screen regularly and the screening interval is not so long that the missed lesion should have progressed substantially. In other words, no matter how well a Pap test result history is recorded, a certain proportion of subsequent negative Pap test results will be falsely negative. Also, we did not distinguish between women who had a conventional Pap test or Liquid Based Cytology (LBC). This was because the PTR did not begin recording whether smears were obtained using LBC until July 2006. Moreover, a 2002 review by the Medical Services Advisory Committee concluded that LBC efficacy was not significantly superior to the conventional Pap test, and consequently public funding for LBC was not forthcoming. Women can elect to have LBC at a cost of ≈US$30, 19 but these were not recorded on the NSW PTR during the study period.
The number of histologically confirmed high-grade abnormalities in our study is likely to be underestimated due to a number of women (n = 1578) who had a cytological high-grade abnormality but did not appear to have a histology result recorded; or who had a histology result recorded but the histology request date was either before the cytology request date, or greater than 180 days after the cytology request date. These women were not included in the analyses of histologically confirmed high-grade cases. Some of these women may have had histological follow-up but the colposcopic examination revealed no lesions from which to take a biopsy and consequently no histology was recorded, while others may have moved interstate and their follow-up was not recorded on the NSW PTR.
As this is an observational study, it is probable that our estimates of the effect size of increasing screening intervals are influenced by selection bias, where the risk profile of women who ‘choose’ to screen at longer intervals potentially is quite different to all women who might be subjected to a longer screening interval as policy (i.e. not by ‘choice’). In the present study we found that women who screened at longer intervals tended to live in areas of lower SES, but there was no SES gradient for high-grade lesions within the screening interval categories, also confirmed by no significant SES effects found in the regression modelling.
However, it is always possible that other unmeasured confounders are biasing our results towards or away from the null. For instance, if our observed group ‘choosing’ longer screening intervals had lower mean numbers of lifetime sexual partners, or commenced sexual activity at a later age than in all target women (and for this reason chose not to screen as frequently), then the estimated effect sizes would be biased toward the null since the effect sizes in the overall population with higher prevalences of risk factors for cervical abnormalities would be higher with a longer screening interval policy. Conversely, the effect size estimates would be biased away from the null if these risk factors were higher in women ‘choosing’ the longer interval than in the target population overall (as might be expected with the generally higher health risk profile of populations that do not engage in pro-active health behaviors like screening). In the absence of a randomized controlled trial, it may be possible to assess this to some extent by comparing outcomes occurring under different programme-based screening interval policies imposed on populations with similar sociodemographic and socio-cultural characteristics, and presumably similar risk factors, as a natural experiment.
Studies conducted in other countries have arrived at similar findings to those presented here for different screening intervals with cervical cancer as the outcome. The IARC Working Group report calculated the reduction in the cumulative incidence of cancer in women aged 35-64 years who had a second negative smear as 93.5% for annual screening, 92.5% for biennial screening, 90.8% for triennial screening, 83.6% for a five year interval and 64.1% for a ten year interval. 8 Also, a cohort study by Coldman et al. 20 found that the risk of invasive squamous cervical cancer increased with time since the last negative screen. Our findings are broadly consistent with these. However, a UK study by Sasieni et al. 21 concluded that women aged under 25 years do not need to be screened, while those aged 25-49 should be screened three-yearly, and those aged 50-64 be screened five-yearly. The authors comment that invasive cervical cancer is extremely rare in women aged under 25 years, but cytological abnormalities are common. Indeed, our study found that cytological abnormalities were highest in young women, but we also found that younger women were not more likely to develop cervical cancer than older women. This is partly due to the sampling frame of the present study: a cohort of initially negative women was selected and outcomes in these women examined. Such a selection would have excluded a higher proportion of prevalent abnormalities and cancers picked up at first screen in older than in younger women. However, in Australia, in recognition of the rarity of cervical cancer but high prevalence and transience of HPV infection in younger women, the national guidelines for the follow-up of low-grade cervical abnormality (LSIL) were changed so that women aged under 30 years with LSIL were not as actively followed up or treated as previously. 6
At the time of writing, few studies had been conducted to determine an optimal screening interval in the Australian setting. The recent study by Canfell et al. 10 compared changes in cervical cancer incidence and mortality between Australia and the UK (where a three-yearly screening interval is recommended in most regions). The authors found that the introduction of organized screening was associated with similar reductions in cervical cancer incidence and mortality in both countries, and concluded that the two-yearly screening policy in Australia and the predominantly three-yearly screening policy in the UK appear to have been similarly effective. However, despite similar decreases in cervical cancer incidence and mortality since the introduction of organized screening programmes in both countries, incidence and mortality rates remain substantially higher in the UK. During 2002, cervical cancer incidence in Australia was 6.9 per 100,000 women (age standardized to the World Standard Population), and the mortality rate was 1.7 per 100,000 women. Cervical cancer incidence in the UK was 8.3 per 100,000 women and the mortality was 3.1 per 100,000 women during this period. 22
Finally, it is worth considering what higher rates of high-grade cervical abnormalities actually imply. It may be argued, for instance, that it is immaterial if more high-grade abnormalities are detected because these will be treated and cancer is still prevented. However, harms found to be associated with treatment of high-grade cervical abnormalities, particularly by cone biopsy and loop electrosurgical excision, include higher risk of birth complications such as pre-term birth, low birthweight and premature rupture of membranes. 13–16 in other words, and despite the well-documented success of cervical screening in the prevention of cervical cancer incidence and mortality, the risks of harm associated with treatment of high-grade cervical lesions are reasonably well documented and quantified, and should be minimized.
Conclusion
Our study of 1,213,295 screened women indicates that increasing the cervical screening interval from 2 to 3 years is likely to result in significantly higher proportions of high-grade abnormalities detected in women aged 20-49 years but not in older women. However, in all target women aged 20-69 years, the odds of being diagnosed with cervical cancer would be expected to increase significantly if the screening interval were increased from 2 to 3 years. Accordingly, our study provides evidence in support of retaining the recommended cervical screening interval at 2 years for HPV unvaccinated, well women.
Footnotes
Acknowledgement
The authors would like to acknowledge the thoughtful suggestions and challenges of one of the anonymous peer reviewers of this paper which improved it markedly.