
Abstract
Objectives
To estimate the total proportional incidence of interval breast cancers in a two-yearly mammography screening programme, and to perform subgroup analyses by woman's age, screening centre-specific recall rate and screening round.
Methods
Using unconverted electronic datasets from the 13 screening centres in the Emilia-Romagna Region of northern Italy (540,450 women aged 50-69 years), a database of 919,538 mammography records was created. Of these, 655,175 eligible single-mammography records (1997-2002) from 379,318 women were record-linked with the regional Breast Cancer Registry. In the two-year inter-screening interval, a total of 1,022,694.3 woman-years at risk were accumulated, with 695 interval cancers observed and 2428.3 expected. The observed number of interval cancers was divided by the expected number to obtain the proportional incidence.
Results
The total proportional incidence of first- and second-year interval cancers was 0.18 (95% CI 0.15-0.20) and 0.43 (0.39-0.47), respectively. woman's age was inversely associated with proportional incidence in both interval years, with a cut-off point at age 60. A screening centre-specific recall rate greater than the regional average of 5% was associated with a proportional incidence of 0.14 (0.11-0.17) versus 0.20 (0.17-0.24) in the first interval year, and of 0.36 (0.31-0.41) versus 0.50 (0.44-0.56) in the second. The proportional incidence remained unchanged between the first and subsequent screening rounds.
Conclusions
The results were in line with the previous Italian data and with the recommended European standards. The inverse effect of woman's age and of recall rate was expected.
Introduction
The applicability of the proportional incidence method in real world settings has limitations. First, methodological questions about the estimate of expected incidence 1 , the biases affecting the observed incidence 2 , and the definition 3 and ascertainment 4 of interval cancers remain; and secondly, non-research settings suffer from deficiencies in availability and quality of the data needed. This probably discourages researchers from targeting large populations. In fact, many previous studies have been small-sized and single-centred, and the CIs around the reported proportional incidences considerably wide. 5
The present study from Italy covered 13 unselected screening services that were diverse in operational procedures and in methods for data coding and recording. The primary objective was to estimate the total proportional incidence of interval cancers by interval year. The secondary objective was to perform subgroup analyses by three major potential determinants of mammography sensitivity, that is, the woman's age5,6, the screening centre-specific recall rate6,7 and the screening round.8,9
Methods
Setting
In the Emilia-Romagna Region of northern Italy, two-yearly mammography screening for women 50-69 years of age (n = 540,450 on 1 January 2007) was started in 1996 in two pilot communities and was gradually implemented between 1997 and 1998. The programme was organized and is being run at the health district level (n= 13). The screening centres (one per district) were established in the existing mammography services. All eligible women receive a personal appointment letter. Self-referral is accepted, provided that the woman is eligible. Selected early rescreening policies are practiced. All women have a two-view mammography with independent double reading. Women with positive results are contacted in person by telephone. Mammography, diagnostic assessment and treatment were are of charge. Further details are given elsewhere. 10
Mammography records
The present study was planned on behalf of the regional Department of Health and in conjunction with a programme for radiological surveillance of interval breast cancers. Mainly for this reason, the study objective was to specifically evaluate the mammography sensitivity rather than the ‘screening episode’ sensitivity.6,11 Each district screening centre was requested to extract from the service database an unconverted (undecoded) dataset containing all nominative records of women undergoing mammography between 1997 and 2002. The 10 extraction variables included district number, woman's identifying number, first name, last name, date of birth, municipality of residence and - for each mammography - filing number, date, indication and result (s). Topography (that is, laterality and quadrant) was extracted if available. The datasets were formatted to protocol specifications as tab-delimited text files or Microsoft Access files and were sent to the Romagna Cancer Registry (coordinating centre) in an encrypted format through the intranet linking the health-service institutions of the study area. On receipt, the datasets were checked for conformity of field names and field properties, then imported into the Stata statistical package (StataCorp Ltd, College Station, TX, USA) and were merged into a single dataset.
Two fields were edited, namely the indication for mammography (for example: invitation, self-referral, diagnostic assessment, etc.) and the result. The attribute codes were decoded into text descriptions using conversion tables from each screening centre. In view of the variety of screening procedures and coding criteria employed, the following assumptions were made: (1) mammographics recorded within 24 months of a positive mammography were for follow-up purposes; (2) early rescreening mammographics were for basic screening purposes and not for follow-up purposes; (3) the result of a mammography reported as negative (also including codes for benign radiological features) with recommendation for early (<24 months) rescreening was negative; 12 (4) the result of a mammography reported as negative with recommendation for diagnostic assessment was positive; (5) the result of a mammography reported as negative and followed by diagnostic assessment investigations - recorded as such without clinical indications - was positive; and (6) the result of a positive mammography with negative diagnostic assessment remained positive.
The dataset comprised 919,538 records. The number of records per mammography varied between 1 and 6 depending on the originating centre. Redundant records for the same mammography were excluded. Of the remaining, those that met the following criteria were selected for analysis: (1) date between 1997 and 2002; (2) woman's age 50-69 years; (3) invitation to screening or self-referral without symptoms as indication for mammography; (4) negative result; and (5) at least one day of follow up. There were 655,175 such records from 379,318 women, for an average of 1.7 per woman.
Definition of interval cancer
An interval breast cancer was defined as an invasive cancer that arose clinically within two years of any one of the above 655,175 mammographics and before the date of any censoring event (see the Statistical methods section). This definition also applied to (1) cancers diagnosed in lapsed attenders, that is, in women aged >69 years with a previous eligible negative mammography 3 and (2) cancers occurring in women whose last mammography was negative and who declined subsequent invitations. 13
Identification of interval cancers
Since 1997, four general cancer registries (covering 50% of the population since the mid-1980s) and four breast cancer registries have maintained the Breast Cancer Registry of the Emilia-Romagna Region, specifically designed for monitoring and evaluation of the screening programme. For this purpose, conventional registration variables have been supplemented by items of information on tumour stage, treatment, detection mode and date of last mammography.
To identify the interval cancer patients, the mammography dataset was record-linked with the Breast Cancer Registry (years 1997-2002) using the first name, the last name, the date of birth and the date of last mammography, as well as partial combinations of these attributes. The screening centres were asked to run manual data checks against the service databases for (1) failed matches, (2) partial matches, (3) successful matches with inconsistency between the registered detection mode and that suggested by the mammography data and (4) multiple matches, that is, those between one cancer case record and multiple mammography records from different women.
Statistical methods
All estimates were interval year-specific. For the first year, woman-years at risk (WYR) were calculated from the date of each negative mammography to the date of diagnosis of interval cancer or the date of next mammography or the 365th day of interval or 31 December 2002, whichever occurred first. These censoring dates were also used for the second interval year. The effect of death was estimated by reducing the WYR in proportion to expected deaths based on the annual age-specific mortality rates from all causes in the general population.
Breast cancer incidence records from the general cancer registries of the study area were obtained from the centralized database of the Italian Association of Cancer Registries. To determine the number of invasive cancers that would be expected if screening had not taken place, the calculated average regional age-specific (in 5-year age blocks from 50 to 75 years) incidence rates for the years 1991-1995 were multiplied by the appropriate number of WYR.
The observed number of interval cancers was divided by the expected number to obtain their proportional incidence. The 95% CI around the observed:expected (0:E) ratio was estimated assuming a Poisson distribution of the observed cases.
In separate analyses, the WYR were grouped by woman's age at negative mammography (in 5-year blocks), screening centre-specific recall rate (<5% versus >5%, that is, the whole-number value nearest to the average regional level of 5.3%) and screening round (first versus subsequent, that is, second to fourth). For each district screening centre, the recall rate was calculated for the same time period in which the eligible negative mammographics were recorded. The expected number of cancers among women screened in centres with recall rates <5% and >5% was calculated using estimates of the average age-specific incidence rates in the population of the two groups of health districts (1991-1995). Pair-wise differences in proportional incidence were evaluated with the calculation of the ratio of 0:E ratios with the 95% CI. 14
Results
Table 1 shows that the total proportional incidence of interval breast cancers was 0.18 in the first year and 0.43 in the second year. The data were based on a total of 1,022,694.3 WYR with 695 interval cancers observed and 2428.3 expected.
Total proportional incidence of interval breast cancers
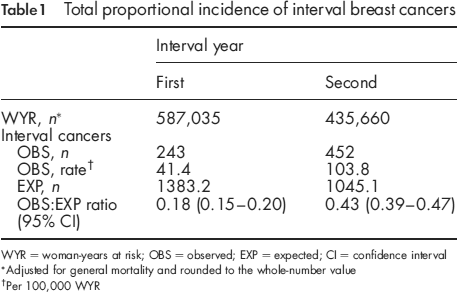
WYR = woman-years at risk; OBS = observed; EXP = expected; CI = confidence interval
Adjusted for general mortality and rounded to the whole-number value
Per 100,000 WYR
In the upper section of Table 2, a subgroup analysis by woman's age at negative mammography is shown. The age of 60 years acted as a cut-off point separating two distinct subpopulations. In both interval years, the results neither varied significantly between 50 and 59 years nor between 60 and 69 years, whereas conversely the two older five-year age groups had a significantly lower proportional incidence of interval cancers than the two younger age groups. In the first interval year, the ratio of 0:E ratios between women aged 60-64 years and those aged 50-54 and 55-59 years was 0.54 (95% CI 0.37-0.77) and 0.62 (95% CI 0.43-0.91), respectively. For women aged 65-69 years, the same comparisons gave a ratio of 0.51 (95% CI 0.35-0.75) and 0.59 (95% CI 0.40-0.88). In the second interval year, a similar pattern of results was found. The corresponding ratios of 0:E ratios were 0.67 (95% CI 0.51-0.87), 0.71 (95% CI 0.55-0.93), 0.57 (95% CI 0.43-0.76) and 0.61 (95% CI 0.46-0.81), respectively.
Proportional incidence of interval breast cancers by woman's age, screening centre-specific recall rate and screening round
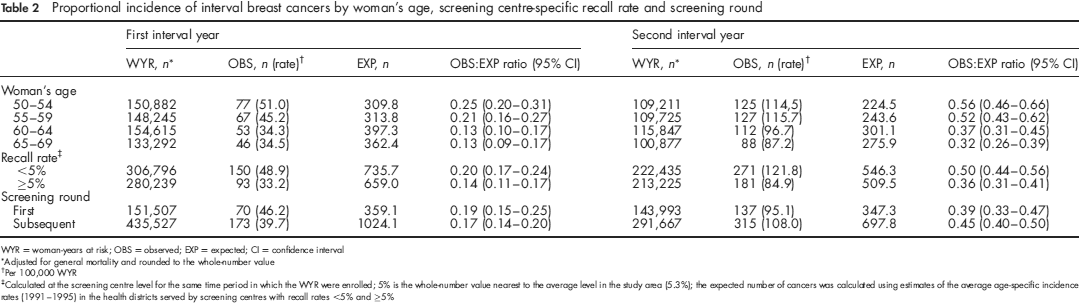
WYR = woman-years at risk; OBS = observed; EXP = expected; CI = confidence interval
Adjusted for general mortality and rounded to the whole-number value
Per 100,000 WYR
Calculated at the screening centre level for the same time period in which the WYR were enrolled; 5% is the whole-number value nearest to the average level in the study area (5.3%); the expected number of cancers was calculated using estimates of the average age-specific incidence rates (1991-1995) in the health districts served by screening centres with recall rates <5% and >5%
In the middle section of Table 2, the results were grouped according to the screening centre-specific recall rate. Women tested negative in those centres (n = 7) with a recall rate equal or above the regional average of 5% (mean 7.4%; range 5.8-9.6%) experienced a significantly lower proportional incidence of interval cancers than women from screening centres (n = 6) with recall rates <5% (mean 3.3%; range 2.2-4.5%). The ratio of 0:E ratios was 0.69 (95% CI 0.53-0.90) in the first interval year and 0.72 (95% CI 0.59-0.87) in the second interval year.
The bottom section of Table 2 shows that the proportional incidence of interval cancers remained substantially unchanged between the first screening round (average duration 29 months) and subsequent rounds. The ratios of 0:E ratios (subsequent versus first) were 0.87 (95% CI 0.65-1.16) in the first interval year and 1.14 (95% CI 0.93-1.41) in the second interval year.
Discussion
This study confirms that the proportional incidence of interval breast cancers can be estimated on a relatively large scale 15 , even involving multiple non-research-oriented screening settings. The electronic data collected were not only diverse in coding methods, but they also reflected different screening procedures, particularly in the classification and management of borderline mammography results. With an analytical approach to original data and methods, coupled with systematic checks at the local level, we were able to identify a homogeneous population of women with eligible mammographics.
To some extent, the plausibility of results supports the validity of methods. The total proportional incidence in the first and second interval year (0.18 and 0.43) was almost identical to that recently reported by three smaller Italian studies. 16–18 The limits recommended by the European guidelines 19 are 0.30 and 0.50, respectively. For the first interval year, a meta-analysis study has estimated a value of 0.19 in screening trials and 0.27 in public health settings. 5 For the second year, previous results have generally varied between 0.40 and 0.60.12,15,20–25
The relatively low proportional incidence of interval cancers in the Italian studies, especially for the first interval year, has been noted. 5 The use of two-view mammograms with double reading is a favourable condition. In the present study, further explanations can be found in the results of subgroup analyses. Factors underlying the observed level of mammography sensitivity are likely to include: (1) the comparatively high average age of screening participants 10 , (2) the high average recall rate6,7 and (3) the longstanding staff stability of breast radiologists, that is, their experience with asymptomatic women.
The first of these factors, the woman's age, has been observed in some past studies to have weak or non-significant effects on mammography sensitivity.5,6,8,16 The present study offered evidence for a strong inverse association of woman's age with proportional incidence of interval cancers in both interval years. More specifically, interval cancer rates decreased marginally between 50-54 and 55-59 years of age, and dropped markedly and significantly among older women. We have no data to determine to what extent the age prevalence of hormone replacement therapy among screening participants interacted with the basic role of breast density in the age pattern of mammography sensitivity. In any case, our results confirm the view 6 that non-age-adjusted comparisons between studies of interval breast cancer incidence are unwarranted.
For the second factor studied, the recall rate, the few literature data available suggest an association with mammography sensitivity. In one previous study from the Netherlands, the largest decrease in interval cancer rate was observed when increasing the recall rate from 1 to 2%. 7 For further increases up to 10%, the gain in sensitivity diminished. A study from Finland confirmed the association, although the analysis was focused on recall rates <3.5%. 6 In the present study, the regional average was as high as 5%. For the subpopulation of women tested negative in screening centres with recall rates above that level, the proportional incidence of interval cancers was significantly lower.
Thirdly, improvements in the technical quality of mammography and in the radiologists’ reading of films 12 have been suggested to explain the finding of a decrease in interval cancer rates after 2-3 years since the initiation of screening8,9 or later. 26 More often, mammography sensitivity has been reported to be stable over the course of the programme,5,15,24,27 and this is also the case for the present study. A likely explanation is that the learning curve of breast radiologists in Italy, due to the low rate of turnover of medical personnel over the last 15 years, has levelled-off before the start of organized screening.
A decrease in mammography sensitivity after the initial round 13 or later 6 has occasionally been observed. This trend might be related to increasing use of hormone replacement therapy and of early repeat mammography outside the screening system 6 , but not to detection and removal of prevalent cancers at the initial round. In fact, unlike the ‘detection method’ of estimating the mammography sensitivity, the proportional incidence method is not subjected to the effects of lead time or length bias, or overdiagnosis.6,19 On the contrary, first round cancer detections could have the opposite effect, that is, an overestimate of sensitivity at subsequent rounds. The reason is that some of the cancers apparently detected by rescreening mammographics may have been picked-up by first screen mammographics. 8 It is worthy to note that this potential bias applies only to a limited extent to the present study, since many (most, in some districts) women who participated in the first screening round had already had at least one previous mammography.
There are methodological issues in assessing the risk of interval cancer that warrant attention. First, it is problematic to get a truly reliable estimate of the underlying incidence. 24 If incidence rates are biased, the linear extrapolation of pre-screening time trends to the screening years may amplify the bias. 2 The study area has been covered by cancer registration since the 1980s. At the end of that decade, high rates of opportunistic screening and a 30% excess incidence of breast cancer were observed in middle-aged women living in one district. 28 Whether pre-screening incidence was inflated on a regional scale is speculative, but using incidence rates alone was assumed to compensate for this source of error better than the linear extrapolation of their trends.
Secondly, the definition of interval breast cancer and of eligible mammography varies between studies.3,29 It has been found that there are discrepancies even in applying agreed definitions. 29 In some papers, the terminology denoting the indication for last mammography in the eligibility criteria has been ambiguous (for example, non-routine visit 8 , and initial assessment) 24 or the study criteria have not been detailed. Some of our methods may thus differ in part from those of some previous studies. The most unexpected situation was that of a small number of mammographics reported as negative (also including codes for benign radiological features) but followed by diagnostic assessment with or without formal recommendation. We reclassified these mammography results as positive based on the same criterion as that used in the pivotal case-control study by the IARC Working Group on the evaluation of cervical screening. 30 In that study, negative and benign screening results leading to further actions were considered to be non-negative from an operational point of view. We also excluded from evaluation those positive mammographics with negative diagnostic assessment, that are eligible only to a study of screening episode sensitivity.6,11 In our case series, there were 42 cancers clinically diagnosed during the first (n = 9) and the second year (n = 33) after a negative assessment among otherwise eligible patients. As interval cancers diagnosed after a negative mammography were 695, it appears that assessment failures accounted for a marginal 6% of the total 737 interval cancers according to the definition of episode sensitivity. Nevertheless, post-assessment interval cancers will have to be carefully investigated.
Thirdly, the date of diagnosis recorded by cancer registries is the date of first pathology report or first hospital admission and not that of the onset of symptoms. 5 This results in a shift in time of part of first-year cancers to the second interval year. This temporal bias might explain why, in the present and many other service studies,16,17,20,21,23,31 the increase in proportional incidence from the first to the second interval year has been sharper than in the Two-County trial. 32 In non-research settings, and especially during the initial round, the increased length of surgical waiting lists may delay the registration of interval cancers.
Finally, contrasting effects may derive from rescreening procedures. On the one hand, cancer detection by those repeat mammographics that are performed before two years have completely elapsed acts as a competing risk for the occurrence of interval cancers.3,8 On the other hand, rescreening may also inflate their incidence. Re-invitation to mammography may focus the woman's attention on breast symptoms and prompt her to seek diagnosis in a clinical facility. 31 Among asymptomatic women, those placed on early rescreening have an increased likelihood of seeking repeat mammography outside the programme. 33
Practical and theoretical problems, however, do not weaken the rationale for engaging the screening services in the evaluation of proportional incidence of interval cancers. 24 As far as the present study is concerned, the results are well in line with previous Italian data, and are compatible with the recommended European standards.
Footnotes
Acknowledgements
Stefano Ferretti (Ferrara Cancer Registry) provided the estimate of expected incidence rates using the centralized database of the Italian Association of Cancer Registries. The following gave valuable assistance in data collection and processing: Elisa Artioli, Antonella Bagni, Paola Baldazzi, Gian Piero Baraldi, Vittorio Bertolini, Francesco Bozzani, Debora Canuti, Licia Caprara, Antonella Cattani, Natalina Collina, Giovanni Maria Conti, Vincenzo De Lisi, Claudio Fava, Giorgio Gatti, Rita Guadalupi, Claudia Imolesi, Marilena Manfredi, Silvia Marzocchi, Gian Carlo Monti, Rossella Negri, Chiara Petrucci, Monica Serafini, Rosa Vattiato, Benedetta Vitali and Marella Zatelli. The authors thank Marcello Vettorazzi (Venetian Tumour Registry) for his encouragement and suggestions. This study was presented at the Annual Meeting of the Italian Group for Mammography Screening, Peschiera del Garda (Verona), 11 October 2007.