
Abstract
Background
There is a negative glucose gradient between the capillary and venous systems, produced by glucose uptake into peripheral tissues. This gradient is augmented by oral glucose ingestion in healthy volunteers; thus prandial status may impact on capillary glucose meter performance. Our primary aim was to investigate whether the (capillary-venous plasma) glucose difference changed in relation to prandial status, in healthy volunteers.
Methods
Glucose was measured fasting and also one hour after an ad libitum breakfast, in 103 healthy volunteers. Duplicate capillary (finger stick) measurements were undertaken at both time points, using both the FreeStyle Lite and AccuChek Performa meters. Simultaneous venous (antecubital fossa) samples were centrifuged immediately after collection and plasma glucose was measured using the laboratory hexokinase method. Results were compared by Bland-Altman difference analysis.
Results
The mean (95% CI) pre- and postprandial (capillary-plasma) glucose differences (mmol/L) were calculated for each meter. For the Freestyle Lite, the preprandial difference was 20.51 (20.58 to 20.45) and postprandial difference was 0.81 (0.69-0.94). Corresponding differences for the Performa were 20.13 (20.20 to 20.06) and 1.19 (1.07-1.31), respectively. T-test comparison of participants’ paired pre- and postprandial (capillary-plasma) glucose differences confirmed a significant meal-related change in glucose estimation for both meters (P < 0.0001). Also, both meters read highest at lower glucose concentrations.
Conclusions
In healthy volunteers, both glucose meters showed a systematic positive bias one hour after breakfast. The significance of this finding in diabetes remains to be determined.
Introduction
Self-monitoring of blood glucose is of established benefit in the management of diabetic patients requiring insulin therapy and is also used to facilitate therapeutic decisions.1–4 Glucose meter values for whole-blood capillary (‘finger stick’) glucose should ideally be calibrated to give a reading that is identical to that of the venous plasma glucose, measured in the laboratory.5–7 In the fasting state, the glucose concentration of capillary whole blood is approximately 11% lower than that of venous plasma glucose, predominantly due to differences in water content between the two samples.6,8 Empirical correction factors have therefore been introduced into the glucose meter algorithms when converting an electrochemical signal into a blood glucose reading, allowing results to be presented as a venous plasma equivalent. 5 In addition to this, there is an arterio-venous glucose gradient which is well described in healthy volunteers as becoming more pronounced following a carbohydrate load and appears to be maximal at one hour.8–11 The impact of this variable capillary–venous glucose gradient on the comparison of glucose meter results with contemporaneous venous plasma glucose has yet to be determined. We therefore hypothesized that glucose meter/strip systems would show augmented differences in glucose concentration, when comparing the pre- and postprandial capillary with venous samples, from healthy volunteers.
Patients and methods
Participants
Healthy volunteers aged 18–45 y inclusive and with no known history of diabetes were recruited through local advertisements. Respondents included students, hospital staff and members of the general public. Participants reported to a research clinic in the morning, after a minimum of an eight-hour overnight fast. Informed consent was obtained prior to sample collection.
Assessment of glucose meter performance
Two commonly used glucose meter/strip systems were studied; FreeStyle Lite (Abbott Diabetes Care Inc., Alameda, CA, USA) and Performa (AccuChek Performa, Roche Diagnostics, Mannheim, Germany). Meters from two different manufacturers were used as this allowed us to determine whether (capillary–venous plasma) glucose differences were generic or meter-specific. The strips for both meters used a glucose dehydrogenase-based system. The methodology used to assess glucose meter performance has been described previously; however, preanalytical error was further reduced in the current study by centrifugation of venous samples immediately after collection.11–15 Specialized diabetes research nurses supervised sample collection, which was undertaken by diabetes research nurses and medical personnel.
Participants were asked to wash and dry their hands thoroughly prior to capillary sample collection. Capillary blood samples for all four meters were obtained from the same puncture site using a disposable lancet. A venous blood sample was drawn from the antecubital fossa of the same arm immediately following capillary sample collection. Two separate venepunctures were undertaken, in the fasting state and one hour after breakfast. Venous blood was collected into a lithium heparin vacutainer tube for glucose measurement and also into an ethylenediaminetetraacetic acid tube, for measurement of haematocrit. The lithium heparin tube was centrifuged immediately at 3000 revolutions per minute for 15 min and plasma extracted. Samples were analysed at an accredited laboratory during the morning of their collection. Plasma glucose was assessed using the Abbott C8000 analyzer (Abbott Diagnostics, North Chicago, IL, USA) using the glucose hexokinase method (coefficient of variation <2%).
Following venesection, participants were provided with a continental breakfast consisting of a selection of foods and drinks, each of which had a predetermined carbohydrate content. Participants were asked to eat ‘to appetite’. A checklist was provided for participants to document their breakfast intake. Total carbohydrate intake was calculated from this checklist and results were rechecked by the researchers. Participants were then asked to remain seated in the research clinic for one hour prior to final sample collection. The postprandial glucose measurements took place approximately 60 min following breakfast and utilized the same procedure as for the fasting samples. Participants were asked to wash and dry their hands prior to sample collection.
Meter imprecision
Prior to capillary sample collection on all study days, each glucose meter was validated by testing against high and low control solutions. Intraday variation of each meter system was also assessed by replicate analysis (n = 20) of both the high and low control solutions.
Statistical methods
Duplicate capillary samples, obtained from two meters of the same type at the same time point, were averaged prior to analysis of capillary results. Data were stored in Microsoft Excel and results exported to MedCalc (MedCalc Software Version 12, Mariakerke, Belgium) for all analyses. Initial comparisons of capillary and venous results were undertaken using linear regression, followed by assessment of the point estimate of the mean (capillary–plasma) differences with 95% confidence intervals. Further method agreement estimations were then undertaken as described by Bland and Altman. 16 The agreement between capillary and venous plasma glucose measurements was plotted as the (capillary–plasma) glucose difference, against the average of these two methods. This was done for both meters in the fasting and postprandial state, for each study participant. 16 Visual representation of these results also used the format outlined by Bland and Altman; 16 this included meter bias shown as the mean (capillary–plasma) glucose difference and also the 1.96 SD limits of agreement. Further analyses were undertaken using linear regression to assess the correlation between the (capillary–plasma) glucose difference and the prevailing glucose concentration, the relationship between postprandial sample timing and the (capillary–plasma) difference, and the relationships between carbohydrate intake and postprandial venous plasma glucose, prandial difference in plasma glucose and postprandial (capillary–plasma) glucose, in both men and women. Paired two tailed t-tests were performed on the mean (capillary–plasma) glucose discrepancy between pre- and postprandial states. Unpaired two-tailed t-tests were used to compare the carbohydrate intake between men and women. P < 0.05 was considered to be significant.
This study was approved by the Upper South B Regional Ethics Committee, New Zealand.
Results
Participant characteristics and carbohydrate ingestion
Data were analysed from a total of 103 participants over 54 study days between January 2011 and November 2011. Of these participants, 45 were men and 79 were of European ethnicity. The participants’ median age was 25 y. The haematocrit ranged from 0.36 to 0.51, which is within an acceptable range for optimal meter performance, according to the manufacturers’ instructions. The participants’ (n = 103) carbohydrate intake ranged from 24.2 to 296.8 g. This wide spread of carbohydrate intake was partly gender-related, with a mean carbohydrate intake (95% CI) for men and women of 99.3 g (86.8–111.7) and 79.3 g (69.0–89.5), respectively, P = 0.014. The mean venous plasma glucose was 5.27 mmol/L fasting and 4.68 mmol/L postprandially, giving a postprandial drop in glucose of 0.59 mmol/L (95% CI 0.81–0.37). Two participants showed a marked rise in postprandial plasma glucose of 4.3 and 3.7 mmol/L from a baseline of 5.3 and 5.9 mmol/L, respectively. However, none of the participants were found to have any underlying medical problems such as diabetes, which might have required their exclusion from analysis.
Impact of prandial status on overall bias (capillary–plasma) difference and proportional bias
Figure 1 shows a summary of the pooled fasting and postbreakfast results (n = 206) from both meters against plasma glucose, with prandial status indicated by colour for individual glucose values. A line of equality (y = x) has been included to provide a visual representation of a perfect fit between glucose meter and plasma glucose values. The mean (capillary–plasma) differences (95% CI) for the 206 pooled results were 0.15 mmol/L (0.035–0.26) for the Freestyle Lite meter and 0.53 mmol/L (0.42–0.65) for the Performa meter.
Pooled results (n = 206) comparing the FreeStyle Lite (a) and Performa (b) capillary glucose meter readings with venous plasma glucose. Both graphs show fasting samples (red triangles), postprandial samples (black circles) and also a line of equality (dashed line) which corresponds to a theoretical line where capillary and plasma glucose concentrations are identical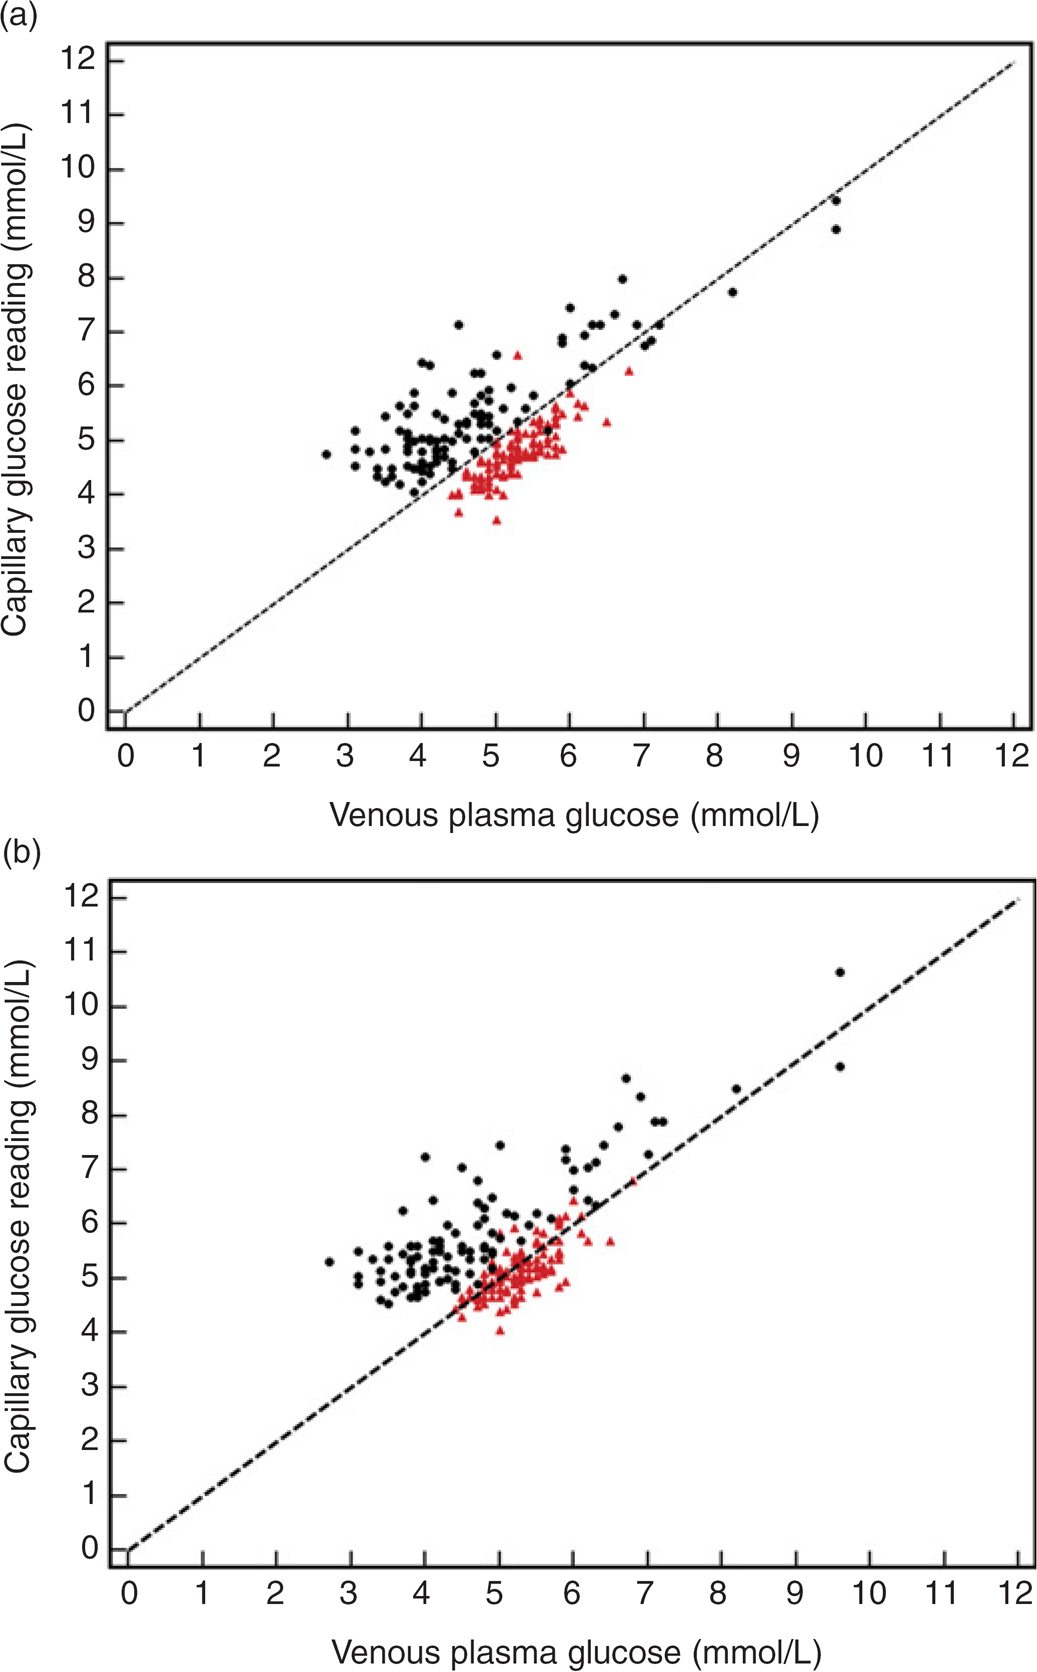
For the FreeStyle Lite meter, the mean (capillary–plasma) difference (95% CI for the mean) was 20.51 mmol/L (20.58 to 20.45) preprandially and 0.81 mmol/L (0.69–0.94) for postprandial samples. The corresponding results for the Performa meter were 20.13 mmol/L (20.20 to 20.06) and 1.19 mmol/L (1.07–1.31). There was a statistically significant difference between the average (capillary–plasma) discrepancy in the pre- and postprandial states for the FreeStyle Lite meter (t = 19.78, P < 0.0001) and Performa meter (t = 19.93, P < 0.0001). Bland–Altman plots showing the mean capillary and venous glucose measurements along the x-axis, against the (capillary–plasma) difference along the y-axis and the 1.96 SD limits of agreement for each meter in both fasting and postprandial states, are shown in Figure 2.
Bland-Altman plots to assess for the agreement between capillary and venous plasma glucose measurements for the FreeStyle Lite meter (a, preprandial; b, postprandial) and Performa meter (c, preprandial; d, postprandial). The mean [capillary–plasma] glucose difference and limits of agreement (+/-1.96 SD) are shown by the black dotted lines. The 0 difference line, where there is no difference between capillary and venous plasma glucose measurements, has been included for reference (solid black line). Mean [capillary–plasma] glucose difference (limits of agreement) are listed for each plot: a, -0.51 mmol/L (-1.14 to 0.12); b, 0.81 mmol/L (-0.45 to 2.07); c, -0.13 mmol/L (-0.79 to 0.54); d, 1.19 mmol/L (-0.04 to 2.42)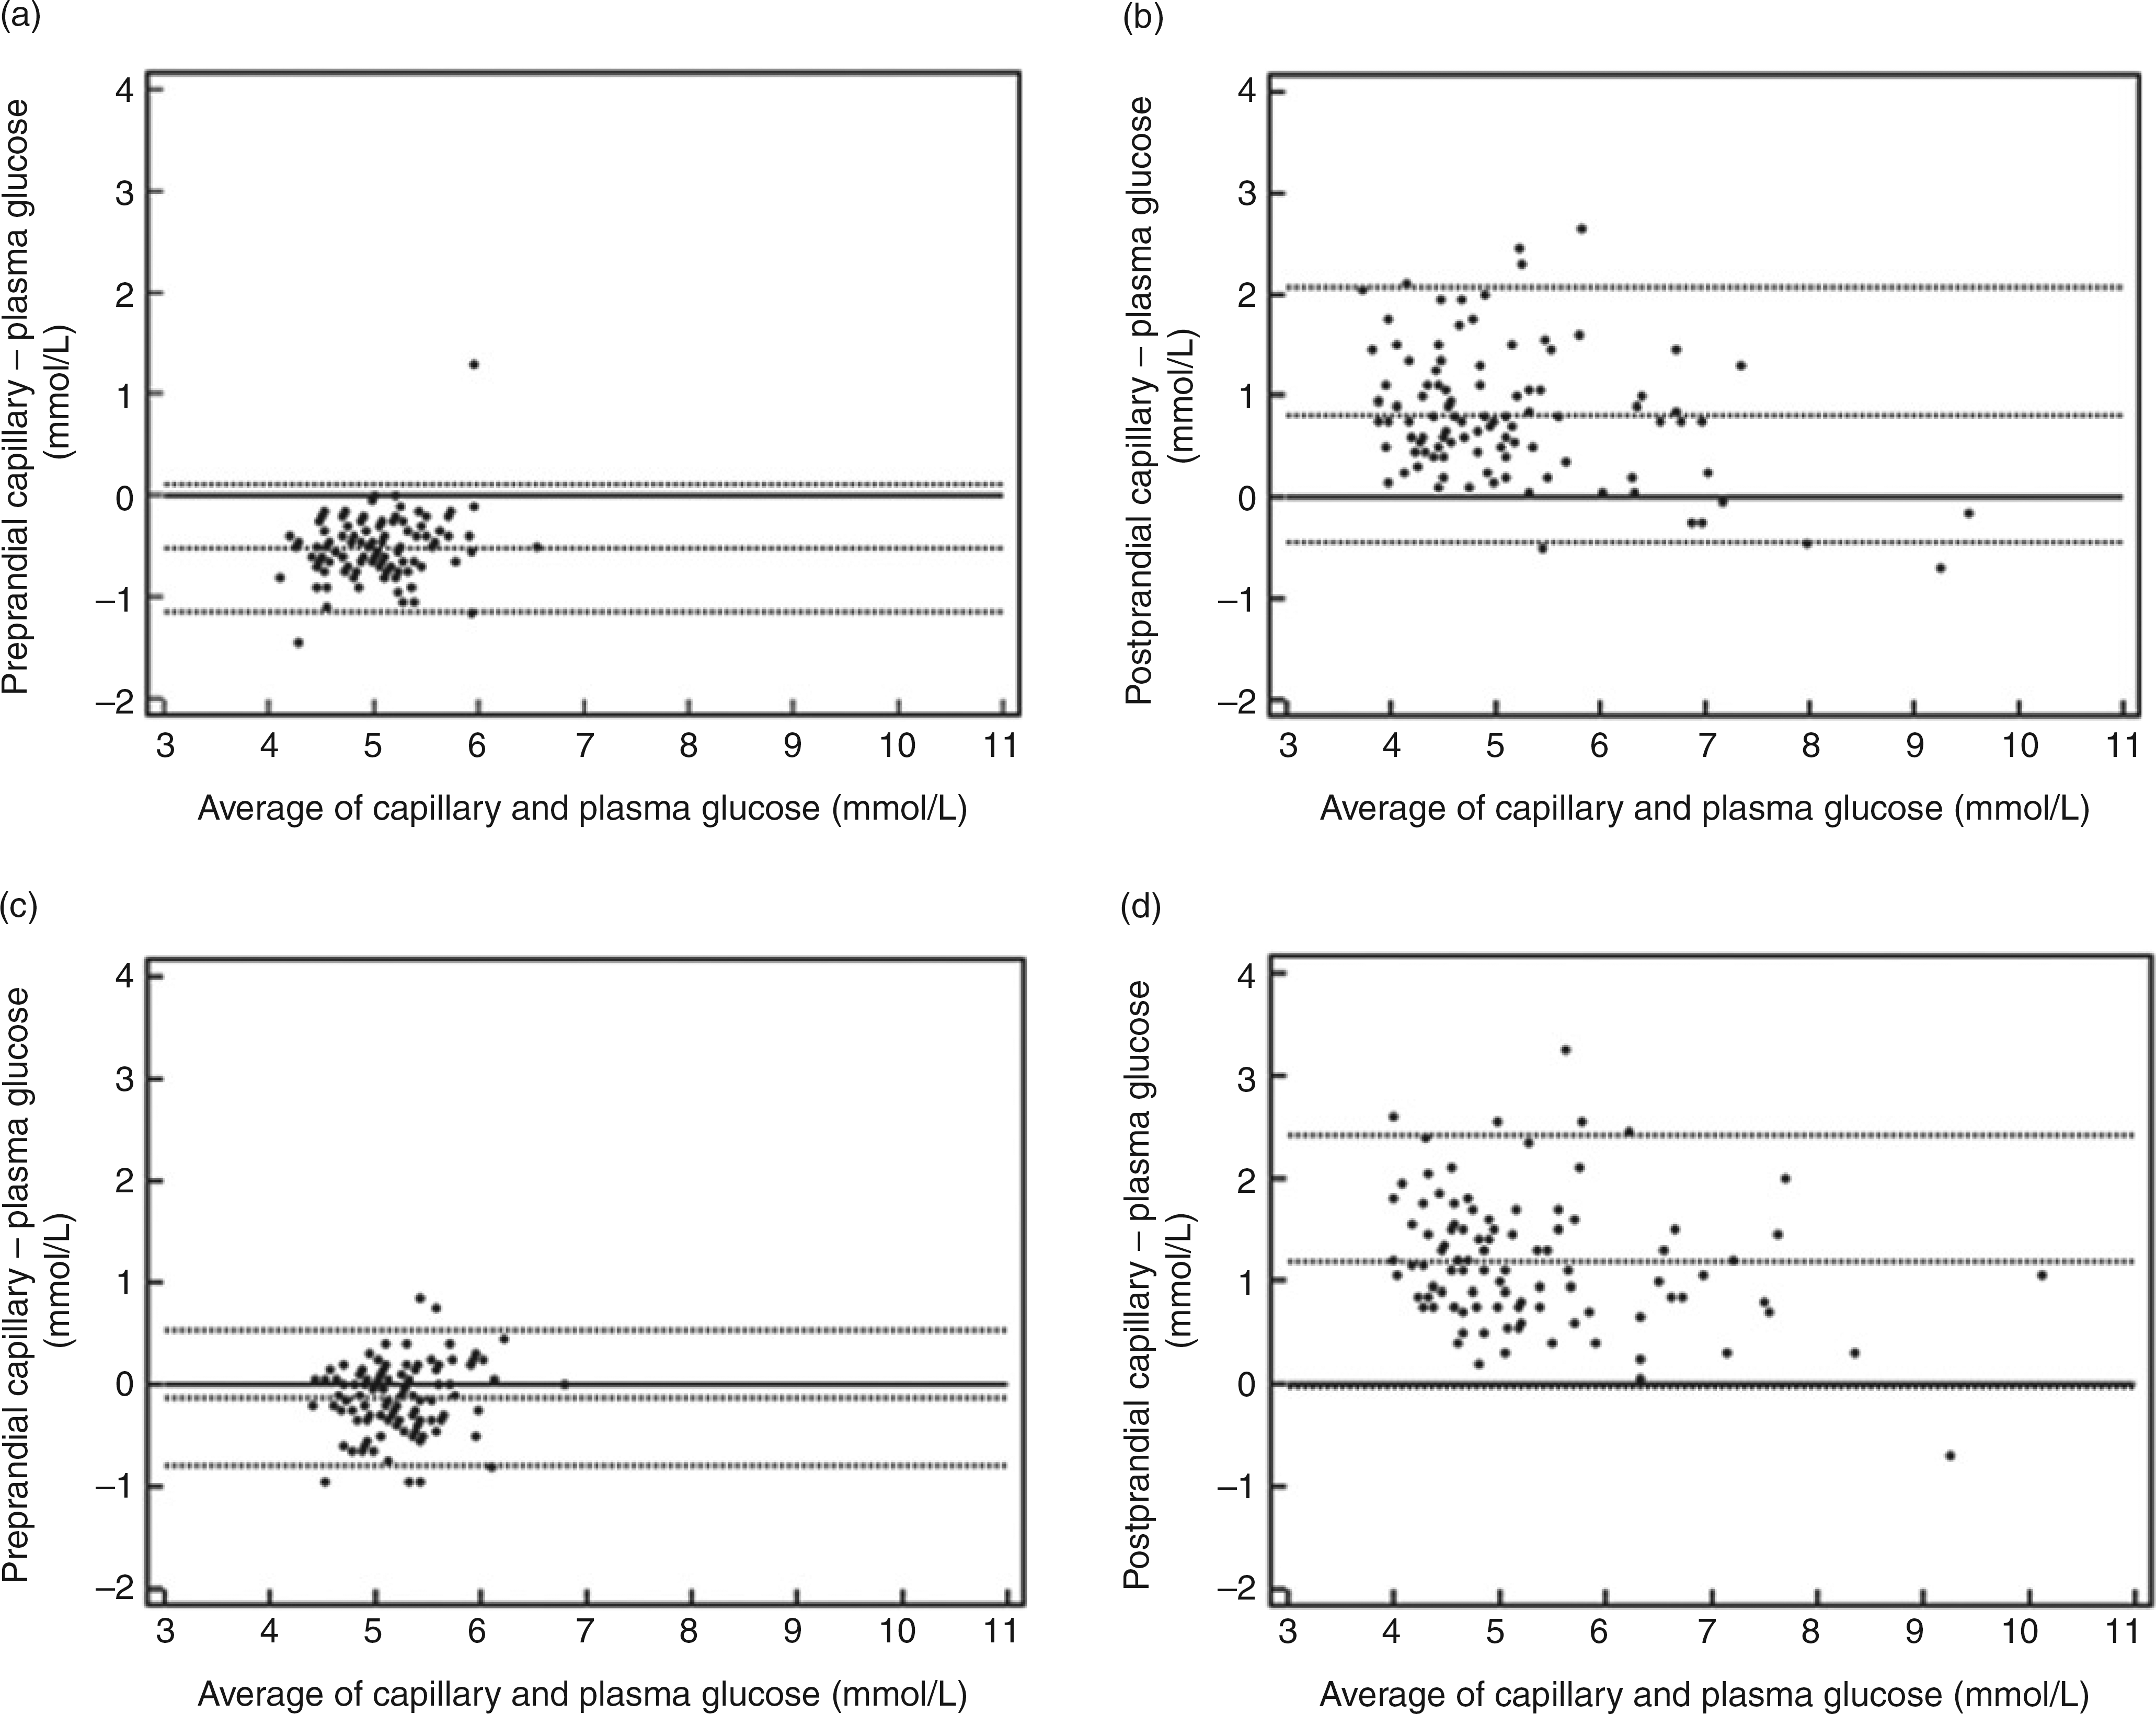
Further examination of these Bland–Altman plots showed evidence of proportional bias when comparing the prevailing glucose level (average of capillary and plasma concentrations, see x-axis in Figures 2b and d) with the (capillary–plasma) glucose difference for both meters in the postprandial state (see y-axis Figures 2b and d); FreeStyle Lite (r = 20.33, P = 0.0006), Performa (r = 20.25, P = 0.01). The correlation between these variables in the fasting state was FreeStyle Lite (r = 0.24, P = 0.02) and Performa (r = 0.15, P = 0.14).
Figure 3 shows a comparison of the postprandial (capillary–plasma) value with the (pre2postprandial) change in plasma glucose for each glucose meter. Visual inspection of Figure 3 suggests that participants showing the largest fall in plasma glucose following breakfast have postprandial venous plasma glucose values that were lower than the corresponding capillary glucose values.
Comparison of the postprandial [capillary–venous] discrepancy for the FreeStyle Lite (a) and Performa (b) meters, with the [postbreakfast–fasting] venous plasma glucose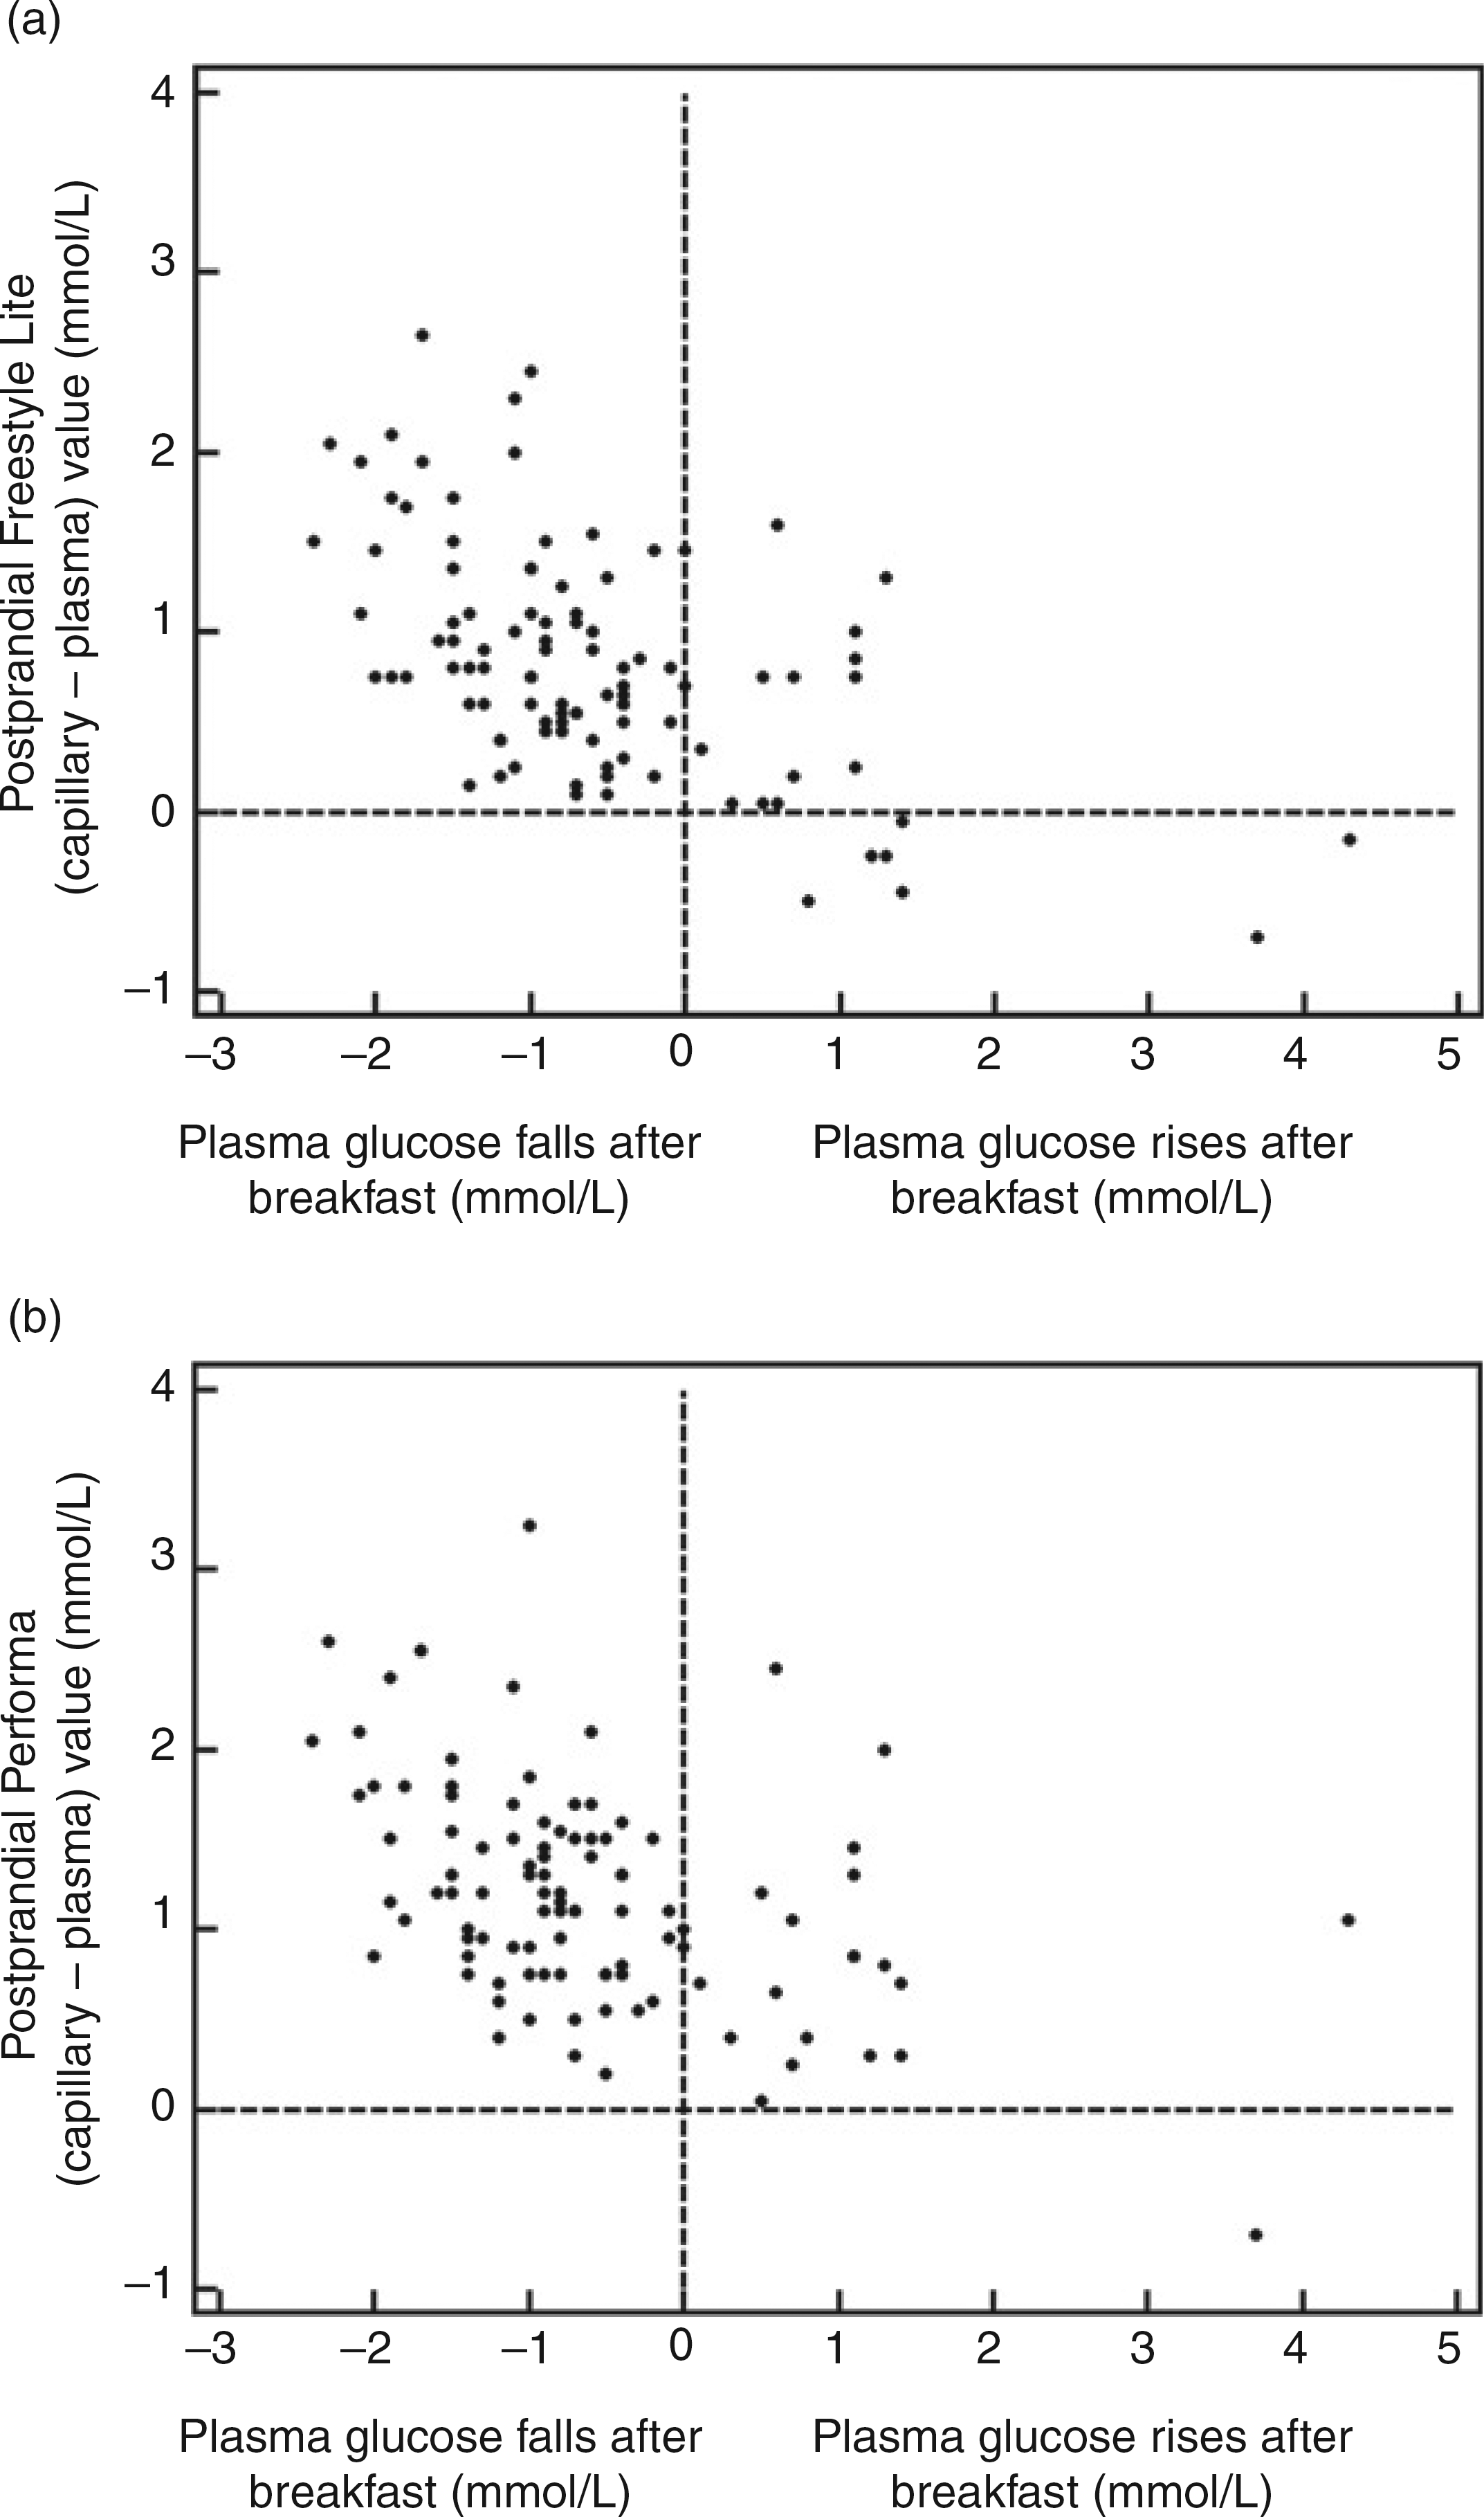
Exploration of relationships between time of postmeal sampling, carbohydrate load and also gender and the (capillary–plasma) glucose difference
Postprandial blood samples were collected 53–92 min (mean 67 min) after breakfast. No relationship was seen between the timing of postprandial sample collection and the postmeal difference in (capillary–plasma) glucose for either of the meters studied (FreeStyle Lite – R2 < 0.01, P = 0.37, Performa – R2 < 0.001, P = 0.78). No significant relationships were seen between an individual's carbohydrate intake and any of the following: postprandial plasma glucose level (R2 = 0.01, P = 0.30), prandial difference in plasma glucose (R2 < 0.0001, P = 0.99), postprandial (capillary–plasma) value for the FreeStyle Lite (R2 = 0.001, P = 0.75), postprandial (capillary–plasma) value for the Performa (R2 = 0.015, P = 0.21).
A gender difference was observed in carbohydrate intake as discussed above and further analyses therefore included the effect of gender. There was no significant effect of gender on the observed (pre2postprandial) difference in plasma glucose (t = -1.293, P = 0.20). Also, there were no significant relationships between carbohydrate intake and the prandial difference in plasma glucose for men (R2 = 0.070, P = 0.08) or women (R2 = 0.035, P = 0.16) participants.
Meter imprecision
During the study, all meter/strip values obtained from high and low controls fell within the manufacturers’ recommended meter performance range. These day-to-day control values and also results from replicate samples are outlined in Table 1.
Results of inter- and intra-day precision of capillary glucose meters tested against control solutions
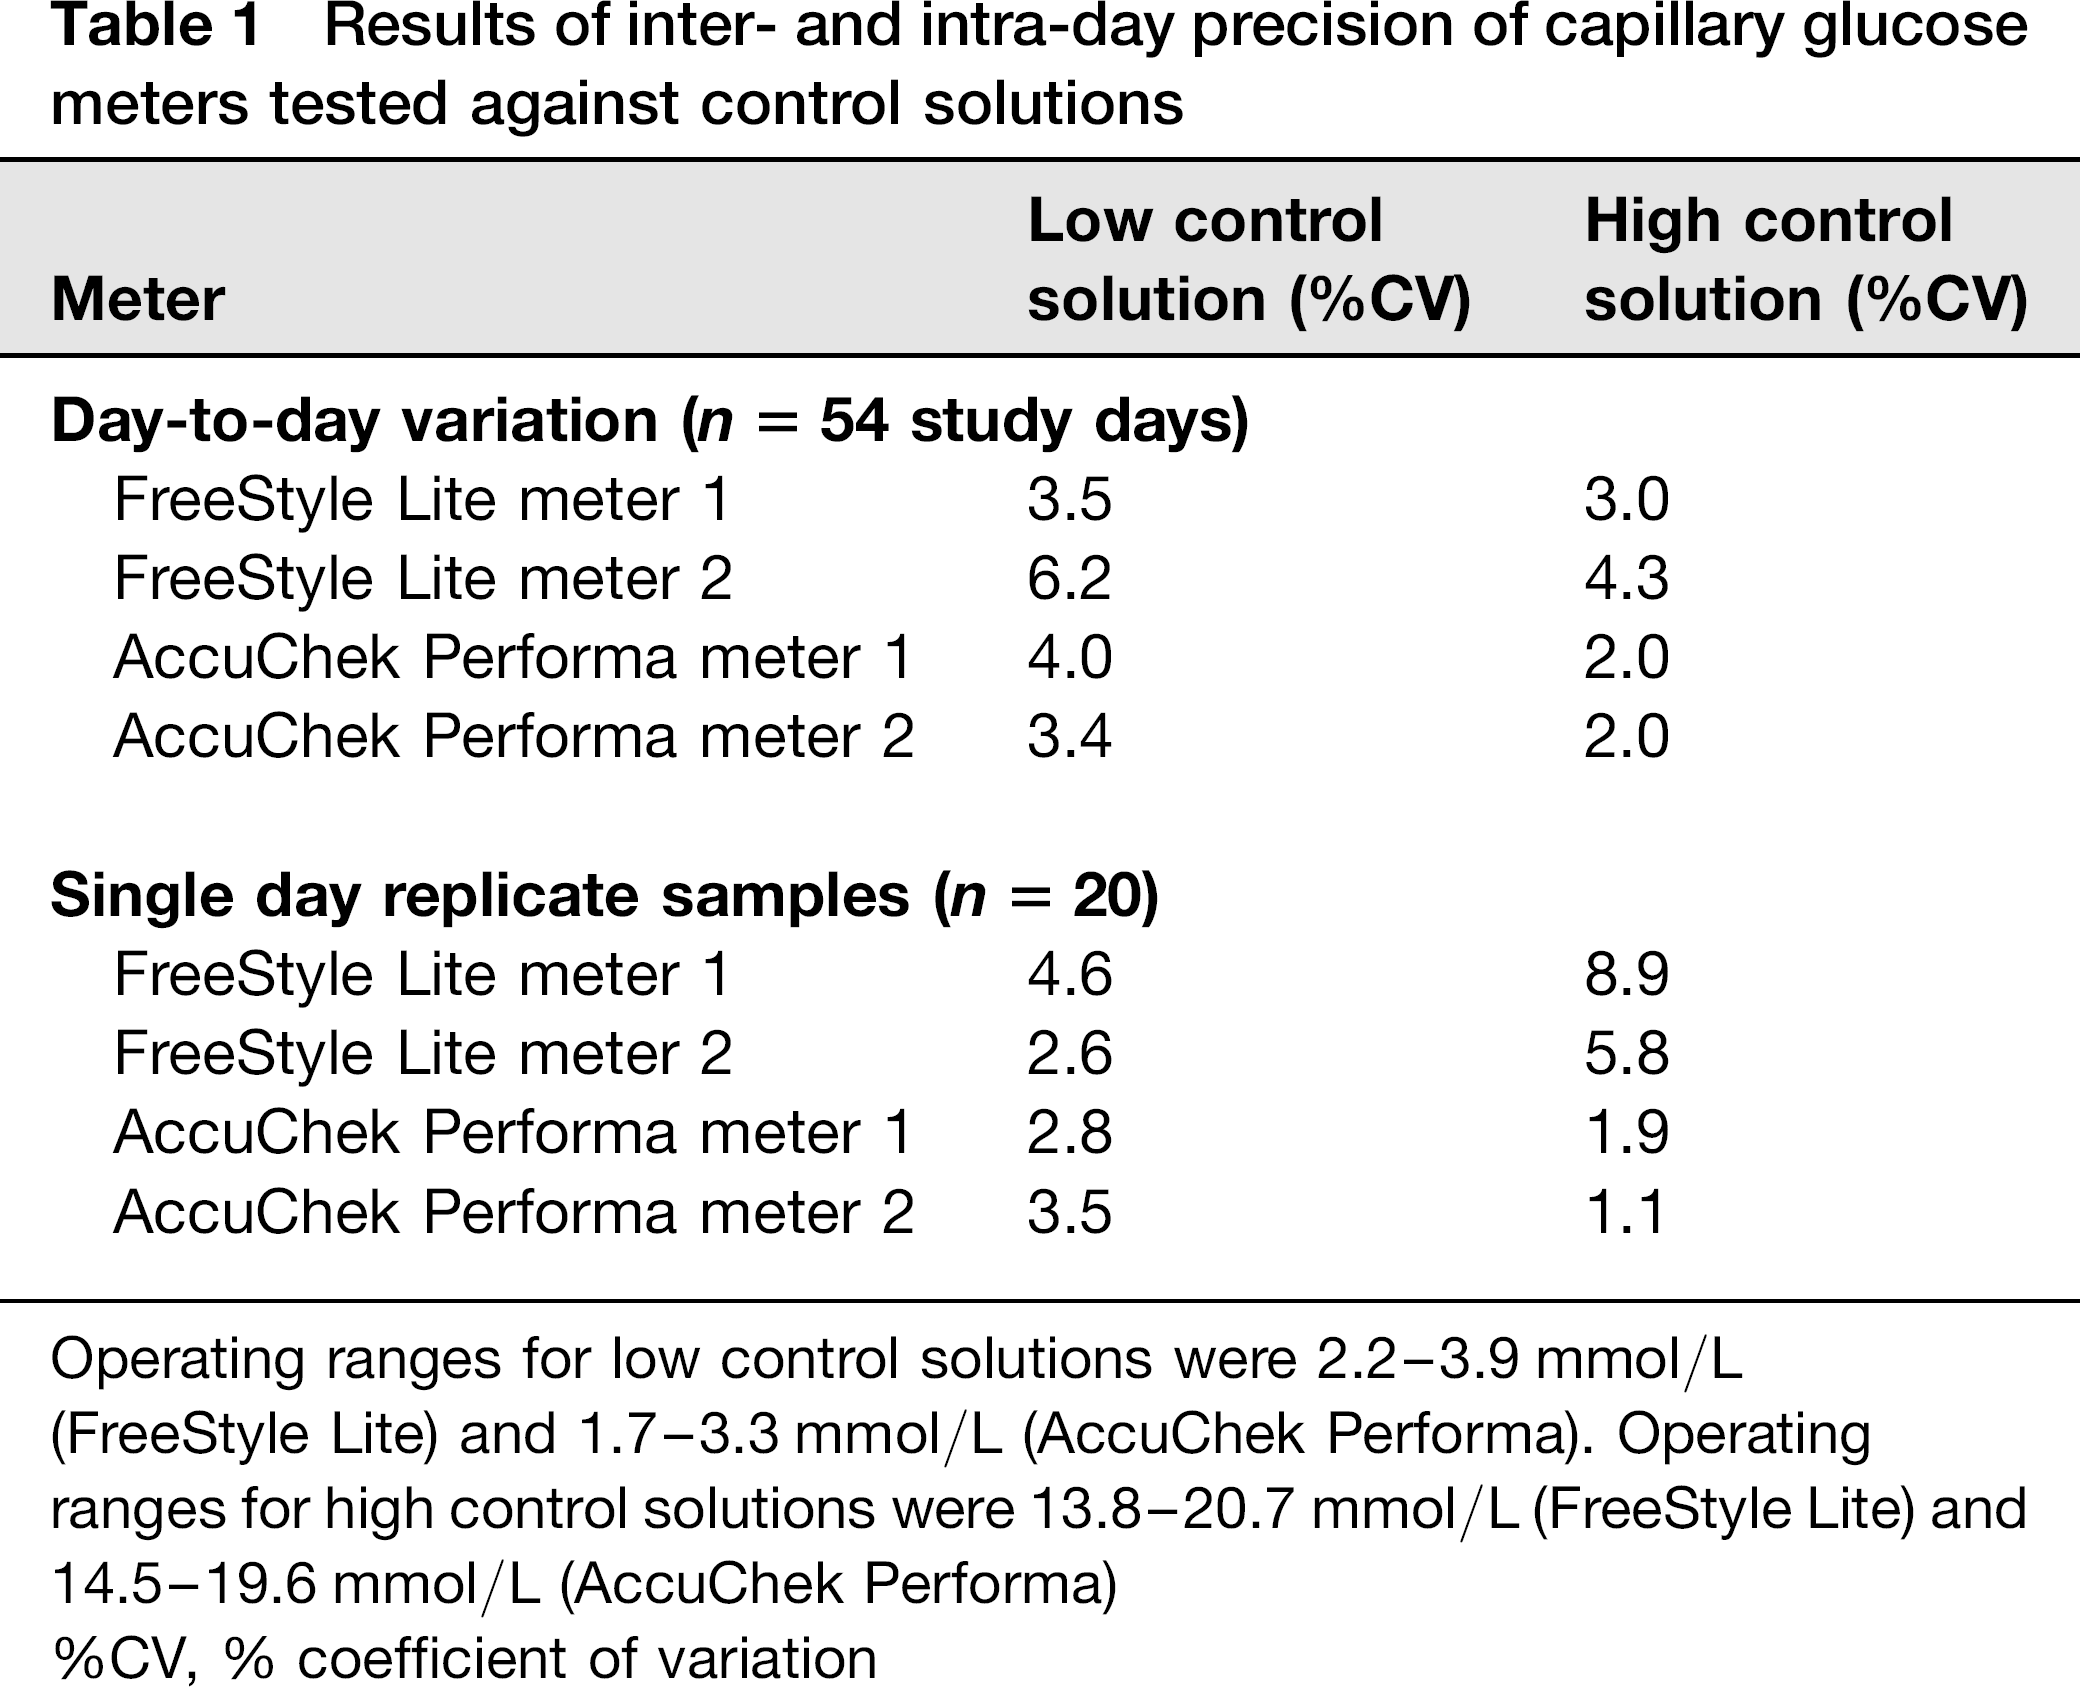
Operating ranges for low control solutions were 2.2–3.9 mmol/L
(FreeStyle Lite) and 1.7–3.3 mmol/L (AccuChek Performa). Operating ranges for high control solutions were 13.8–20.7 mmol/L (FreeStyle Lite) and 14.5–19.6 mmol/L (AccuChek Performa)
%CV, % coefficient of variation
Discussion
This study showed similar variations in the performance of the two glucose meters in healthy volunteers: the FreeStyle Lite and Performa meters, according to prandial status. To our knowledge, there are no previously published studies comparing capillary glucose against venous plasma glucose, in fasting and postprandial states after an ad libitum meal with common food choices. Our findings are not unexpected, given that multiple previous studies have shown that glucose ingestion augments capillary– venous glucose differences in healthy volunteers.6,8–10 Glucose ingestion may also have a similar effect in subjects with dysglycaemia and diabetes, but this is less well studied. 8 A one-hour postprandial sampling time was chosen in the current study as the capillary–venous glucose difference is expected to be near maximal at this time point.9,17–19 However in the setting of diabetes, the standard clinical recommendation suggests two-hour postprandial testing. 4 At this time point, glucose differences are likely to be less marked. It was of passing interest to note that, in the glucose range studied, pooled fasting and postprandial results for both meters showed only a minor positive bias. Thus the trend towards a negative bias in the fasting state when combined with a positive postprandial bias, did to some extent ‘cancel each other out’. This finding in healthy volunteers is consistent with data from previous studies in diabetic patients, which show no bias in capillary values compared with plasma values in random samples collected from a diabetes clinic. 20
Although both meters showed similar trends, there were slight differences in the (capillary–plasma) glucose discrepancy between the two meters studied. In the fasting state, the FreeStyle Lite meter tended to read lower than the Performa meter when compared with venous plasma glucose. However, in the postprandial state, the Performa meter tended to show a greater overestimation of venous plasma glucose compared with the FreeStyle Lite meter.
Both glucose meters showed a positive postprandial (capillary–plasma) glucose discrepancy, the magnitude of which was inversely proportional to the average of the capillary and plasma glucose readings. The difference between capillary and venous plasma glucose results tended to be greatest at low glucose concentrations. A similar finding has also been observed in non-diabetic subjects undergoing insulin hypoglycaemia tests for assessment of pituitary–adrenal function, using different glucose meters. 21 In the current study, participants who experienced a postprandial fall in glucose, which in itself is suggestive of high glucose disposal, tended to show the highest differences in postprandial (capillary–plasma) glucose results.
The physiological basis for the observed postprandial change in meter performance is most likely due to a change in the capillary–venous glucose gradient following an oral carbohydrate load.8–10 In healthy individuals with high peripheral insulin sensitivity, this gradient relates to postprandial peripheral tissue glucose uptake; however, glucose disposal was not formally measured. This study's results are consistent with this physiological explanation; visual inspection of Figure 3 shows that individuals who are likely to have high rates of glucose disposal, as represented by a fall in plasma glucose following breakfast, tended to show the greatest postprandial (capillary– plasma) glucose differences. An additional explanation for the observed capillary–venous glucose gradient is as follows: postprandial changes in forearm blood flow may enhance the capillary–venous glucose gradient. It has been reported that insulin may be involved in capillary recruitment resulting in a shift of blood flow from non-nutritive to nutritive capillary beds. 22 Such changes would likely increase insulin-mediated glucose uptake in the postprandial state of participants in the current study who have no known impairment of insulin signalling.
A particular strength of the current study protocol relates to the prompt separation of plasma following venesection. 14 This is in contrast to many other protocols which allow separation of plasma within 30 min of sample collection.12,13,16 We considered this aspect of the study design to be important, as in vitro glucose uptake by red cells may cause a <7% drop in glucose over one hour;6,23,24 thus in the context of the current study, late separation of plasma would potentially have introduced another source of error when comparing capillary and venous plasma glucose samples.
This study has several limitations. Healthy volunteers were studied, in part because the previously published literature suggests that this cohort shows the greatest changes in the capillary–venous glucose gradient following oral glucose ingestion. 11 However, the use of healthy volunteers does impact on the generalizability of study findings. By definition, the measured glucose concentrations were within a narrow physiological range. Also, the current results cannot necessarily be extrapolated to the diabetic population, as studies in several diabetic subgroups including type 2 diabetes show evidence of impaired peripheral glucose disposal. 25 Impaired disposal may be postulated to alter the relationship between capillary and venous glucose concentrations.
In summary, in healthy volunteers, the glucose meters studied showed positive biases which were most marked in the postprandial state, when compared with corresponding venous plasma glucose values. This discrepancy was most noticeable at lower prevailing plasma glucose levels. There are ongoing technical advances in the analytical performance of glucose meters; however, the presence of this physiological gradient between capillary and venous glucose is likely to be one of the limitations to achieving perfect agreement between capillary glucose meter readings and venous plasma glucose.