
Abstract
Background
Identified as a biomarker of altered calcium–phosphorus metabolism in chronic kidney disease, fibroblast growth factor 23 (FGF-23) can also be used as a biomarker of risk for cardiovascular disease in the general population. However, it is crucial to first evaluate the reproducibility (reliability) of plasma FGF-23 concentrations.
Methods
We assessed the reliability of plasma FGF-23 concentrations using replicate blood samples taken four months apart of 207 participants from the European Prospective Investigation into Cancer and Nutrition-Potsdam Study.
Results
Plasma FGF-23 concentrations at baseline (geometric mean: 24.7 RU/mL; 95% confidence interval [CI] in RU/mL: 21.8–27.9) were not significantly different from those measured four months later (geometric mean: 23.7 RU/mL; 95% CI in RU/mL: 20.6–27.1; P = 0.42). The intraclass correlation coefficients were 0.69 (95% CI: 0.62–0.76) for all; 0.64 (95% CI: 0.50–0.75) for men and 0.73 (95% CI: 0.64–0.81) for women.
Conclusions
Plasma FGF-23 concentrations showed good reliability over time. Our findings suggest that in epidemiological studies, a single plasma FGF-23 measurement may be sufficient to derive the relative risk in prospective cohort studies.
Introduction
Fibroblast growth factor 23 (FGF-23) is a hormone mainly secreted by osteocytes in bone. 1 FGF-23 is also expressed in the bone marrow, brain, thymus and in lymph nodes, 2 although their contribution is almost unknown. 1 Indeed, FGF-23 belongs to the FGF family and is thus involved in the regulation of phosphate concentrations. 3 The discovery that in chronic kidney disease (CKD) non-diabetic patients, FGF-23 predicted renal disease progression led the authors to classify FGF-23 as a new clinical biomarker of altered calcium–phosphorus metabolism. 4 In particular, Fliser et al. 4 found significantly elevated FGF-23 concentrations when renal patients were stratified according to stages of CKD or to its progression. Yet, although the latter mineral abnormality is mainly experienced by CKD patients, it is not ruled out that FGF-23, as a marker of vascular calcification, 5 could also be used as a biomarker of risk for cardiovascular disease (CVD). Recently, higher FGF-23 concentrations were associated with increased risk of CVD events and mortality in patients with established coronary artery disease. 6 In two recent cross-sectional studies, higher FGF-23 concentrations have been associated with prevalent CVD 7 and with recognized CVD risk factors in community-dwelling of, respectively, older women and adults. 8 Gutierrez et al. 8 observed that high CVD risk individuals have on average higher FGF-23 concentrations than those at low risk. Interestingly, a 42% increase in serum intact FGF-23 concentrations has also been observed in obese perimenopausal women compared with their healthy non-obese counterparts. 9
Nevertheless, since large-scale epidemiological studies mainly rely on one blood measurement only, it is also necessary to evaluate the reliability of plasma FGF-23 concentrations in order to obtain reliable risk estimates with a single blood measurement. Therefore, in this study, we aimed to assess the reliability of plasma FGF-23 concentrations measured four months apart.
Methods
Population for analysis
The study population was based on 407 persons selected in 2007 from the European Prospective Investigation into Cancer and Nutrition (EPIC)-Potsdam cohort 10 for a validation study of physical activity assessment. Individuals (randomly selected among all EPIC participants younger than 64 years old) were excluded if they had a history of heart disease (myocardial infarction, heart failure, cardiomyopathy, stroke, angina pectoris) and impaired mobility or used β-blockers. Furthermore, participants were considered eligible if they had baseline systolic and diastolic blood pressure levels <180 and <110 mmHg, respectively. Thus, of the 407 invited participants, 208 (n = 83 men, n = 125 women) agreed to take part in the physical activity assessment study (n = 11 individuals did not respond; n = 176 declined to participate; n = 12 used β-blockers).
All the eligible participants but one provided two blood samples (n = 207): the first one between October 2007 and March 2008 and the second after four months, between February and July 2008.
The Ethics Committee of the Medical Association of the State of Brandenburg approved the study procedures and written informed consent was obtained from all participants.
FGF-23 analyses
The Human FGF-23 (C-Term) enzyme-linked immunosorbant assay (ELISA) kit (Immutopics, San Clemente, CA, USA.) was used to measure plasma FGF-23 concentrations in citrate plasma according to the supplier's protocol with the following modifications. Hundred microlitres of a premix of the both antibodies and the special sample dilution reagent (1+1+2) were added to 50 μL of sample, standard or control on the ELISA plate. After mixing and an incubation of three hours at 25°C and 350 rpm, the plate was incubated over night at 4°C and 350 rpm (Thermomixer Comfort, Eppendorf, Hamburg, Germany). The plate was washed (Asys Atlantis, Biochrom, Cambidge, UK) and incubated with horseradish peroxidase substrate for 45 min (instead of 30 min) in order to increase the signals and to use the full range of the plate reader (Victor 1420; PerkinElmer, Rodgau-Jügesheim, Germany). The samples were analysed in single mode, and standards and controls were measured as duplicates. Both participants’ samples were analysed on the same plate. Based on measurements of dilution series, the lower limit of quantification (LLOQ) was determined as 10 RU/mL (n = 5, coefficient of variation <20%). Rather than excluding values falling below 10 RU/mL, which could lead to biased results, 11 we assigned half of the LLOQ (i.e. 5 RU/mL). 12
The mean intra-assay coefficient of variation was 5.4% (n = 5) based on 31.3 RU/mL (7.6%), 69.0 RU/mL (4.0%) and 278.8 RU/mL (4.5%). The comparison of ethylenediaminetetraacetic acid (EDTA) plasma and citrate plasma with a sample volume of 100 μL and the standard procedure showed that the measured concentration in citrate plasma was 87.3% (standard deviation [SD] 6.6, n = 5) versus the theoretical value of 90% based on the dilution by the citrate solution. The measurement of 50 μL citrate plasma in the adapted mode resulted in values of 96.0% (standard deviation 10.8, n = 5) in relation to the standard procedure of measurement of 100 μL EDTA plasma.
Statistics
Statistical analysis was performed with the use of SAS software package, release 9.2 (SAS Institute, Cary, NC, USA). P value <0.05 was considered statistically significant.
To reduce the right-skew measurements (first measurements: skewness = 7.35; P value <0.010; second measurements: skewness = 5.53; for both P value <0.010 for the Kolmogorov–Smirnov test for normal distribution), plasma FGF-23 values were transformed into natural logarithms and data were reported as geometric means and 95% confidence intervals (CI). Normally distributed data were reported as mean and SD.
The Student's paired t-test was used to compare plasma FGF-23 concentrations measured at baseline and four months later, while an unpaired t-test was used to compare plasma FGF-23 concentrations between men and women. As a measure of the reliability between the two FGF-23 measurements, the intraclass correlation coefficient (ICC) was calculated by dividing the between-subject variance by the total variance (sum of between- and within-subject variances). 13 An ICC ≥0.74 suggests excellent reliability; good reliability when ranging from 0.74 to 0.60; fair when ranging from 0.59 to 0.40; while poor reliability when lower than 0.40. 14 In addition, the agreement between FGF-23 concentrations at baseline and FGF-23 concentrations four months later was demonstrated using a Bland–Altman plot. 15
In order to compute the observed relative risk (RR) and the extent of the attenuation when a single plasma FGF-23 measurement is used in epidemiological studies, we applied the following formulas: (1) RRobserved = exp(ln RRtrue × ICC) and (2) (RRtrue−RRobserved)/RRtrue. 16–18
In addition, Spearman's partial correlation coefficient adjusted for sex was used to assess the cross-sectional association of the first measured plasma FGF-23 concentrations with age, systolic and diastolic blood pressure, body mass index (BMI) and waist circumference.
Results
Study participants (n = 207) had a mean age of 56.5 (4.2) y. Compared with women (n = 124; mean age 55.4 [4.5 y]), men were on average older (n = 83; mean age 58.0 [3.1 y]), with a higher mean BMI (27.6 [3.5] versus 25.8 [4.1]) and waist circumference (101.7 [10.3] versus 87.1 [10.7]) (P < 0.001 for all).
Geometric means (95% confidence interval [CI]) and intraclass correlation coefficients (ICC) of plasma fibroblast growth factor 23 (FGF-23) concentrations (RU/mL) measured at baseline and four months later
†Geometric mean and 95% CI, all such values
*P value for difference based on a paired t-test between the 1^ (at baseline) and 2^ (four months later) measurements
**P value for difference based on an unpaired t-test between men and women
As shown in Figure 1, the Bland–Altman plot revealed good agreement between the two measurements.
Bland–Altman plot showing the agreement between log-transformed fibroblast growth factor 23 (FGF-23) concentrations (in RU/mL) at baseline (T0) and FGF-23 concentrations (in RU/mL) four months later (T4), after exclusion of values below the lower limit of quantification. The difference between T0 and T4 are shown on the vertical axis against the average of the two measures on the horizontal axis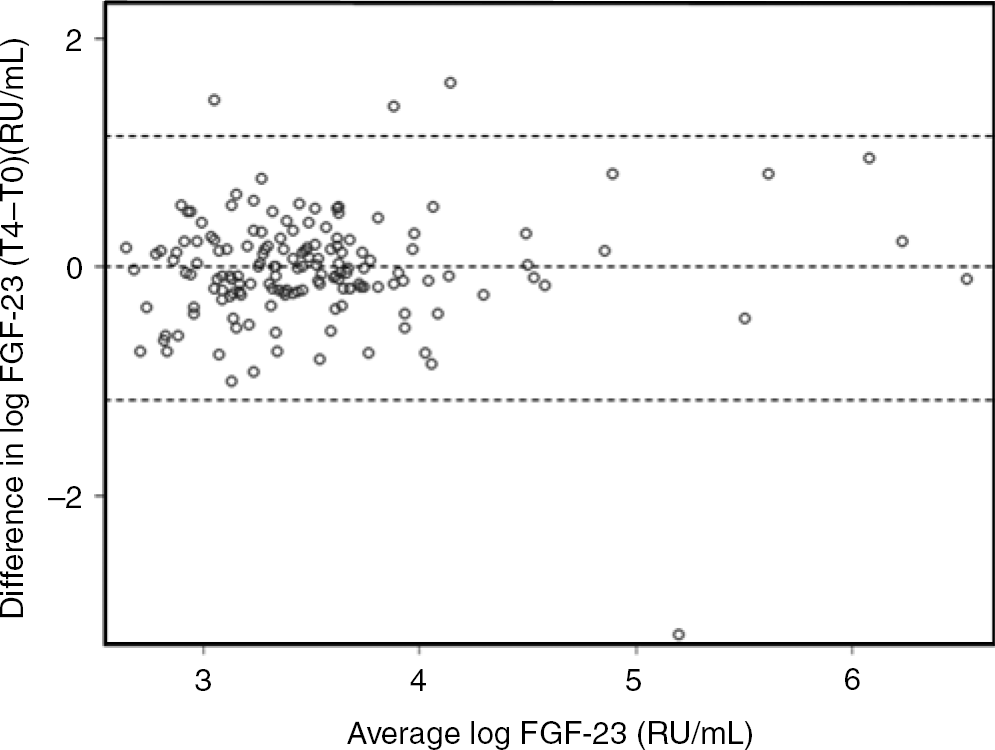
Considering an ICC of 0.69 and true RR of 1.25, 1.50, 1.75, 2.0, 2.5 and 3.0, the observed RR would be, respectively, 1.17, 1.32, 1.47, 1.61, 1.88 and 2.13, when one single plasma FGF-23 measurement is used.
Spearman correlation analysis revealed an inverse relation between plasma FGF-23 concentrations and diastolic blood pressure (r = −0.16; P = 0.022). No significant relationships were observed between FGF-23 concentrations and age, BMI, waist circumference and systolic blood pressure.
Discussion
In the present study, good reliability of plasma FGF-23 concentrations measured over a four-month period was observed. Results did not differ when men and women were analysed separately. To our knowledge, no other studies have evaluated the reproducibility of plasma FGF-23 concentrations to be used as a biomarker in epidemiological studies in subjects who are healthy at baseline.
As an indicator of the proportion of the total variance (i.e. sum of the between- and within-subject variances) due to between-subject variance, a high ICC means that the within-subject variance is low and that most of the observed variability in FGF-23 concentrations is mainly accounted for by the between-subject variance. 19 In other words, the observed ICC of 0.69 suggests that a single measurement of plasma FGF-23 is representative of concentrations integrating a period of several months. Thus, in large-scale epidemiological studies, measuring plasma FGF-23 concentrations only once might be considered to reflect a true but attenuated RR. 18 Nevertheless, as suggested by Platz et al., 18 the extent of the attenuation of the RR mandates the selection of an adequate sample size. 18 Alternatively, epidemiologists can use the ICC to correct RR estimates. 18,20,21 It is worth mentioning that the assay we used for plasma FGF-23 measurements showed reliable quality in a validation study. 22
We observed an inverse but weak correlation between plasma FGF-23 concentrations and diastolic blood pressure. In an experimental study, mice with hypophosphatemia-induced overexpression of human FGF-23 developed hypotension and abnormalities in the cardiovascular system. 23 Unfortunately, in the present study, we did not measure phosphate concentrations so we cannot provide a correlation analysis with plasma FGF-23 concentrations.
The strength of our study is that we measured FGF-23 concentrations in both fasting and non-fasting participants. We concluded that although fasting is preferred, it is however unlikely that, for instance, the consumption of a typical breakfast or meal would significantly increase FGF-23 concentrations. Indeed, it is worth mentioning that in an interventional study, no changes in FGF-23 serum concentrations in response to phosphate-loaded or depleted diets have been observed in healthy volunteers. 24 Furthermore, in a randomized, double-blind crossover study, serum FGF-23 concentrations did not rapidly change in response to an acute oral phosphate loading. 25 Furthermore, since we investigated healthy people who did not follow any special diet, based on our results, we infer that dietary intake is quite stable and did not change over time (i.e. no change in chronic phosphate intake that would affect FGF-23 production under pathological and physiological conditions 25 ).
In addition there is a limitation that is worth discussing. Only healthy participants were enrolled in this study, which could have somehow limited the variability of FGF-23 concentrations. Nevertheless, this would reflect a reduction in the between-subject variation in plasma FGF-23 concentration, thus affecting its reliability over time in terms of an underestimation of the true ICC. 19
In conclusion, in the present study, we observed a good reliability of plasma FGF-23 concentrations over time, suggesting that measuring this biomarker a single time is sufficient to derive the relative risk in prospective cohort studies.
DECLARATIONS