
Abstract
Background
Within-subject biological variation and reference change value (RCV) are difficult to calculate for an analyte with a changing concentration. The aim of this study was to develop a model to examine if it was possible to transform an analyte with a time-dependent change in concentration into a ‘steady-state’ situation by the use of ‘multiples of the median’ (MoM) and its natural logarithm (lnMoM). In addition, we wanted to extend the RCV concept, using likelihood and odds ratios, to calculate the post-test probabilities for disease. D-dimer in pregnancy is used as an example.
Methods
Blood samples from 18 healthy pregnant and 18 healthy non-pregnant women were collected every fourth week. MoM of the D-dimer concentrations was calculated for each four-week interval to obtain a ‘steady-state’ situation for the D-dimer concentrations. The ‘normalized’ values were then transformed to the lnMoM to obtain a Gaussian distribution, used for the estimation of biological variation.
Results
Median D-dimer concentrations increased six-fold during pregnancy. Within-subject variation (SD) of lnMoM D-dimer was 0.27 during pregnancy and 0.23 in non-pregnant women, with RCVs of 0.72 and 0.90, respectively.
Conclusions
By using the lnMoM model, an increasing concentration of an analyte can be transformed to a steady-state situation and the within-subject biological variation and its derived parameters can be calculated.
Introduction
Interpretation of serial measurements in healthy and diseased subjects is usually based on estimates of within-subject biological variation in the form of coefficients of variation, CVwithin-subject, as calculated under stable conditions. 1 Within-subject biological variation and reference change values (RCVs) are thus calculated from subjects in a steady-state situation, and where the concentration of the analyte of interest does not change systematically during the study. 1,2
However, there are conditions in which an analyte systematically increases or decreases, and where it would be useful to have a model for transformation of concentration values to a steady-state type situation from which it is possible to estimate within-subject variation and thereby the RCV. One example of such a condition is in healthy pregnant women, where several analytes increase or decrease systematically with increasing gestational length. It is known, for example, that D-dimer concentrations increase throughout pregnancy, to values far above the cut-off concentration for non-pregnant women, peaks immediately after delivery, 3,4 and is often elevated for some weeks postpartum. 5 Because of the changing D-dimer concentrations during normal pregnancy, pregnant women have been excluded from studies on the usefulness of D-dimer measurement in patients in whom venous thromboembolism (VTE) is suspected. 6–8
In non-pregnant women, a D-dimer concentration below the cut-off value is used together with a low/moderate pretest probability score to ‘rule out’ VTE and thereby avoid further diagnostic imaging procedures. If standardized clinical prediction scores and D-dimer measurements also proved useful in the diagnostic work-up for suspected VTE in pregnant women, unnecessary investigation with potential harmful radiation from diagnostic imaging procedures for both the pregnant women and the fetus might be avoided. 9 D-dimer concentration is regarded as being less useful as a ‘rule in’ test, 10 but it has been shown that the probability of VTE increases as the D-dimer concentration increases, 11,12 and that quantifying D-dimer concentration is helpful when assessing the probability of VTE in a specific patient. 13,14 However, because of the changing D-dimer concentrations in pregnancy, a similar approach to that used in non-pregnant women has been difficult.
A model for normalization of systematically changing concentrations during pregnancy has been developed for several analytes used in pregnancy screening, by calculation of the ‘multiples of the median’ (MoM) and its natural logarithm (lnMoM), 15 as the lnMoM values for these analytes are higher than that in normal pregnancies.
The aim of this study was to further improve this model by calculating the RCV, the likelihood ratio (LR) and the post-test probability for disease 2,16 after a changing concentration has been transformed to a ‘steady-state’ situation by the use of MoM and lnMoM. 15,17 The model is exemplified here by studying D-dimer concentrations in pregnancy and the postpartum period and compared with concentrations found in non-pregnant women.
Materials and methods
Participants
Twenty healthy pregnant women were included in early pregnancy. One pregnant woman had a higher mean D-dimer concentration than the others and a different D-dimer course. She was later found to be homozygous for Factor V Leiden. As she would have received thromboprophylaxis during pregnancy had this been known,
18
and since we cannot be sure that she did not experience asymptomatic thromboembolism during pregnancy, her results were excluded from the study. The median age for the pregnant women was 31 years (range 22–38), median duration of gestation at inclusion was eight weeks (range 5–13) and median gestational week at delivery was 41 (range 37–42). The pregnancies were uncomplicated, but we included three women with caesarean deliveries (subjects 2, 8 and 16 in Figure 1), and one woman (subject 4, Figure 1) with more than 500 mL blood loss after delivery.
Mean and range (error bars) for plasma D-dimer concentrations, MoM and lnMoM for 18 healthy pregnant women during pregnancy and the postpartum period numbered 1–18 (a–c) and 18 healthy non-pregnant women numbered 21–38 (d–f). The cut-off value for D-dimer concentration in non-pregnant women is 0.50 mg/L (marked by the horizontal line in a and d). MoM, multiples of the median; lnMoM, natural logarithm of MoM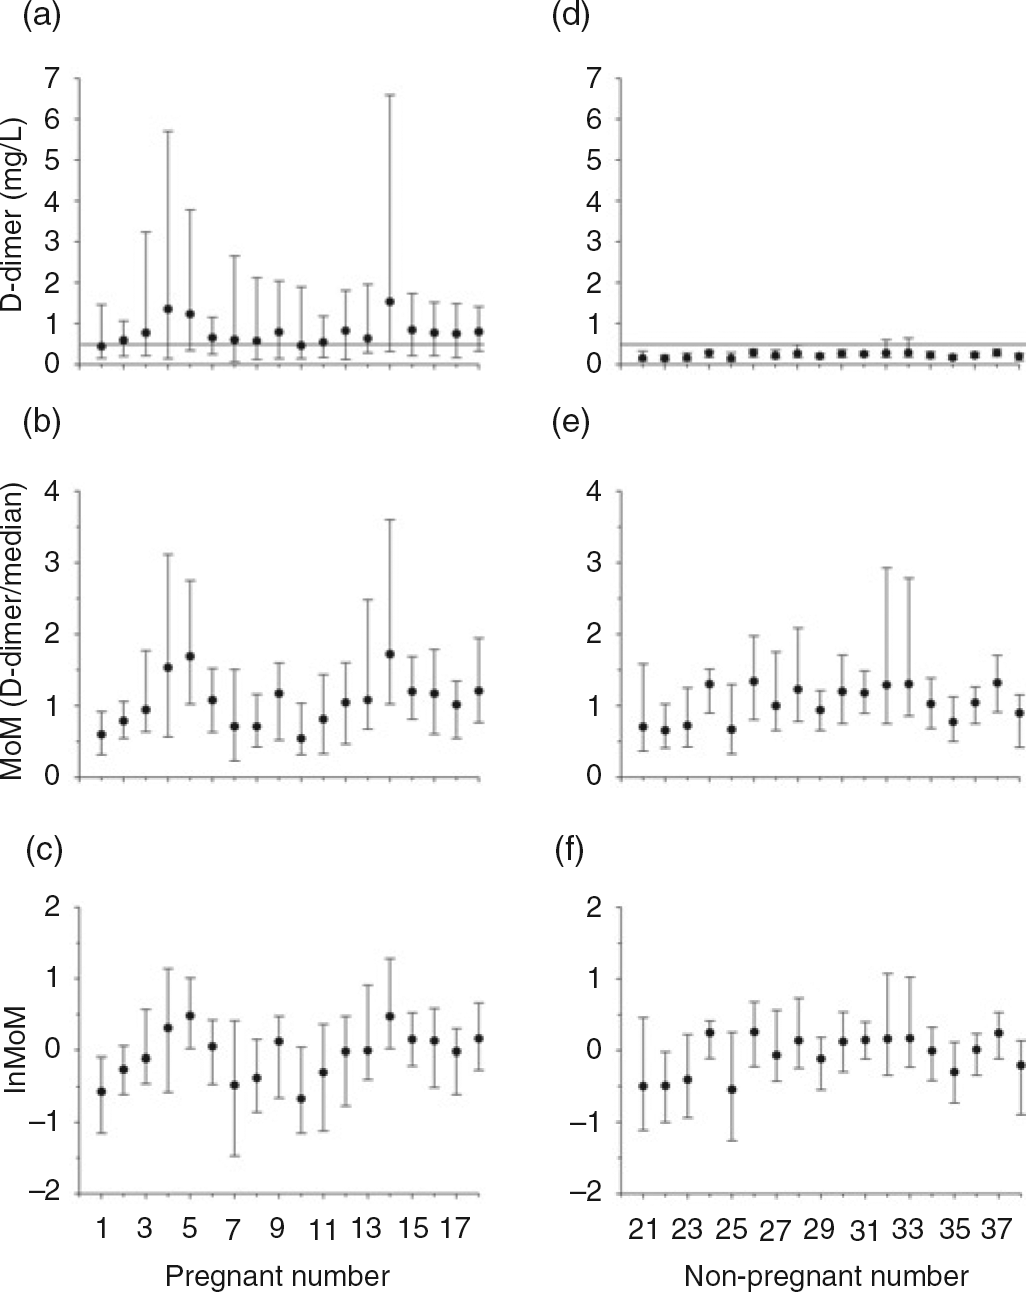
Nineteen healthy non-pregnant women were included. Four of these women were taking the ‘progesterone-only’ contraceptive pill, and were included since this has been found not to change the D-dimer concentrations. 19,20 The median age for the non-pregnant women was 33.5 years (range 23–40).
None of the participants had a personal or family history of bleeding or thromboembolic disease and had been healthy during earlier pregnancies except for one non-pregnant woman who had had pre-eclampsia in an earlier pregnancy. The participants answered a questionnaire about their health status and medication at each blood sampling visit to exclude the possibility that changes in D-dimer concentrations had been caused by disease/medication, and not by biological variation. None of the women included in our study had symptoms or signs of VTE, and diagnostic imaging for VTE was not undertaken.
Study participants were recruited by an advertisement in the local newspaper and on the webpage of Haukeland University Hospital. The study was approved by the Regional Committee of Medical Ethics of Western Norway, and the women gave informed consent to participate in the study in a form accepted by the Norwegian Social Science Data Services.
Specimens
Blood samples were drawn by venepuncture between 08:00 and 13:30 by experienced phlebotomists, with the subjects in the sitting position. The samples were collected in 0.129 mmol/L (3.8%) sodium citrate tubes and centrifuged at 2500
Blood samples were collected every fourth week in pregnancy and at 1–3 days, two weeks and six weeks after delivery. The gestational age was calculated retrospectively according to the date of term determined by routine ultrasound in the 18th week of pregnancy. The time of sampling was allocated into nine four-week time windows during pregnancy at gestational weeks 5–9, 9–13, etc.
In non-pregnant women, blood samples were collected every fourth week with 10 samples from each woman, excepting three women who became pregnant after five, five and seven blood samples, respectively, had been collected.
Analysis
Frozen plasma from each participant was rapidly thawed in a 37°C water bath for five minutes, thoroughly mixed and analysed in duplicate in the same analytical run. The samples were analysed on a STA-R® instrument (Diagnostica Stago, Asnieres, France), with STA® Liatest D-dimer® reagents and internal quality control material (STA® Liatest Control-N and STA® Liatest Control-P) supplied by the manufacturer. Three different lots of D-dimer reagents and one lot of controls were used throughout the study. No systematic change in the concentration of the controls was detected during the study. Total analytical coefficients of variation (within- and between-run variation) for the controls were 17.4% at a mean measured concentration of 0.28 mg/L and 3.3% at a mean measured concentration of 2.40 mg/L.
D-dimer, MoM and lnMoM
D-dimer concentrations (mg/L) at different times during pregnancy and the postpartum period
Within-subject (SDWS), between-subject (SDBS) and analytical (SDAW) variation and reference change value (RCV) with 95% confidence intervals (CIs) for lnMoM D-dimer concentrations, and CVWS, CVBS, and CVAW for MoM D-dimer concentrations in pregnant and non-pregnant women
MoM, multiples of the median; lnMoM, natural logarithm of MoM
*The standard deviations are excellent estimates of coefficients of variation for MoM results, and can also be calculated exactly by the formula CVMoM = √(evar(lnMoM)−1), where var(lnMoM) is the variance of lnMoM (SD2). However, the values for SD for lnMoM D-dimer should be used in calculations, as described in the text
†Blood samples in pregnancy and the postpartum period (nine samples during pregnancy and three postpartum)
Outliers
To examine for outliers in the difference of the duplicates, for extreme means for each woman, and for outliers in the distribution of the means of duplicates for each woman, the method of Burnett was used. 22 One pregnant and one non-pregnant woman each had one outlier in the means of duplicates (reason unknown), and in addition, one non-pregnant woman had an outlying mean D-dimer concentration and her results were therefore excluded from analysis. Therefore, D-dimer results from 18 pregnant and 18 non-pregnant women were used in the final data analysis.
Test of variance homogeneity
A presupposition for calculating biological variation is that there is variance homogeneity. The individual variation for each person, i.e. the within-person standard deviation (SDWP) and coefficient of variation (CVWP) (which includes analytical variation), was estimated for each woman for the absolute D-dimer concentration as well as the transformed results of MoM and lnMoM to test for variance homogeneity. Testing for homogeneity of these SDWP and CVWP values was performed by Bartlett's test. 23 Variance homogeneity was illustrated on a rankit scale where the cumulated ranked coefficients of variation were plotted as fractions on the ordinate as function of SDWP or CVWP. This was compared with the theoretical χ 2-function for homogenous distribution of SD or CV values: pooled SD or CVWP · √χ 2/df shown on the same rankit scale using the mean degrees of freedom (df) for series of results from each woman. 2,24
Biological and analytical variation and index of individuality
The biological variation, separated into the average within-subject (CVWS) and between-subject (CVBS) variations, and within-series analytical variation (CVAW) were estimated from analysis of variance with the statistical model for repeated subsampling (nested design). 25 In order to compare the different steps in transformation for pregnant women, coefficients of variation were calculated for D-dimer concentrations, for MoM values, and finally, the standard deviations (SDWS, SDBS and SDAW) were calculated for the steady-state and Gaussian-distributed lnMoM values. 21 Only the SDWP-values for lnMoM were homogeneous and Gaussian-distributed.
For non-pregnant women, biological and analytical variations were calculated as for the pregnant women, and since D-dimer concentrations and MoM values were skewed, the lnMoM SDs were used for comparison with the results in pregnancy and postpartum. Confidence intervals (95%) were calculated according to Burdick and Graybill. 26
Index of individuality (II) was calculated for lnMoM as SDWS/SDBS. 27,28 If the II is high (e.g. >1.4), the reference interval is useful for monitoring changes, but if the II is low (e.g. <0.6), knowledge about the within-subject variation is especially important to monitor changes in analyte concentration, and the reference interval is of little use. 25,27 If the II is between 0.6 and 1.4, additional calculations may be useful to evaluate the importance of the within-subject variation and RCV (Appendix A).
Reference change value
RCV 25,29 is calculated as: RCV = z × √2 × CVtotal, with CVtotal = √(CVAW 2 + CVWS 2) or for the comparable SD(lnMoM) values, RCV = z × √2 × √(SDAW 2 + SDWS 2). When choosing a one-sided test (an increase in D-dimer concentration) and 95% probability, z = 1.65. A difference measured between two lnMoM values has to be judged according to SDAW, SDWS and the RCV on the logarithmic level. RCV refers to the probability that a change within the RCV limits can be explained by analytical and within-subject variation, i.e. that the patient is in a stable situation, and not the counter hypothesis – the probability that a true change has occurred. 16
To find the usefulness of the RCV for lnMoM D-dimer in pregnant women compared with the alternative approach of using the upper limit of the gestational week-specific reference intervals as action limits, the percentage of pregnant women in whom the concentration of D-dimer would exceed the RCV before exceeding the upper reference limit was calculated (Appendix A). 30 As the ‘reference interval’ in our examples, we have used mean ± 2SD, although we do not have enough data to calculate robust reference intervals in each gestational period. But we also compared some results by using an already published reference interval 4 (Appendix A), where the same method and reagents were used, and data were obtained at about the same time as our study.
LRs and probability of VTE
The distribution of differences from a stable situation are Gaussian with a mean of 0, and a variation equal to √2 × SDtotal as described above. If a true change occurs (e.g. the patient experiences a VTE), it is assumed that the distribution is the same, but with a mean similar to the true change. 16 Two frequency distributions of differences are therefore present, one for a stable, steady-state situation and one for a certain true change. A measured difference will thus represent ‘false change’ for a patient in a stable situation but a ‘true change’ if the patient's condition really is different and the ratio between these will be the LR for a true change (true change/false change), similar to the LR of a diagnostic test (true-positive/false-positive). 16,31 The LRs were calculated for intervals of 0.05 increases in lnMoM. When LR is used together with pretest odds, the post-test odds can be calculated by using Bayes' theorem (post-test odds = LR multiplied by pretest odds).
Results
D-dimer, MoM and lnMoM
Within-series analytical variations (CVAW) for D-dimer were 6.9% (mean 0.79 mg/L) in pregnant women and 23.7% (mean 0.22 mg/L) in non-pregnant women.
The variations of D-dimer concentrations, MoM and lnMoM for each of the participating women are shown in Figure 1. In pregnant women, the D-dimer concentrations increased from non-pregnant levels in the first trimester to concentrations far above cut-off values for non-pregnant women during the second and third trimesters, with the highest D-dimer concentrations at the first day after delivery with return to prepregnancy levels six weeks postpartum (Table 1 and Figure 2a). When D-dimer concentrations were transformed to MoM and thereafter lnMoM, the values were scattered around one (Figure 2b) and zero (Figure 2c), and were Gaussian-distributed for lnMoM. D-dimer concentrations for non-pregnant women were stable throughout the study period with a mean of 0.22 mg/L (95% confidence interval 0.21–0.23) (Figure 2d), but distributions for D-dimer and MoM were skewed, and only the values for lnMoM were Gaussian-distributed (Figure 2f).
Variation in D-dimer concentrations (mg/L), MoM (D-dimer/median) and lnMoM as function of time for 18 healthy pregnant women during pregnancy and the postpartum period (a–c). Each line represents the trajectory of D-dimer concentration for individual women. The shaded area encloses the range of mean ± 2SD D-dimer concentration for pregnancy and the postpartum period. *Week of blood sampling in pregnancy, †days after delivery, ‡weeks after delivery (a–c).Variation in D-dimer concentration (mg/L), MoM (D-dimer/median) and lnMoM as a function of time for 18 healthy non-pregnant women over 40 weeks (d–f). Each line represents the trajectory of D-dimer concentration for individual women. The shaded area encloses the range of mean ± 2SD D-dimer concentrations for non-pregnant women. **Week of blood sampling in non-pregnant women (d–f). MoM, multiples of the median; lnMoM, natural logarithm of MoM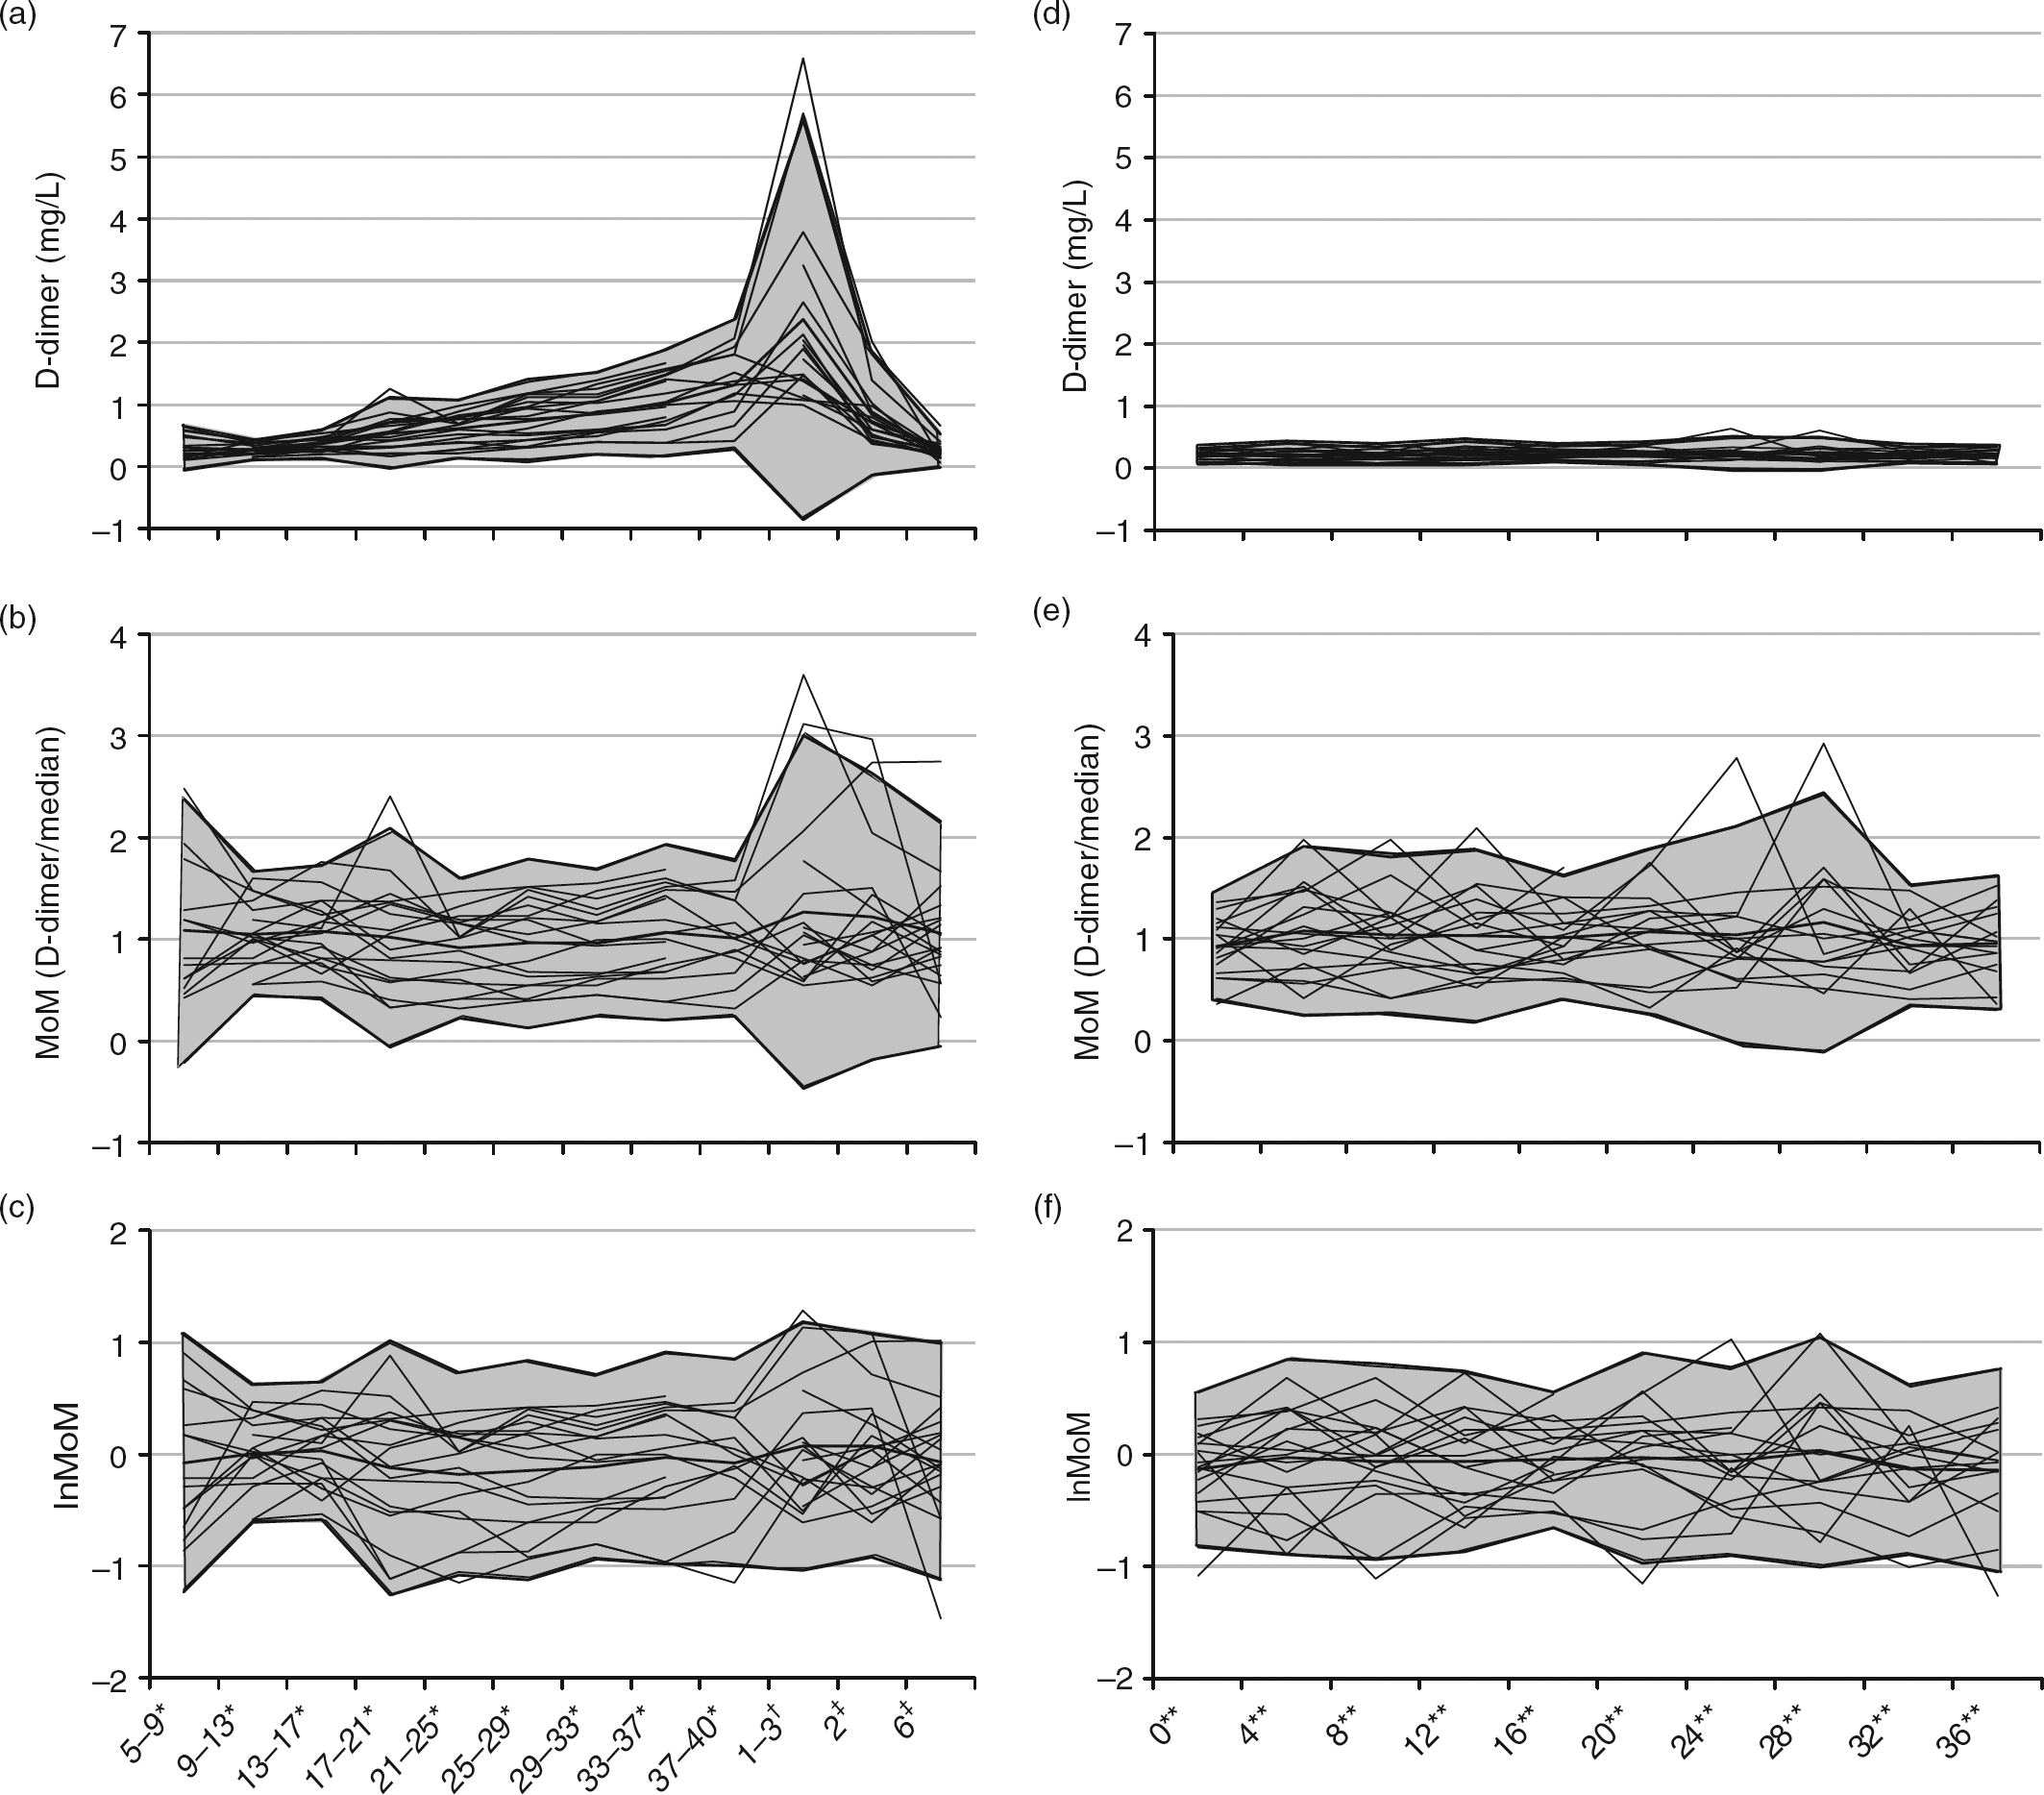
Test of variance homogeneity
Variance homogeneity was only found for lnMoM D-dimer in pregnancy and postpartum (P = 0.08 [Bartlett's test]) (Figure 3a) and for lnMoM D-dimer in non-pregnant women (P = 0.06; Figure 3b).
Variances as distribution of cumulated fractions of individual within-person SD (SDWP) for lnMoM D-dimer in 18 pregnant women during pregnancy and the postpartum period (a), and 18 non-pregnant women (b). The curve represents the expected distribution of the SD (pooled SDWP · √(χ
2/df)). For lnMoM D-dimer, the variances (SDWP) are homogeneous for both (a) pregnant (P = 0.08) and (b) non-pregnant women (P = 0.06; Bartlett's test). MoM, multiples of the median; lnMoM, natural logarithm of MoM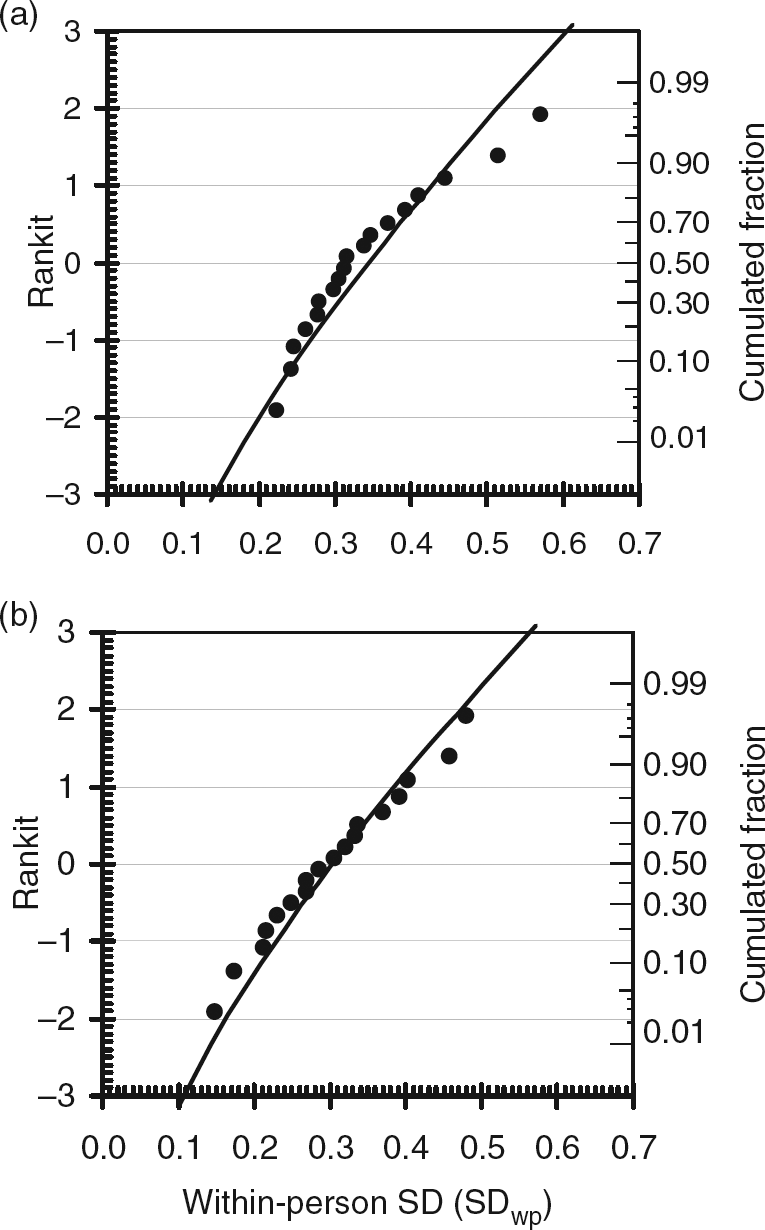
Biological variation and II
CVWS and CVBS for D-dimer (untransformed) in pregnancy were estimated at 0.60 and 0.28, respectively, but cannot be used further because distribution was not Gaussian and no variance homogeneity could be found. Transformation to lnMoM reduced within-subject variation (SDWS) to 0.27, while between-subject variation (SDBS) was only slightly changed (0.35) (Table 2). SDWS and SDBS were not significantly changed if calculated in pregnancy and postpartum (Table 2), if the two excluded women were included (data not shown) or if only one set of data from each gestational period (first, second and third trimester) was used (data not shown).
In non-pregnant women, CVWS and CVBS for D-dimer were 0.28 and 0.22, respectively, but could not be used since the distribution was not Gaussian and no variance homogeneity could be found. However, transformation into MoM and lnMoM had very little effect on the estimation of within- and between-subject variation (Table 2). The results did not change significantly if the four women using the progesterone-only contraceptive pill were excluded (data not shown).
For each SD lnMoM, in both pregnant and non-pregnant women, we calculated the %CV for MoM (see Materials and methods) and found similar values (Table 2).
The II was 0.77 for lnMoM D-dimer in pregnancy, 1.06 in pregnancy and the postpartum period and 0.89 for non-pregnant women.
RCV and LR
RCVs for lnMoM D-dimer in pregnancy, in pregnancy and the postpartum period and in non-pregnant women were 0.72, 0.87 and 0.90, respectively. These RCVs were not significantly different (Table 2). For 66% of the pregnant women, a change in lnMoM D-dimer exceeding the RCV would occur with concentrations below mean + 2SD (the upper limit of the spread of our results) for lnMoM D-dimer (Appendix A). When an already published reference interval was used, 4 88% of the lnMoM D-dimer changes for pregnant women would exceed the RCV before the upper limit of that reference interval was reached (Appendix A).
The LRs increased as expected with increasing change in lnMoM (Figure 4a). Since the RCVs were very similar for both pregnant and non-pregnant women, the LRs are valid for both conditions.
The likelihood ratio (LR) as function of change in lnMoM D-dimer concentration in pregnancy. (a) The dotted lines illustrate that the LR = 15 for the assumed change in lnMoM of 1.05 as described in the Discussion section. (b) The post-test probability of VTE as a function of changes in lnMoM D-dimer concentration in pregnancy for three different pre-test probabilities (P) (0.015 _ _ _ _ , 0.10 –––, 0.25 _____). lnMoM, natural logarithm of multiples of the median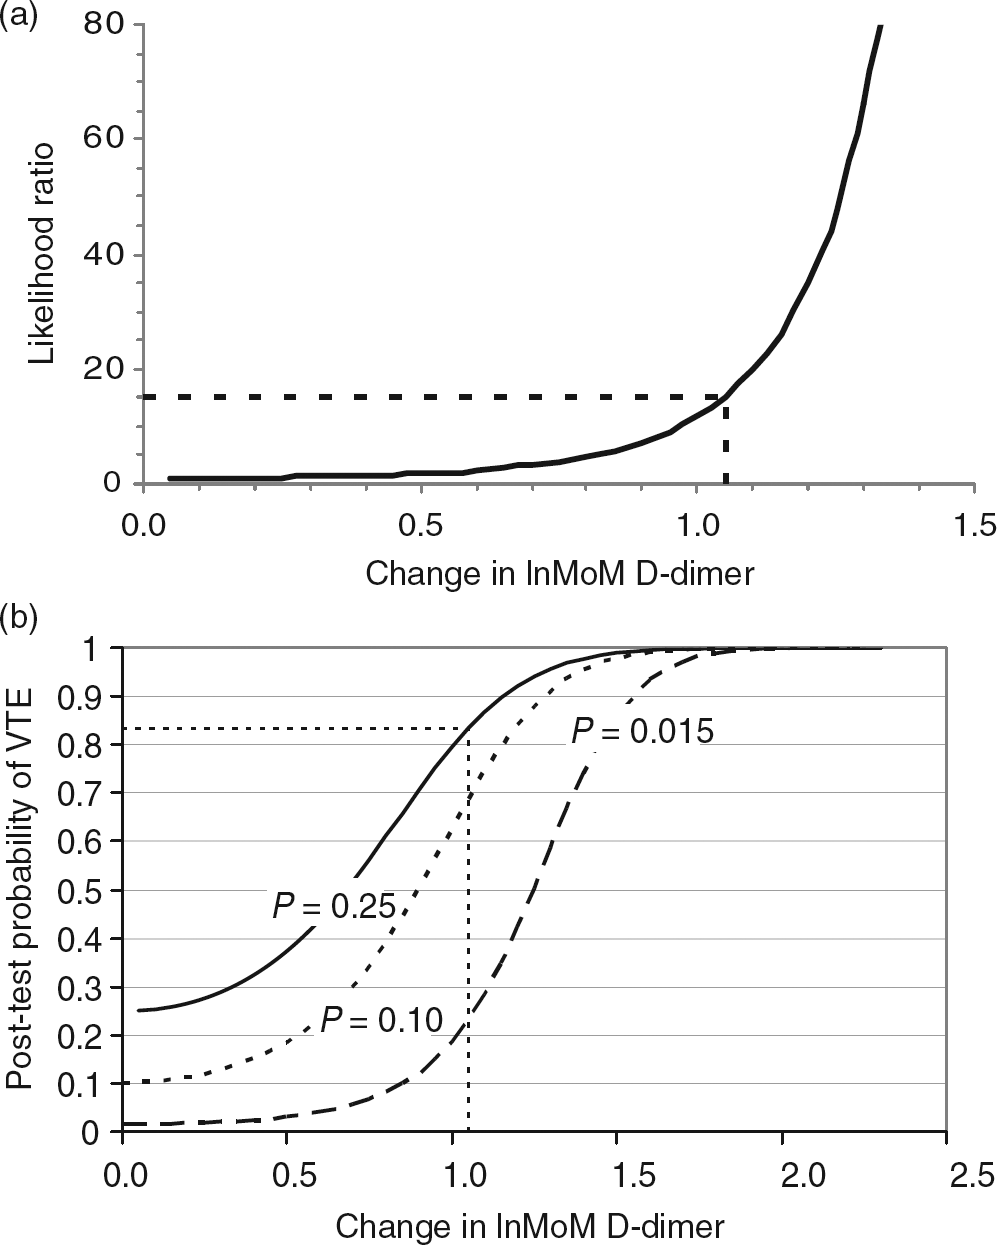
Discussion
The aim of this study was to create a model to transform changing concentrations of an analyte into a steady-state situation in order to estimate the within-subject biological variation and its derived parameters. In our study, we have applied the model for interpretation of D-dimer concentrations in pregnancy and the postpartum period in women with suspected VTE, but the model is general and can be applied to other parameters.
D-dimer concentration increases throughout pregnancy, and decreased during the six weeks after delivery, as has been reported in other studies. 3–5,32 The course of D-dimer concentrations in our pregnant population was very similar to a study on haemostatic reference intervals in pregnancy in which the same D-dimer method was used, 4 but the spread of our results (mean ± 2SD) was less (i.e. our mean + 2SD was in the middle of the reference interval published by Szecsi et al. 4 ).
It is interesting that after MoM and lnMoM transformation of the results, the CVWS was similar in pregnant and non-pregnant women, underlining that the inherent variation of D-dimer in each woman is independent of the increasing concentrations during pregnancy. The only difference was that the variation occurred around a series of new set points. This is comparable with what can be seen for other analytes where the within-subject variation between healthy and diseased persons can be very similar, although the concentrations of the analytes are different. 33
The II for lnMoM in pregnancy was 0.77 and 1.06 in pregnancy and the postpartum period, which means that RCVs in pregnancy may be superior to gestational week-dependent reference intervals as discussed below and in Appendix A.
RCV and clinical application of data
The RCV can be used to judge whether a D-dimer change (in lnMoM) can be explained by analytical and biological variation. It is important to emphasize that the RCV provides only a measure for judging the probability that a difference in consecutive results can be explained by the analytical and within-person variation seen in subjects in a stable situation. It does not provide a measure for judging the probability that a true change has occurred. Both these aspects should, however, be taken into account.
As an example from this study, if the D-dimer concentration increased from 0.20 mg/L in week 16 to 1.51 mg/L in week 30, this is an increase in lnMoM of 1.05 and it exceeds an increase of 0.72 (RCV) which would correspond to a D-dimer concentration of 1.09 mg/L (Appendix B). It is therefore probable that this change cannot be explained by analytical and within-subject biological variation, and that an alternative cause of the increase should be sought. A D-dimer concentration of 1.51 mg/L in week 30 is about 1.8 times higher than the mean value in this period in pregnancy (Figure 2a). It is therefore on the border of the upper ‘reference limit’ (defined as mean + 2SD in the present study) and towards the midpoint of a recently published reference interval by Szcesi et al. 4 The result is consistent with an increase in D-dimer concentration found in pregnant women with deep venous thrombosis (DVT) (D-dimer increase of 1.6–5.4 times and 2.0–3.8 times the mean value in the second and third trimesters, respectively). 34 When the RCV is applied, this transformation model is superior to the gestational week-dependent ‘reference interval’ (mean ± 2SD) for 66% of the pregnant women, if the increase in lnMoM is slightly above the RCV (Appendix A). Using the reference interval published by Szecsi et al., 4 88% of women would benefit from using the RCV increase instead of the reference interval (Appendix A).
Probability of VTE
By extending the RCV concept using odds ratios and LRs, it is possible to calculate post-test probability for VTE following an increase in D-dimer concentration (in lnMoM), if the pretest probability is known (Bayes' theorem). 16 Pretest probability for VTE in pregnancy was reported in a study in which the prevalence of confirmed DVT was 0.088 (∼0.10); if divided into ‘low’ and ‘non-low’ pretest probability groups (based on clinical evaluation), the prevalence rates were 0.015 and 0.25 for each group, respectively. 35 Using these data and based on the LRs and pretest probabilities of 0.015, 0.10 and 0.25, the LRs and post-test probabilities for different increases in lnMoM were calculated (Figure 4).
Using the lnMoM increase of 1.05 in the example above, the probability that this increase is due to VTE depends on the pretest probability (Figure 4b). For a pretest probability of 0.25 (‘non-low’ pretest probability), the post-test probability of VTE increases significantly to 0.83 (83%) (Figure 4b), while for a pretest probability of 0.015 (‘low’ pretest probability), the post-test probability only increase to 0.19 (19%), which still represents a low probability of VTE.
With this method, we can make an estimate of the probability of VTE in a given gestational week by means of the degree of increase in D-dimer concentrations from a state in which the woman has no clinical features suggestive of VTE (first D-dimer concentration in healthy state) to a state in which the woman has signs/symptoms suggestive of VTE (second D-dimer concentration). The advantage of using our model, rather than a model based on gestational week-specific D-dimer cut-off values, 36 is that a pathological increase might be detected when the D-dimer concentration is still below the gestation-related cut-off value. A limitation of our model is that two D-dimer measurements are needed.
The increase in D-dimer concentrations in pregnancies with and without risk factors for VTE, and in pregnant women with risk factors treated with heparin prophylaxis seems to be similar, 32 and it can therefore be assumed that the RCV is similar. We therefore suggest that D-dimer should be analysed early in pregnancy in asymptomatic women with risk factors for VTE. 37,38 If a pregnant woman, at risk, later experiences symptoms compatible with VTE, a second blood sample is drawn for D-dimer analysis. The two D-dimer concentrations can then be compared by transforming them into lnMoM as described.
Conclusion
The proposed model for transforming changing concentrations of an analyte into a steady-state situation by use of MoM and lnMoM makes it possible to estimate the within-subject variation and then interpret changes by calculating RCVs and LRs. LRs can then be used to estimate post-test probabilities when the pretest probability is known. This model is relatively new in laboratory medicine, and should be validated for D-dimer in pregnant women with risk factors for VTE and for those with confirmed VTE. The model may have applications in many other situations in which there is a time-dependent change in the concentration of an analyte.
DECLARATIONS