
Abstract
Background
Low-density lipoprotein cholesterol (LDL-c) is the major measured parameter for cardiovascular risk assessment. The generally accepted formula (LDL-F) for estimating LDL-c developed by Friedewald and colleagues in 1972 using data from 448 individuals suffers from known inaccuracies at extremes of triglyceride (TG) and total cholesterol (TC) values.
Methods
We generated new formulas based on a large Brazilian database containing directly measured lipid values from 10,664 fasted individuals. This database LDL-c was measured by the LDL-C Select FS (DiaSys) system, a homogeneous method without centrifugation. The formulas were generated using linear and non-linear approaches, and the formula with the highest accuracy and simplicity for general clinical use was selected.
Results
The simple formula LDL-c = 3/4 (TC - HDL-c) provided an accurate estimate of LDL-c, a higher correlation with directly measured LDL (r = 0.93) compared with LDL-F (r = 0.87), and also a higher accuracy.
Conclusions
The new formula outperformed several other LDL-c formulas over a wide range of TC, HDL-c and TG values. The validation and application of this formula in other populations is warranted.
Introduction
Low-density lipoprotein cholesterol (LDL-c) is a frequently used and major laboratory parameter for cardiovascular risk assessment. More than 40 years ago, William T Friedewald et al.
1
developed a formula for LDL-c estimation using a database of 488 individuals based on fasting plasma measurements of total cholesterol (TC), high-density lipoprotein cholesterol (HDL-c) and triglycerides (TG): LDL-c = total cholesterol
One of the parameters in Friedewald's formula is an estimation of very-low-density lipoprotein (VLDL) obtained by dividing TG by a factor of 5. This poses a difficulty for the formula, as VLDL are a diverse group of particles containing different ratios of TG to cholesterol, as do LDL particles. 8 Several authors have developed alternative formulas for the estimation of LDL-c; however, they did not outperform Friedewald's equation.9–11
The gold standard method for LDL-c measurement is ultracentrifugation followed by beta-quantitation, 12 which is expensive and inconvenient for routine clinical application. More recently, direct methods of LDL-c measurement using specifically designed detergents have been developed, which outperform those based on inhibition with monoclonal antibodies.3,13 However, these methods are still quite expensive for most laboratories, and thus direct determination of LDL-c is uncommon in most laboratories worldwide.
To circumvent these issues, we have attempted to generate more accurate formulas for estimating LDL-c, using our database containing the directly measured TG, TC, HDL-c and directly measured LDL-c of 10,664 individuals. 2 We have also compared our new formula to those proposed by Hattori et al., 14 Anandaraja et al., 15 Teerakanchana et al., 16 that proposed by Ahmadi et al. 5 for low TG patients, and a new recently published formula obtained from a large cohort of Asian individuals. 17
Material and methods
Study population
We have evaluated in this study a sample database consisting of 10,664 Brazilian individuals including directly measured TG, TC, HLD-c and LDL-c.
2
The database consisted of 5847 females and 4817 males, aged 1-93 years. Blood samples were collected after a 12-hour fast at the Santa Isabel Clinical Laboratory, Santa Isabel Hospital, in Blumenau city, Brazil, from January 2000 to December 2002. The measurements of TG and TC were performed with the reagents Triglycerides FS (DiaSys Diagnostic Systems GmbH & Co KG, Holzheim, Germany) and cholesterol (BioSystems S.A., Barcelona, Spain), respectively, according to the specifications of the manufacturers, in a Spectrum CCX II device (Abbott Diagnostics, Abbott Park, IL, USA). The tests were calibrated with the CCX Multicalibrator Set (Abbott), with curves of three points. The LDL-c measurement with the homogeneous method was performed with the reagent LDL-c Select FS (DiaSys), a Wako (Richmond, VA, USA) method, according to the specifications of the manufacturer. The HDL-c measurement was performed using a homogeneous method without precipitation with the HDL-c Immuno FS reagent (DiaSys/ Wako). The value for VLDL-c was deduced from the equation TC
Data analysis
Data were analysed with the aid of Microsoft ExcelTM (Microsoft, Redmond, WA, USA). We have evaluated the data according to ranges of TC, TG, HDL-c, LDL-c and VLDL-c values. We have performed correlation analysis for these variables as well as for TC - HDL-c, HDL-c/TG, HDL-c/VLDL-c, HDL-c/LDL-c, HDL-c/(LDL-c + VLDL-c), TC/HDL-c and LDL-c/(LDL-c + VLDL-c) ratios. We applied the least squares percentage regression method to obtain several formulas in the format LDL-c = a × TC + b × HDL-c + c × TG. 18 The method is based on the assumption that when using a model for prediction, the percentage error may be more important than the absolute error. The situation is akin to speaking of percentage changes in Fahrenheit temperature and percentage changes measured on the Celsius scale – the two are not the same because these scales do not share a common zero point. In short, the dependent variable needs to be measured on a ratio scale when using percentage regression. This is because a percentage is not meaningful if one is permitted to shift the zero of the scale. Exact expressions are then derived for the coefficients, and models can be estimated easily using existing regression softwares. A coefficient bi for each column variable is obtained, and the coefficient associated with the first column will be the constant. The values of the dependent variable are contained in a column vector y, which is assumed strictly positive. The data in the ith row of the matrix is associated with the ith element of the y vector. Traditionally, one would minimize the sum of squared errors, eTe, where e denotes the vector of errors, y - Xb (superscript T denotes the transpose). However, here one is interested in the relative errors r (percentage error = 100 times relative error), so each error ei needs to be divided by yi, so ri = ei/yi. Carrying out this division on the form y - Xb requires that the ith row of X be divided by yi; this is achieved using the form r = Dy - DXb where D is an n by n diagonal ‘division’ matrix containing the value 1/yi in the ith diagonal position and zeros elsewhere. D can be viewed as a matrix of weights. Now one wishes to minimize the sum of squares of relative errors Σri; 2 which, in vector notation, becomes rTr = (Dy - DXb)T(Dy - DXb) = (Dy)TDy - (Dy)TDXb - (DXb)TDy + bT XT D2Xb. To find the minimum, one differentiates this with respect to b and equate to zero: - (Dy)T Dx + XT D2Xb = 0. This is the matrix equivalent of the normal equations of ordinary least squares regression. These equations have the great convenience of being linear in b and so can be easily solved. Rearranging the previous equation: XT D2Xb = (DX)T Dy, for which the solution is given by: b = (XT D2X)−1 (DX)T Dy = (XT D2X)−1 XT D2y. Using a spreadsheet for the calculations, the vector b can be easily computed directly using the matrix functions MINVERSE, MMULT (to multiply) and TRANSPOSE. 18 Statistical analysis was performed with Student's t-test and its P value, and calculation of the root mean square error (rMSE). This is a good measure of accuracy, and a frequently used measure of the differences between values predicted by a model or an estimator and the values actually observed from the thing being modelled or estimated. 19
Results
Due to its large size, our database includes healthy persons, hyperlipidemic patients, diabetics and individuals with other metabolic conditions. Furthermore, virtually every possible range and combination of TC, TG, HDL-c and LDL-c are represented. Nonetheless, lipid values exhibit a near normal Gaussian distribution, as demonstrated in Figure 1.
Distribution of total cholesterol (TC), triglycerides (TG), HDL-cholesterol (HDL-c) and directly measured LDL-cholesterol (LDL-c) values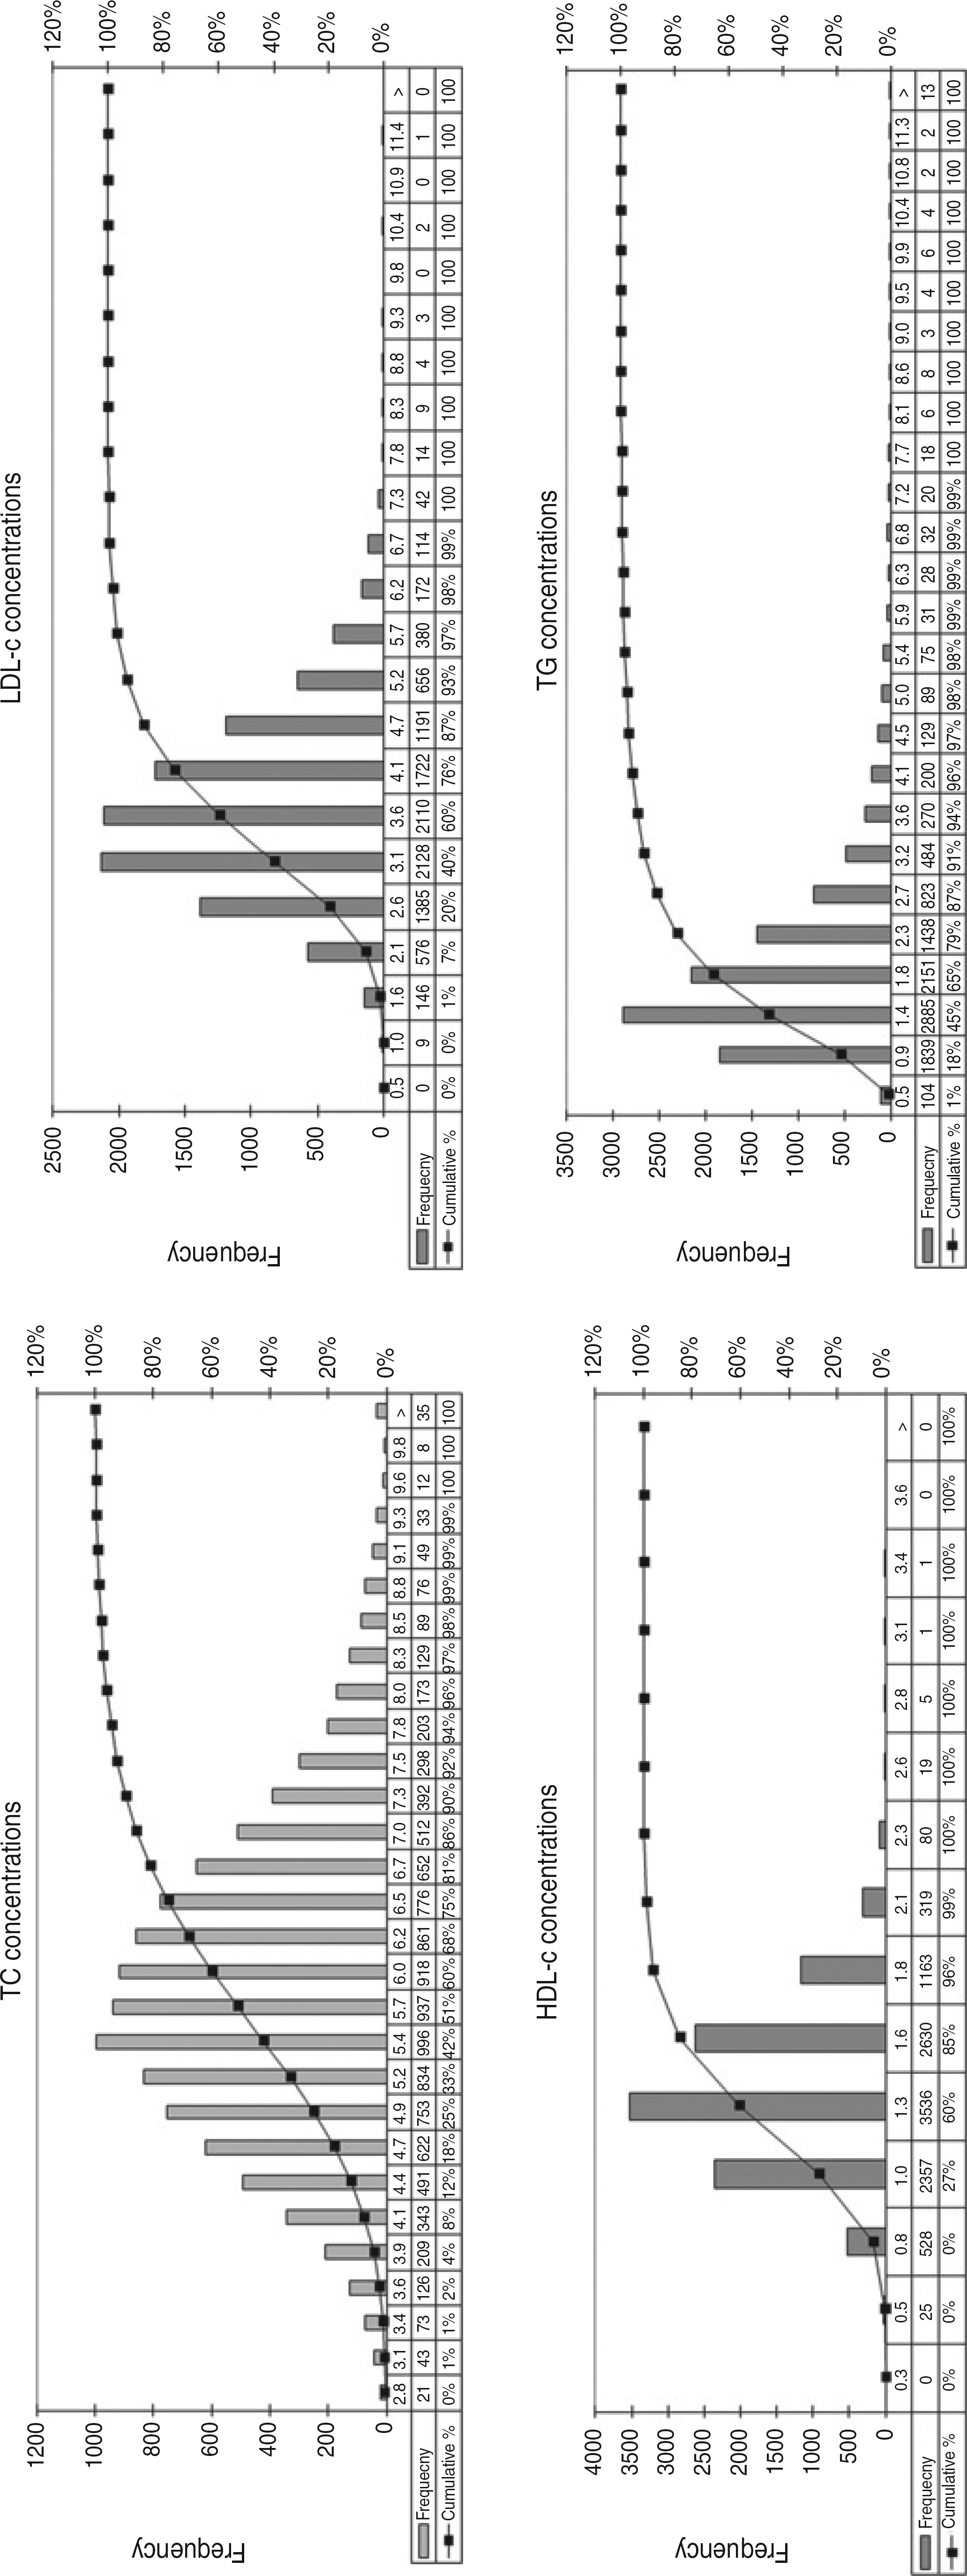
We examined correlations between TC, TG, LDL-c, HDL-c, VLDL-c, TC - HDL-c, HDL-c/TG, HDL-c/VLDL-c, HDL-c/LDL-c, HDL-c/(LDL-c + VLDL-c), TC/HDL-c and LDL-c/(LDL-c + VLDL-c). We observed a strong correlation (r = 0.93) between directly measured LDL-c values and non-HDL-c. Conversely, a poor correlation was observed between measured LDL-c and TG (r = 0.31) (Figure 2).
Correlation between measured LDL-c values and TC - HDL-c or TG. LDL-c, LDL-cholesterol; HDL-c, HDL-cholesterol; TC, total cholesterol; TG, triglycerides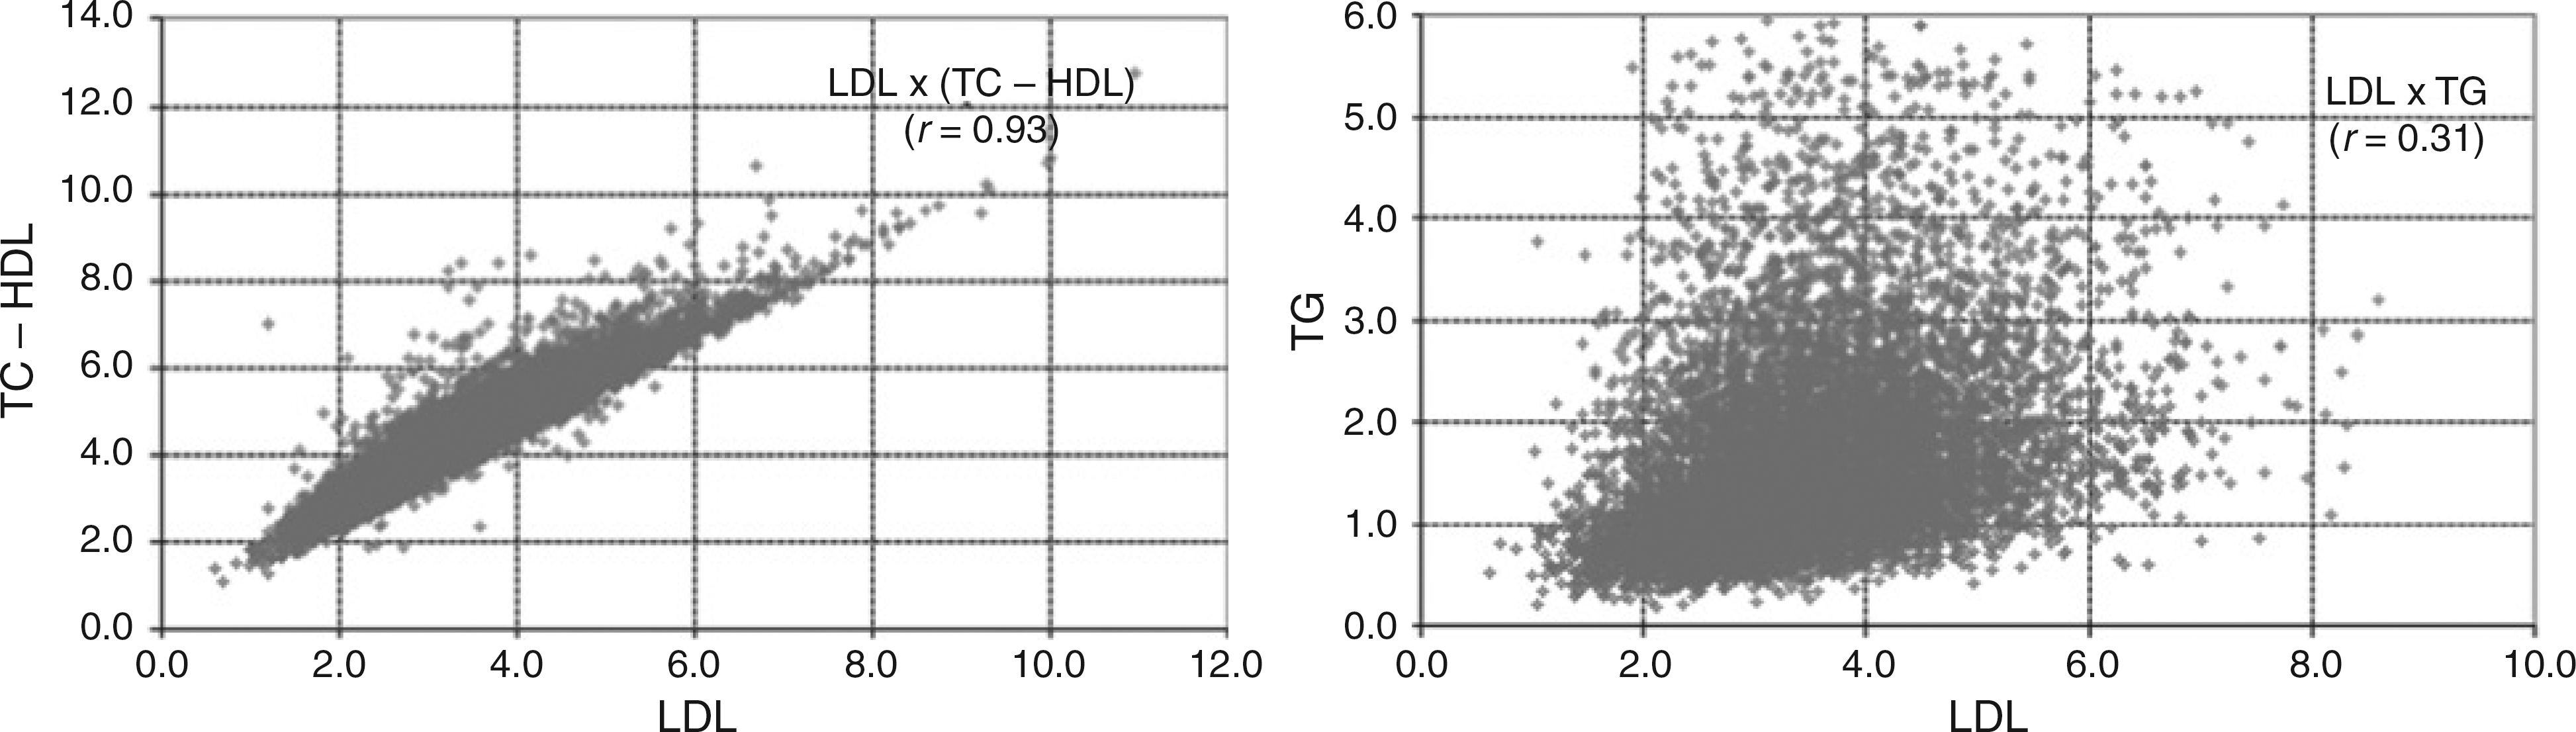
As observed in Figure 2, LDL-c values are virtually independent of TG. Furthermore, analysis of the LDL-c/non-HDL-c ratio indicates that 3/4 of all individuals fall between 0.65 and 0.85. Considering these correlations, we derived several formulas, including 0.8415TC 2 0.9512HDL-c 2 0.0612TG; 0.7617TC 2 0.7953HDL-c; 0.7516 (TC 2 HDL-c); TC1.3342/10.471; 0.5726TC; and TC 2 85.54. The simple formula of 3/4 (TC 2 HDL-c), or more precisely: 0.7516 (TC 2 HDL-c), exhibited the best performance for LDL-c estimation. It provided a closer correlation with measured LDL-c (0.934) (Figure 3) than Friedewald's and other formulas, as well as a higher accuracy (as indicated by its lower 50% rMSE) for every possible TC, TG or HDL-c value (Table 1).
Correlation and Bland–Altman plot between LDL-c predicted by the new formula (0.7516 [TC - HDL-c]) and directly measured LDL-c values in the studied population. LDL-c, LDL-cholesterol; HDL-c, HDL-cholesterol; TC, total cholesterol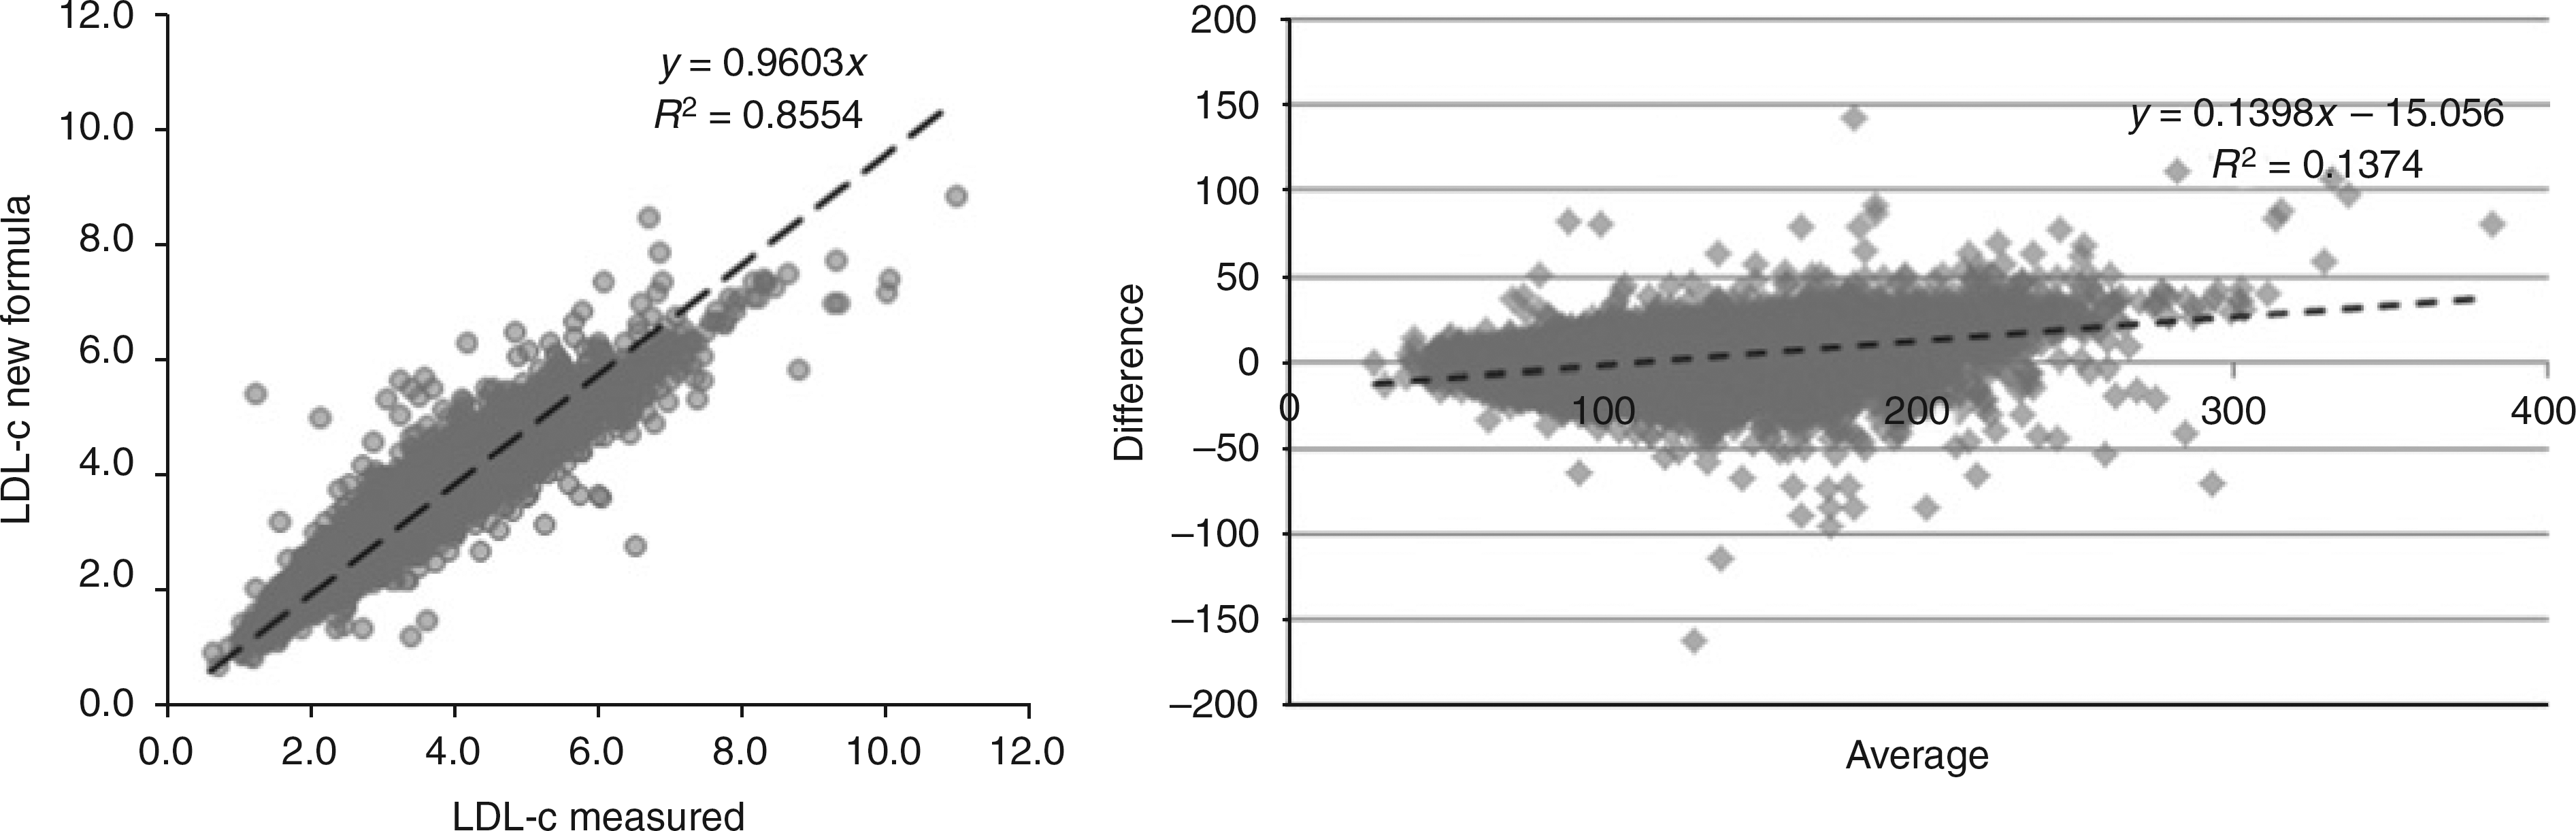
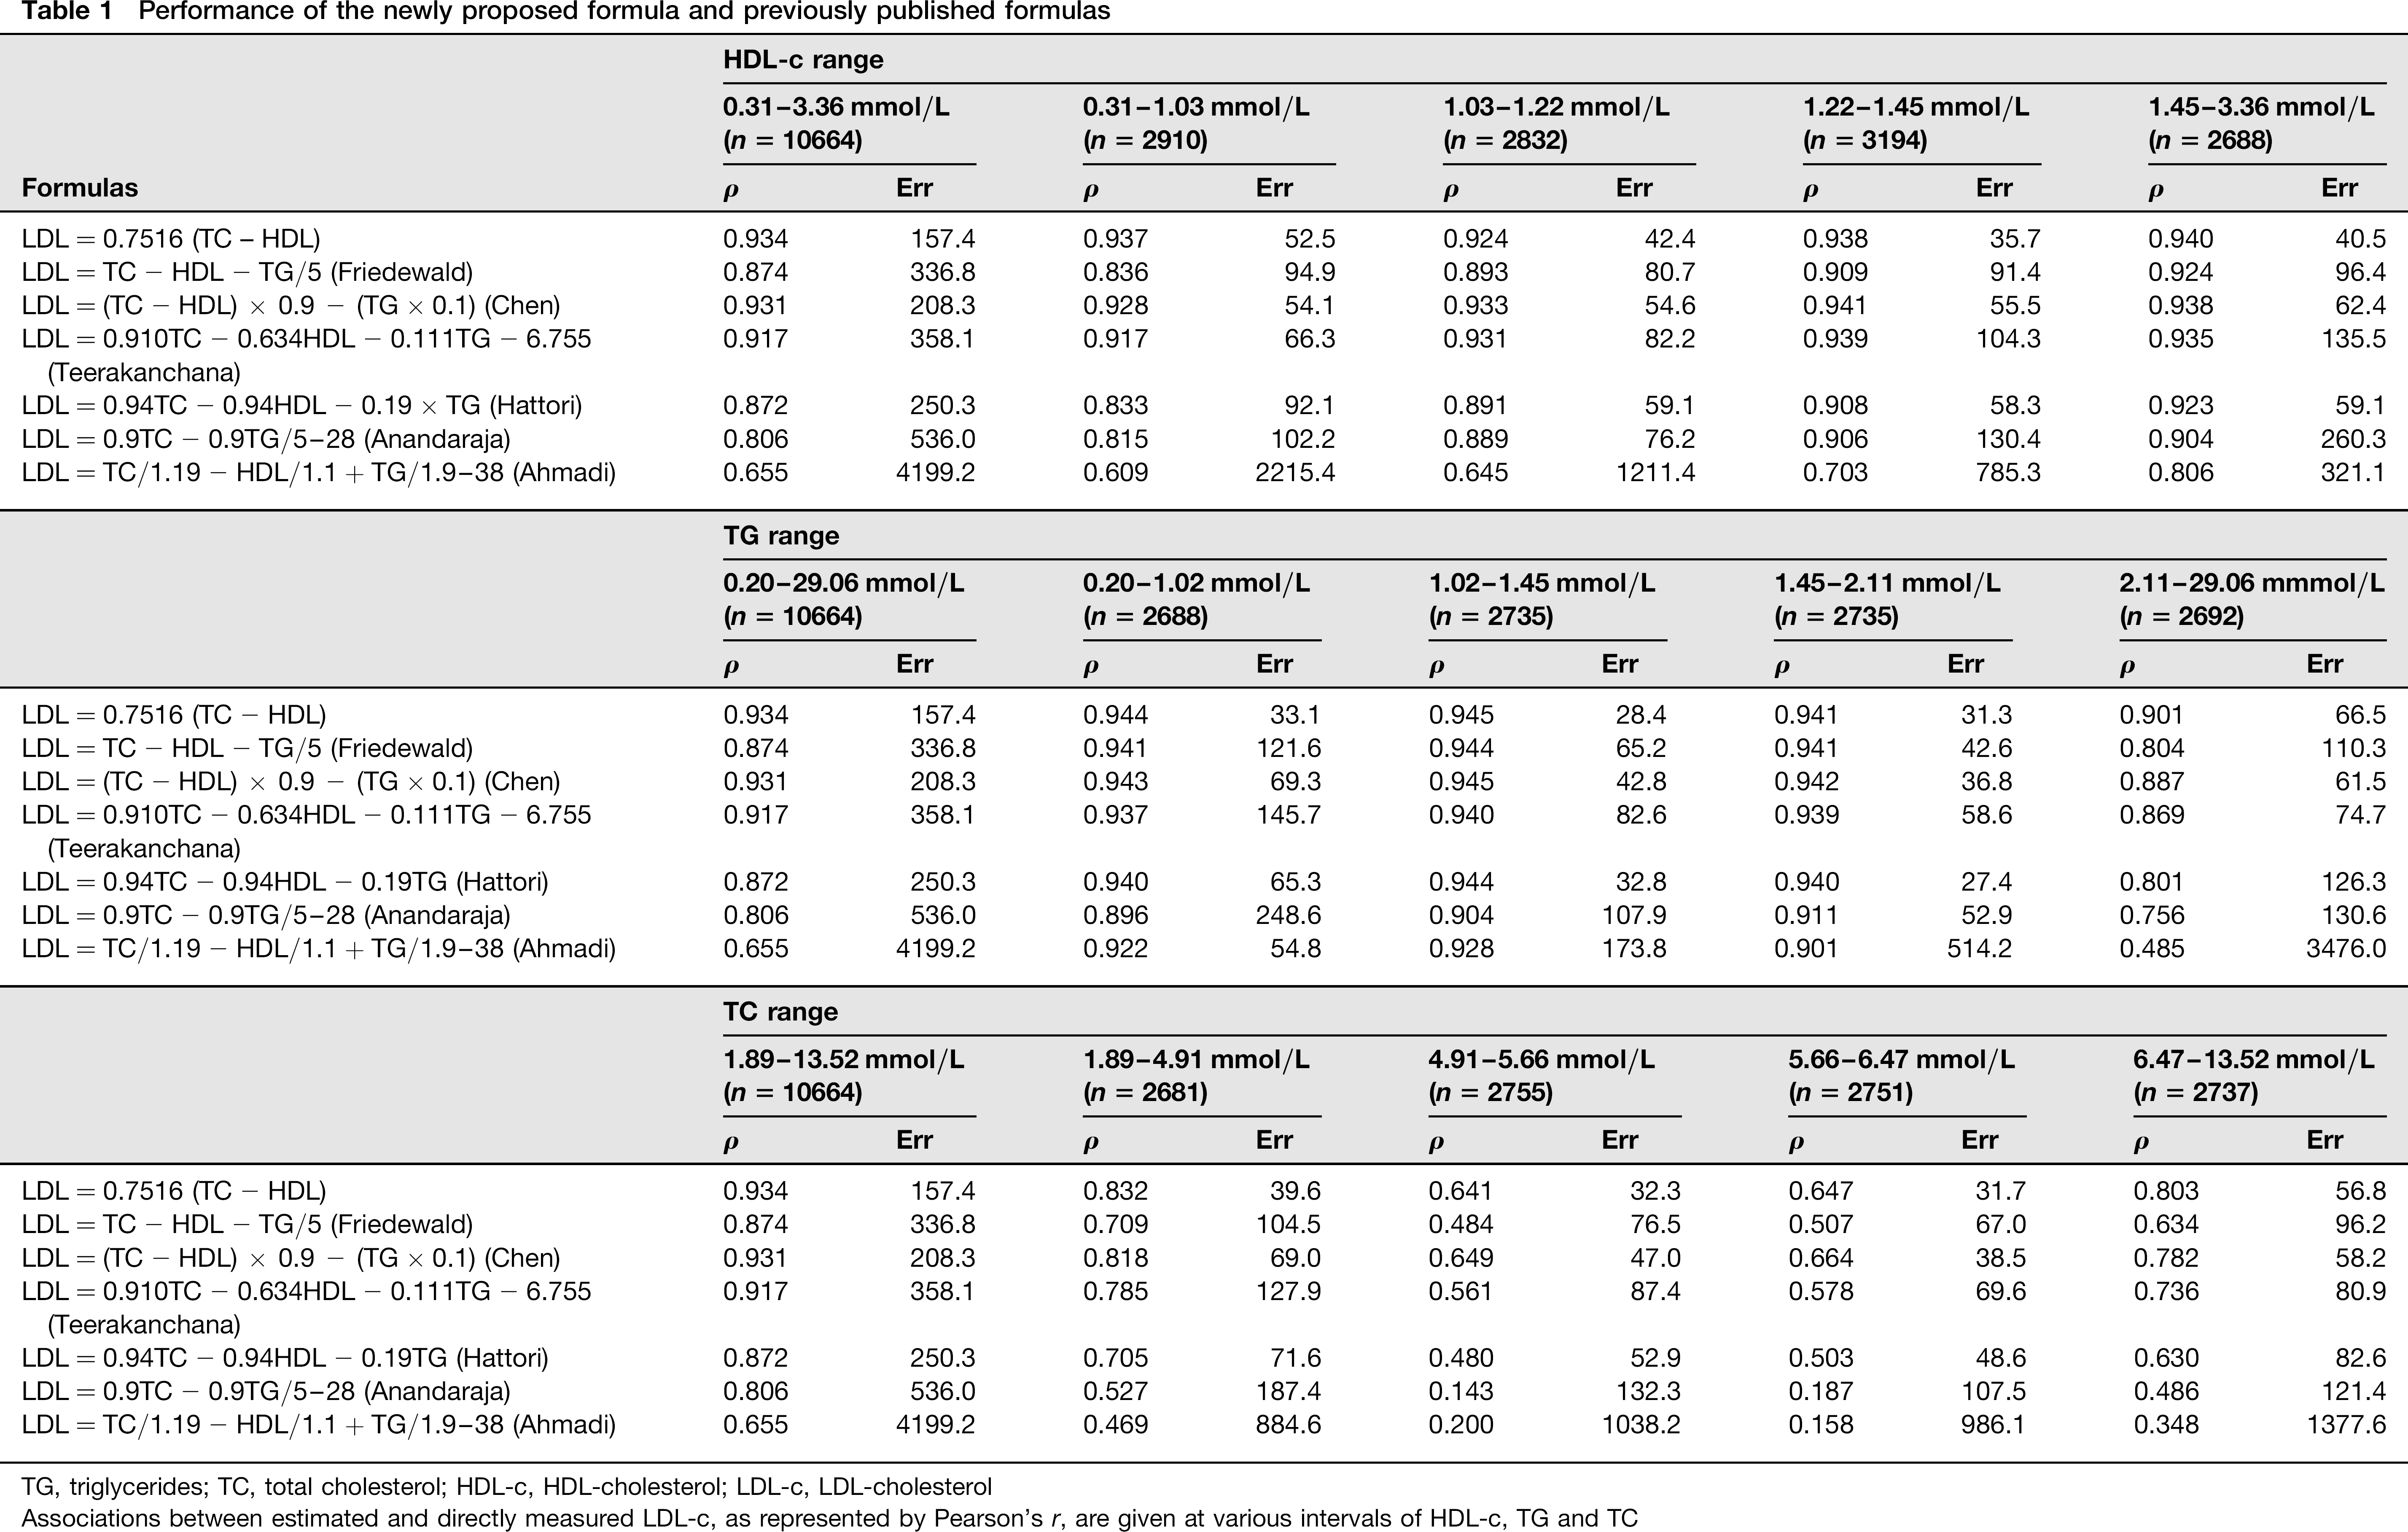
Performance of the newly proposed formula and previously published formulas
TC, total cholesterol; HDL-c, HDL-cholesterol; LDL-c, LDL-cholesterol
Associations between estimated and directly measured LDL-c, as represented by Pearson's r, are given at various intervals of HDL-c, TG and TC
Discussion and conclusion
In spite of the technological advances that clinical laboratories have experienced in recent years, accurate LDL-c determination remains one of the most common problems in clinical chemistry. The gold standard method for quantifying LDL-borne cholesterol in serum is laborious and thus poorly suited to the modern laboratory. 12 More than 40 years ago, Friedewald et al. 1 made an attempt to circumvent this problem by creating a formula to estimate LDL-c from directly measured TC, HDL-c and TG values. This formula is relatively accurate for the majority of individuals in modernized nations. However, it has since become apparent that Friedewald's formula has important limitations, including inaccurate LDL-c estimation in patients with TG greater than 4.5 mmol/L, dyslipidaemics, diabetics, individuals with kidney and liver diseases, and other metabolic conditions.3,4 More recently, it has also been demonstrated that the formula has a poor performance with extreme (both high and low) TC and TG values, which are common in individuals adhering to atypical diets. 2
Less costly direct methods of LDL-c quantification have been developed since Friedewald et al. published their formula; however, these remain too costly for routine clinical use. The majority of these methods achieve the National Cholesterol Education Program (NCEP) standard of a coefficient of variation of less than 4%; however, a few do not. 20 The method used in the present study (DiaSys GmbH, a Wako method) has been demonstrated to fulfil this criterion. 2 On the other hand, estimation of LDL-c using the Friedewald equation is unlikely to fulfil this standard as it aggregates HDL-c, TC and TG measurement errors, in addition to its aforementioned limitations.
Other investigators have addressed the inaccuracy of the Friedewald equation at low TG concentrations, for example Ahmadi et al. 5 developed a formula specifically for LDL-c estimation in patients with TG values below 1.13 mmol/L. However, our results have demonstrated that it is possible to design a single formula with accuracy that is superior to currently published alternatives at all levels of TC and TG. This was achieved by analysing the lipid profile of a very large Brazilian cohort (10,664 patients), determining relationships between TC, TG, LDL-c, HDL-c and derived values. This information was used to generate formulas capable of estimating LDL-c. All of these novel formulas outperformed currently published alternatives. The formula 0.7516 × TC - HDL exhibited the highest accuracy, as indicated by its lower rMSE. We also propose the simplified formula 3/4 (TC -HDL), which retains a high degree of accuracy. According to Table 1, the rMSE of our new formula does not change abruptly along with the different HDL-c levels (being as low as 35.7 up to 52.5), and is clearly lower compared with Friedewald's equation (from 80.7 to 96.4), and also compared with the other equations, with the exception of that of Chen, with an rMSE as low as 54.1 up to 62.4. Considering the different TG levels, our formula also has a better rMSE, from as low as 28.4 up to 33.1 considering TG <2.11 mmol/L, and an rMSE of 66.5 for TG >2.11 mmol/L, in either case outperforming the other equations, except for the Chen formula in this last range, with an rMSE of 61.5. This difference with higher TG levels is expected, as Chen's equation considers TG values for LDL-c estimation, which may be a drawback, as a fasting blood sample is necessary in this case. On the other hand, in low TG levels (0.20-1.02 mmol/L), our formula outperforms Chen's equation considerably, with an rMSE of 33.1 compared with 69.3, and outperforms even that of Ahmadi, supposed to perform well in patients with low TG levels (rMSE of 54.8). Considering the different TC ranges, our formula clearly outperforms the other equations, with an rMSE as low as 31.7 up to 56.8, compared with 38.5-69.0 with Chen's equation, 48.6-82.6 with Hattori's equation and 67.0-104.5 for Friedewald's equation, for example.
The proposed formula also has the advantage of not requiring a fasting blood draw. It has been demonstrated that a regular fasting period does not significantly interfere with TC and HDL-c determination. 21 However, the utility of non-fasting lipids for cardiovascular risk assessment has been questioned by previous findings. 22 Therefore, its utility in the non-fasting context is uncertain.
Recently, it has been demonstrated by others that TC and non-HDL-c are highly correlated. 23 It has also been suggested that non-HDL-c could be used to assess risk in individuals with high TG values, to whom the Friedwald formula applies poorly, or even not at all if TG>4.5 mmol/L. 24 Our findings are consistent with this idea. However, the therapeutic target level for LDL-c has been well established based on clinical studies and the suggested level of <4.14 mmol/L for non-HDL-c is empirical, assuming an average value of 0.78 mmol/L of VLDL-c for every patient, which obviously is not realistic. Hence, our new formula has also the advantage of estimating a more precise value for LDL-c in agreement to the therapeutic levels that have been well determined and are widely accepted in clinical practice.
Our results have the limitation of using a non-reference method for LDL-c determination. However, this method has been demonstrated to meet the NCEP standard of a coefficient of variation below 4%. 2 Some may argue that a Wako method may not meet the NCEP requirements in diseased patients; 20 however, the Friedewald's formula, despite having being widely accepted for decades and still in use by many laboratories, obviously does not meet those requirements at all, as it intrinsically assumes the sum of TG, TC and HDL-c measurement errors. Indeed, LDL-c and HDL-c results obtained with a Wako method may present a positive bias for diseased patients. 20 On the other hand, even if one considers this possibility, it has been demonstrated that measured LDL-c results obtained with this method do not differ significantly from estimated LDL-c values obtained with Friedewald's equation using a correlation analysis in a large cohort. 2 Furthermore, if one considers that our new formula provides estimated LDL-c values with a lower rMSE compared not only to Friedewald's but also with every other published equation, the use of these Wako methods to obtain and compare LDL-c values cannot be disregarded. Due to the large number of individuals represented in the analysis, exhibiting virtually every possible lipid profile and state of health, the proposed formula is likely to be broadly applicable to the general population. However, the evaluation of its performance compared with other direct LDL-c determination methods, to ultracentrifugation followed by beta quantification, and also in other populations with different health and disease states, is strongly advisable before a broader use of our new formula may be recommended. The new proposed equation performs similarly between males (r = 0.9316, rMSE = 59.0) and females (r = 0.9600, rMSE = 98.0), although the rMSE was slightly higher in the last group. For the database used in this study, we had no information about ethnic groups, presence/absence of disease or medication. However, considering the size of the cohort, virtually every common metabolic disease, treated or untreated, is expected to be represented. Interestingly, even considering this situation, our new equation outperforms Friedewald's and any other proposed formula, for any given range of TC, TG or HDL-c, in a very diversified ethnic population such as the Brazilian one. This is a considerable strength of our results. A validation of the equation in a well-established and characterized cohort regarding different health and disease status is under way.
The new simple formula 3/4 (TC – HDL) accurately estimates LDL-c while avoiding some of the limitations of currently published formulas, and presents an attractive alternative when direct quantification is not possible. Application of this formula to directly measured lipid databases from other populations in the future will determine its broad clinical applicability. If validated, it has the potential to increase the accuracy of LDL-c determination, and thus improve the prediction of cardiovascular events in relevant populations.
DECLARATIONS
Footnotes
Acknowledgements:
We thank Drs Stephan J Guyenet (University of Washington, Seattle, WA, USA) and Staffan Lindeberg (University of Lund, Lund, Sweden) for the careful reading of the manuscript and contributions to the text. A special thanks to Ricardo Carvalho (Lisbon, Portugal) for the inestimable help on the mathematical calculations.