
Abstract
Background
Teicoplanin is an antibiotic used for the treatment of endocarditis, osteomyelitis, septic arthritis and methicillin-resistant Staphylococcus aureus. Teicoplanin is emerging as a suitable alternative antibiotic to vancomycin, where their trough serum levels are monitored by immunoassay routinely. This is the first report detailing the development of a liquid chromatography-tandem mass spectrometry (LC-MS/MS) method for measuring teicoplanin in patients' serum.
Methods
An Acquity™ UPLC (ultra-pressure liquid chromatography) tandem mass spectrometer was used to measure teicoplanin concentrations in samples from patients, quality assurance schemes and quality control preparations. Ristocetin was successfully implemented as a suitable internal standard. Ion suppression, linearity, stability, matrix effects, recovery, imprecision, lower limits of quantification and detection, interference and method comparison against immunoassay were all assessed.
Results
Teicoplanin and ristocetin had elution times of 1.39 and 1.24 min, respectively. Ion suppression was shown to be negligible, and linear calibration curves (0–200 μg/mL) were consistently reproduced to have r2 values >0.99. Postextraction stability was achieved up to 20 h, while matrix effects were minimal coupled with sample recovery of >93%. The lower limit of quantification was 1 μg/mL, and 0.2 μg/mL was the lower limit of detection. Interference with other antibiotics was dependent on the combination of drugs present in patients’ serum. A method comparison between immunoassay and LC-MS/MS suggested a negative bias for tandem mass spectrometry.
Conclusions
This novel method of teicoplanin determination by LC-MS/MS is proven to be a robust protocol that is consistent and reproducible. Clinicians searching for alternatives in therapeutic drug monitoring may have an additional option that is potentially more accurate and specific.
Introduction
Teicoplanin was first isolated and identified from Actinoplanes teichomyceticus, and was shown to be highly active against Gram-positive pathogenic bacteria in 1978. 1 Five closely related glycopeptides characterized by different fatty acid chains of 10 and 11 carbon atoms comprise the majority of teicoplanin found in vivo, 2 while four minor related compounds may also be present. 3 Many groups have investigated the biological properties of this peptide-based compound, from the manner in which teicoplanin inhibits peptidoglycan synthesis in the bacterial cell wall, 4 its antibiotic activity and potency, 5 to its mechanism of action. 6 Effective and safe in protection against staphylococcal infections, including methicillin-resistant Staphylococcus aureus (MRSA), teicoplanin has been used for the treatment of endocarditis, osteomyelitis and septic arthritis. 7
Vancomycin, a similar antibiotic, has historically been the drug of choice for the treatment of infections caused by MRSA; however, its potential nephrotoxicity is one of the major limitations for its routine use. Some studies have found an increased risk of renal failure following vancomycin treatment, 8 due to its effects on proximal tubular cells where the antibiotic can accumulate inside lysosomes. Teicoplanin has been shown to have essentially the same efficacy as vancomycin with some advantages, such as once-daily bolus administration, 9 intramuscular use, 10 decreased occurrence of Red man syndrome 11 and significantly lower adverse event rate of nephrotoxicity. 12 Numerous studies have been carried out comparing the efficacy and safety of these two drugs, showing the potential for teicoplanin as an alternative to vancomycin, 13 and detailing its safety profile. 14 There is evidence for disadvantages in teicoplanin administration, such as the possibility of thrombocytopaenia 15 and hypersensitivity, manifesting as fever and chills. 16 The majority of the available evidence favours the bacteriolytic effect of teicoplanin 17 and its higher potency compared with vancomycin. 18 In addition to the similar cost of treatment, 19 teicoplanin is emerging as a suitable and appropriate alternative to vancomycin for Staphylococcus infections.
Prevention of infection is one of the most important issues that clinicians encounter in their daily routine. Teicoplanin has been shown to be effective in the treatment of serious Gram-positive infections in neonates, 20 infants and children, 21,22 through to intensive care patients who require constant monitoring. 23 Patients undergoing total hip replacement 24 are also given doses of teicoplanin, as achievement of rapid therapeutic serum concentrations improves the chances of optimal clinical and bacteriological outcome.
Therapeutic drug monitoring (TDM) plays an important role in the optimization of drug therapy, especially for drugs with narrow therapeutic ranges. Since the introduction of home therapy and the use of teicoplanin in the community, 25 clinicians have paid close attention to serum concentrations of teicoplanin in their administration programmes. It is widely accepted that an optimal loading dose followed by appropriate maintenance doses should achieve trough serum concentrations of >25 μg/mL rapidly and steadily, increasing the chances of full recovery for the patient.
Pilot studies in pigs 26 and rats 27 have given rise to the routine methods that are currently in use for the measurement of teicoplanin in the clinical biochemistry laboratory. The solid-phase enzyme receptor assay was most widely used for TDM initially, 28 until more rapid and accurate assays became available. Some laboratories have used disc diffusion and agar incorporation, with little success. 29 Fluorescence polarization immunoassay (FPIA) was, and still is, considered the gold standard by many for the determination of serum teicoplanin concentrations. The last decade has seen the emergence of high-performance liquid chromatography (HPLC) as a suitable alternative to FPIA, 30 a method that is comparatively faster and more accurate than the traditional immunoassay.
Liquid chromatography-tandem mass spectrometry (LC-MS/MS) is becoming widely accepted as an even more accurate and reliable method for the determination of biological components in a variety of matrices, exhibiting higher levels of sensitivity and specificity compared with other methods. There seems to be a lack of a methodology for teicoplanin determination by LC-MS/MS, possibly due to the size of this molecule 6 and its ionization properties – teicoplanin is a doubly-charged molecule with a molecular weight (M r) of 1881. Additionally, the heterogeneity of the molecule in vivo, 31 and the absence of an obvious (and financially suitable) internal standard, add to the difficulty in measuring its concentration. Five isoforms (A2–1 through A2–5) comprise the majority of detectable teicoplanin, 93% of which are A2–2 and A2–3. The LC-MS/MS method reported here is shown to be specific enough to detect individual variations of this antibiotic, while consistently utilizing ristocetin as a reliable internal standard to determine detector response. This is the first robust method that has been developed for the measurement of teicoplanin in human serum that is suitable for routine use in a clinical biochemistry laboratory.
Materials and method
Materials
Teicoplanin was purchased from Insight Biotechnology (Middlesex, UK) and ristocetin was purchased from Sigma (Dorset, UK). LC-MS/MS-grade methanol, acetonitrile (ACN) and propan-2-ol were purchased from Fisher Scientific (Loughborough, UK). In-house de-ionized water (>18 MΩ) purified with a MilliQ water purification system (Millipore, France) was used. Drug-free serum (DFS) was purchased from Bio-Rad (Hercules, CA, USA). Pooled serum was obtained from anonymized patients’ samples. All samples were stored at −20°C until analysis. Amikacin (Hospira, Warwickshire, UK), gentamycin (Sanofi-Aventis, Surrey, UK), tobramycin (Teva, Buckinghamshire/Eastbourne, UK) and vancomycin (Flynn Pharma, Dublin, Ireland) were all kept sealed at room temperature until analysis.
Calibration standards and quality control material
A 1 mg/mL superstock solution of teicoplanin was prepared in DFS, and working calibrators were made by dilution of the stock solution into blank DFS to give calibrators with teicoplanin concentrations of 0, 12.5, 25, 50, 100 and 200 μg/mL. Four quality control (QC) materials were prepared by dilution of an independent stock of teicoplanin with DFS (20 μg/mL) and pooled serum (50, 100, 200 μg/mL). A 1 mg/mL ristocetin internal standard superstock solution was also prepared; a working concentration was used at 250 μg/mL.
Sample preparation
Serum samples, calibrators or QC samples (25 μL) and 50 μL of internal standard (ristocetin) were protein-precipitated by the addition of 200 μL of methanol. Tubes were vortex-mixed vigorously for 30 s and centrifuged at 16,100
Liquid chromatography
Liquid chromatography was performed on a Waters Acquity™ UPLC (ultra-pressure liquid chromatography) system. Extracted sample (25 μL) was injected onto an Acquity UPLC BEH (ethylene-bridged hybrid) C18 1.7 μm (2.1 × 50 mm) column (Waters, Hertfordshire, UK) in reversed-phase mode. Mobile phase A containing 1% weight for volume (w/v) ammonium acetate and 0.1% volume for volume (v/v) formic acid in de-ionized water was introduced, coupled with the same composition but dissolved in methanol for mobile phase B. Ninety-nine percent mobile phase A was introduced from initial sample injection, and switched to 1% mobile phase A at time 1.00, then 99% mobile phase A at time 1.45. Column flow rate was maintained at 600 μL/min and chromatography was performed at room temperature. Strong wash consisting of 70% and 30% ACN and propan-2-ol, respectively, were used in between sample injections.
Tandem mass spectrometry methods
Tandem mass spectrometry analyses were performed on a Waters Premier system interfaced with a Z-spray electrospray ionization (ESI) source. Mobile phase delivery, on-board auto-sampler and sample injection were monitored by the MassLynx software of the mass spectrometer. The ESI source was operated in the positive electrospray ionization mode at a capillary voltage of 3.5 kV, a sample cone voltage of 30 V, an extraction voltage of 2 V and a radiofrequency lens voltage of 0.5 V. The collision energy was optimized at 15 eV for teicoplanin and 25 eV for ristocetin. Transitions were m/z 940.5 > 316.5 and m/z 1030.4 > 725 for teicoplanin and ristocetin, respectively. MassLynx software (Version 4.1; Micromass, Manchester, UK) provided with the instrument running Windows XP was used for instrument control, data acquisition, peak smoothing, peak area integration and signal-to-noise determinations.
Method validation
Ion suppression
Ion suppression experiments were carried out by continuous postcolumn infusion of teicoplanin (100 μg/mL) directly into the mass spectrometer by a T-piece at a flow rate of 10 μL/min. Phosphate-buffered saline, water and serum samples (n = 5) were each injected into the mass spectrometer and ion suppression/enhancement observed and interpreted by any drop or increase in the total baseline ion count around the retention time of the analyte.
Linearity
Linearity of the method was determined by analysing a set of calibrators with concentrations ranging from 0 to 200 μg/mL. QuanLynx™ software (Version 4.1; Waters) was used to plot nominal values against the generated LC-MS/MS response, defined as teicoplanin:ristocetin peak area ratio. Linearity of the calibrators were confirmed if the correlation coefficient produced by weighted linear regression was >0.99.
Stability
Postextraction stability of both patient and QC samples were assessed by continuous injections of a teicoplanin sample over a 20-h period. The response of both teicoplanin and ristocetin in each sample and the mean percentage change in measured concentration was calculated. Different dilution factors were tested (1:2 to 1:50) to assess the lower limit of stable concentrations of analyte. Four different pH solutions (2.7, 4.6, 6.5 and 8.6) were evaluated to determine an optimal sample solution pH.
Matrix effects and recovery efficiency
Matrix effects of the methodology were determined by preparing a teicoplanin-containing (100 μg/mL) aqueous solution spiked with ristocetin (250 μg/mL), and comparing the amount of teicoplanin measured against a teicoplanin-containing serum solution spiked with ristocetin after protein precipitation with methanol. Recovery was determined by comparing the amount of teicoplanin measured both before and after protein-precipitated serum samples were spiked with ristocetin (250 μg/mL).
Imprecision
Imprecision of the method was assessed by the analysis of four QC samples at various concentrations (20, 50, 100 200 μg/mL). These samples were analysed 10 times each within a single run to determine intra-assay imprecision, and also analysed in separate batches (n = 20) over a four-week period to assess inter-assay imprecision. Both standard deviation and coefficient of variation (CV) were calculated and used to determine the imprecision of the method.
Limit of quantification and limit of detection
Lower limit of quantification (LLOQ) and lower limit of detection (LLOD) were determined by measuring a blank 10 times and calculating the percentage of deviation from the target value and CV. LLOQ was assigned to the lowest concentration with a CV < 20% and a signal-to-noise ratio >10:1. LLOD was assigned to the lowest concentration with a signal-to-noise ratio of >5:1.
Specificity
Interference of the assay was tested using four antibiotics (amikacin, gentamycin, tobramycin and vancomycin). All possible combinations of these four antibiotics with teicoplanin were spiked (100 μg/mL) into serum samples (n = 3) and the response of each group was compared against teicoplanin alone. These compounds were considered not to interfere in the teicoplanin assay if they did not generate a signal in the chromatogram at the teicoplanin elution time, and if the teicoplanin response was minimally altered.
Method comparison
Method comparison was carried out with patients’ samples, QC samples and EQA (external quality assurance) samples that were previously assayed by FPIA, and all samples were stored at −80°C until analysis by LC-MS/MS. Teicoplanin samples (n = 75) were analysed using this LC-MS/MS method and the FPIA protocol on the Abbott TDx (Abbott, Maidenhead, UK).
Results
Liquid chromatography and ion suppression studies
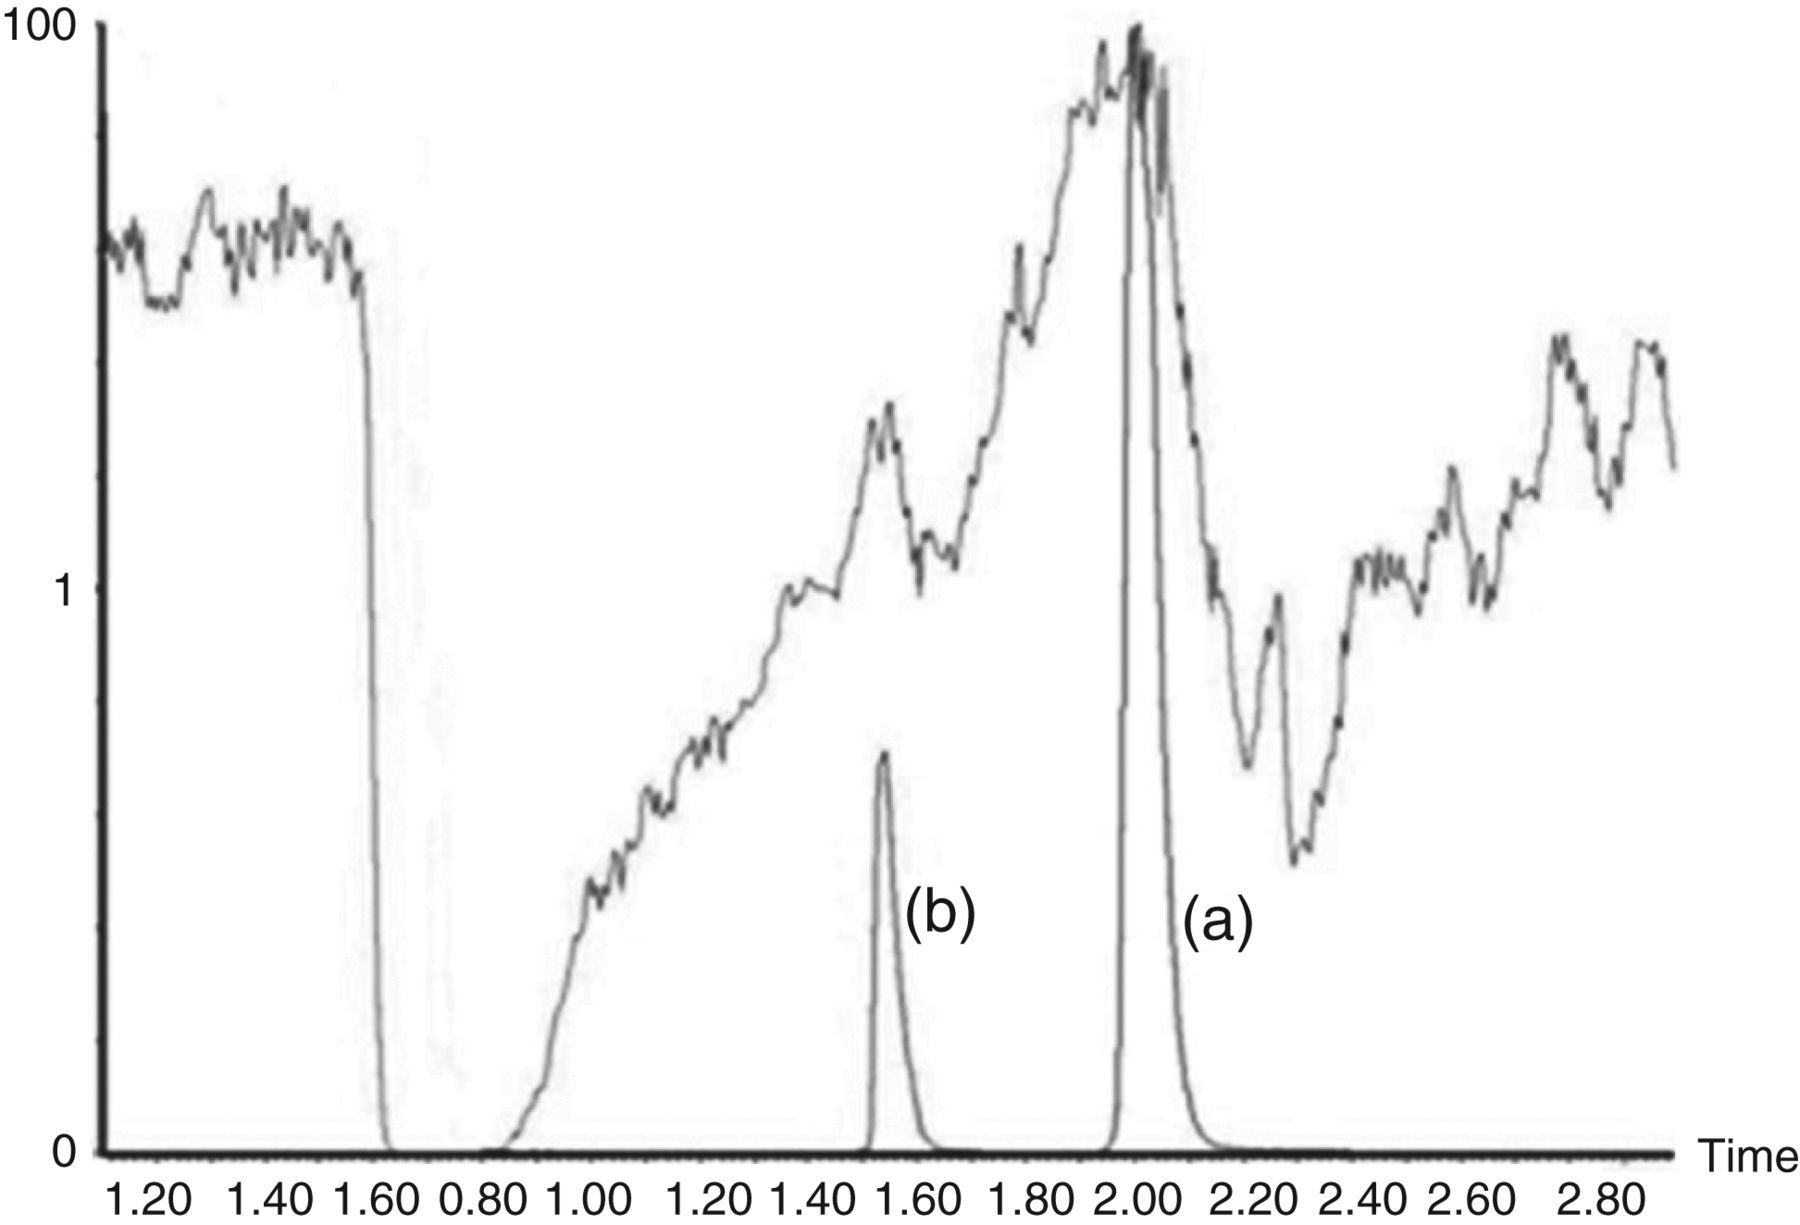
Teicoplanin and ristocetin had elution times of 1.39 and 1.24 min, respectively (Figure 1). A minimal background signal was observed, highlighting the specificity of the assay with specific teicoplanin and ristocetin transitions and no observed interference in the region of interest. Ion suppression experiments consistently showed a dip in baseline ion count at 0.6 min, and the response increase began at one minute and persisted until 2.4 min (Figure 2). Various retention times for teicoplanin and ristocetin were investigated and ion suppression was determined to be absent as both compounds eluted between 1 and 2.4 min, when there was minimal signal interference.
Typical chromatograms for teicoplanin and ristocetin. Transition A is a typical teicoplanin peak with an elution time of 1.39 min and a detector response of 1.09 × 10⁵ cpm (200 μg/mL). Transition B is a typical ristocetin peak with an elution time of 1.24 min and a detector response of 1.43 × 10⁴ cpm (2 μg/mL). Typical ion suppression study from direct infusion. Trace represents the reduction in baseline ion count when teicoplanin and prepared samples are injected into the mass spectrometer simultaneously. Transition A represents a teicoplanin transition (1.09 × 10⁵ cpm) and transition B represents a ristocetin transition (1.43 × 10⁴ cpm)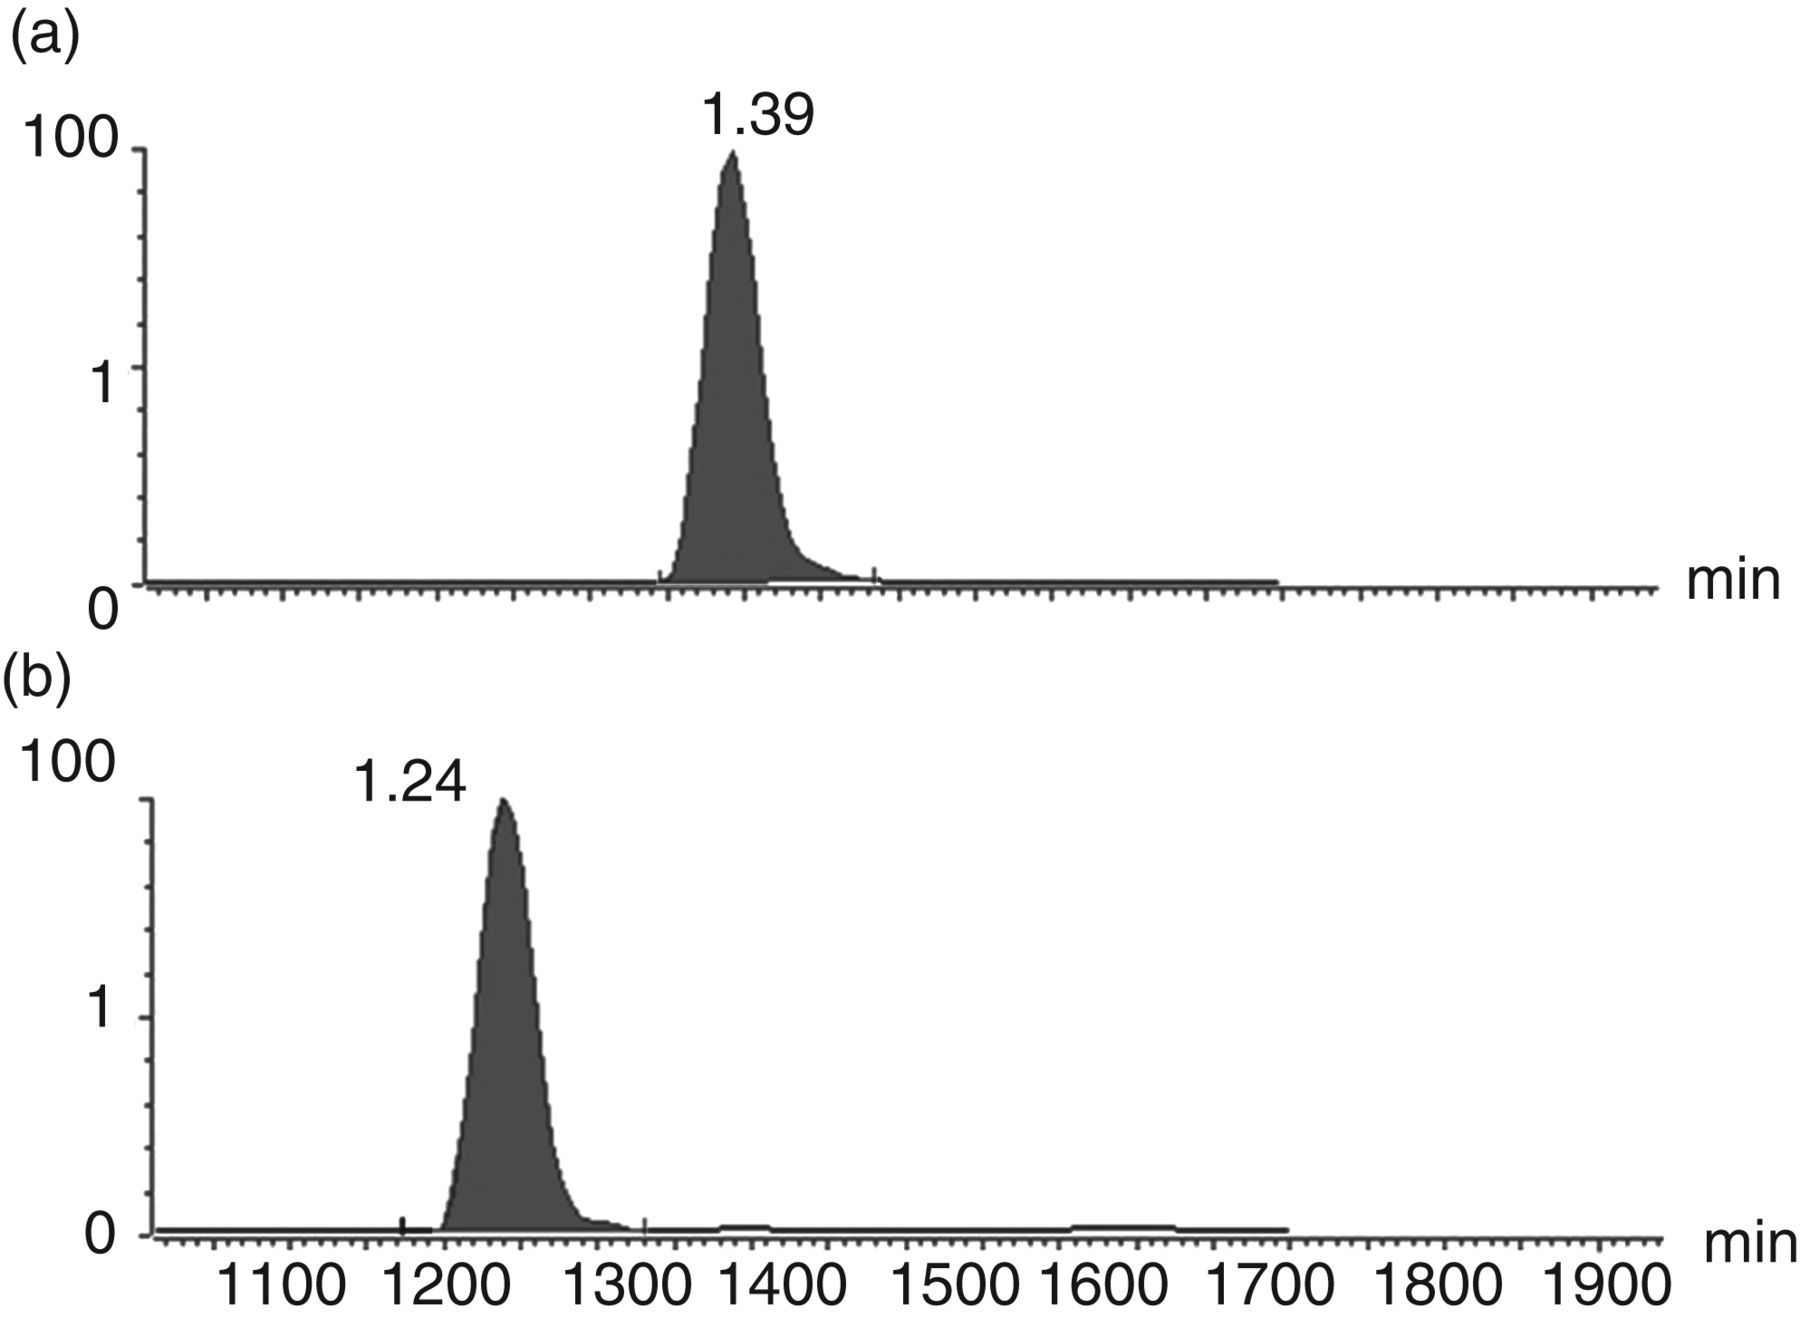
Linearity
This teicoplanin assay was linear up to 200 μg/mL, as linear regression analysis consistently gave r 2 values >0.99. Carryover between the lowest and highest calibrators was <1%, evaluated by interspacing blanks. Ristocetin mass spectrometer detector response was shown to be consistent (CV < 5%), and a functional blank was employed in every curve to determine the y-intercept. These results confirmed the validity of using calibrators made from drug-free serum spiked with teicoplanin and ristocetin, as the region of linearity spanned the entire therapeutic range of 25–75 μg/mL.
Stability
Postextraction stability of a teicoplanin sample (both patients’ samples and QC material) spiked with the internal standard was assessed by multiple injections over a 20-h period. No systematic loss in sensitivity was observed over this period for both teicoplanin and ristocetin peak areas, and the CV of the peak area ratio was 3.1% (Figure 3).
The detector stability of the assay. Injections of 25 μL were performed over a 20-h period, and the individual response of teicoplanin and ristocetin are plotted along with the response. The primary y-axis refers to the peak areas of teicoplanin (♦) and internal standard, ristocetin (▪). The secondary y-axis refers to the response ratio of each injection (▴, teicoplanin:ristocetin peak-area ratio) and is plotted against each corresponding data point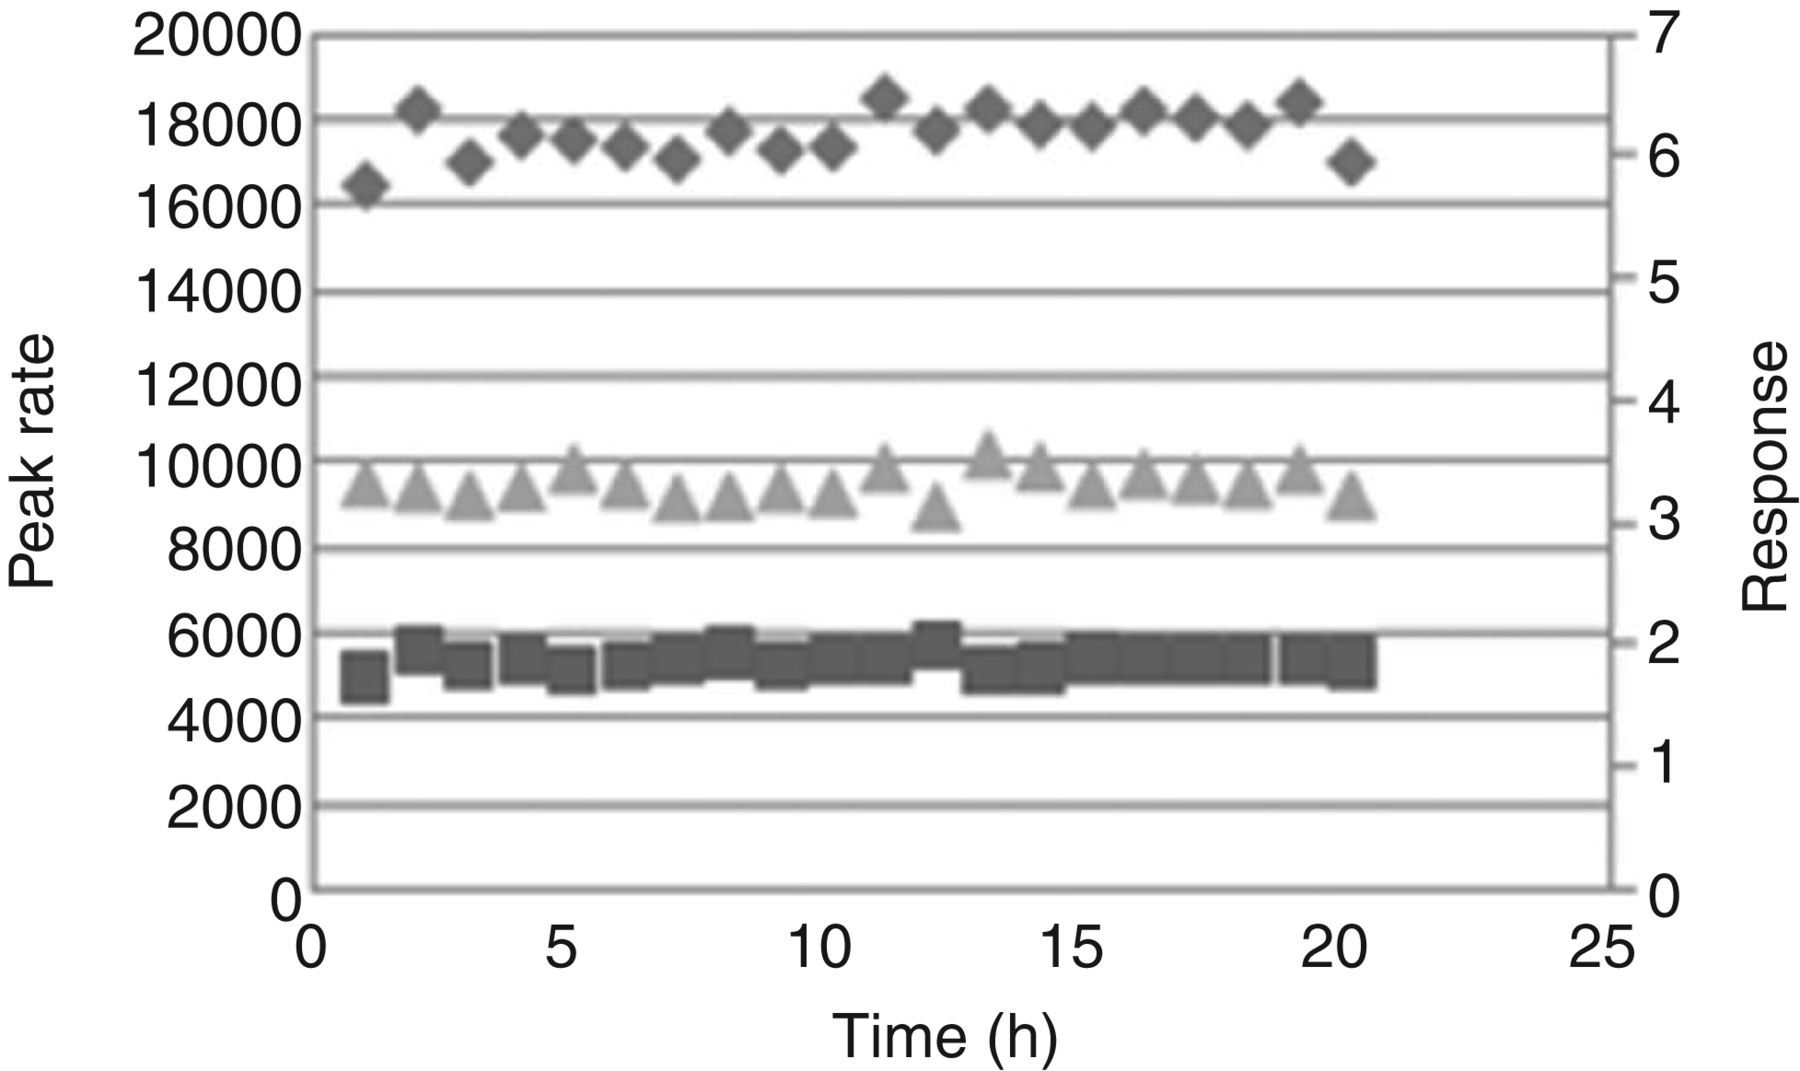
Matrix effects and recovery efficiency
The mean matrix effect of the assay (n = 10 for each parameter) from the measured response of aqueous teicoplanin samples and postextracted spiked samples was calculated to be 7.9% (range: 6.6–9.1%). The mean recovery efficiency (n = 10 for each parameter) for this assay from the measured response of extracted teicoplanin samples was calculated to be 93.4% (range: 90–93.8%).
Imprecision
Intra-assay and inter-assay standard deviation (SD) and coefficient of variation (CV)
Teicoplanin samples at four concentrations (20, 50, 100 and 200 μg/mL) were evaluated for their intra-assay (n = 10) and inter-assay (n = 20) imprecision
Interference
Variation of antibiotic combinations
Teicoplanin (TP) samples spiked with amikacin (A), gentamycin (G), tobramycin (T) and vancomycin (V) were compared against teicoplanin alone, expressed as a percentage difference from 100. Coefficients of variation (CVs) of each group of samples were also expressed as a percentage
Method comparison
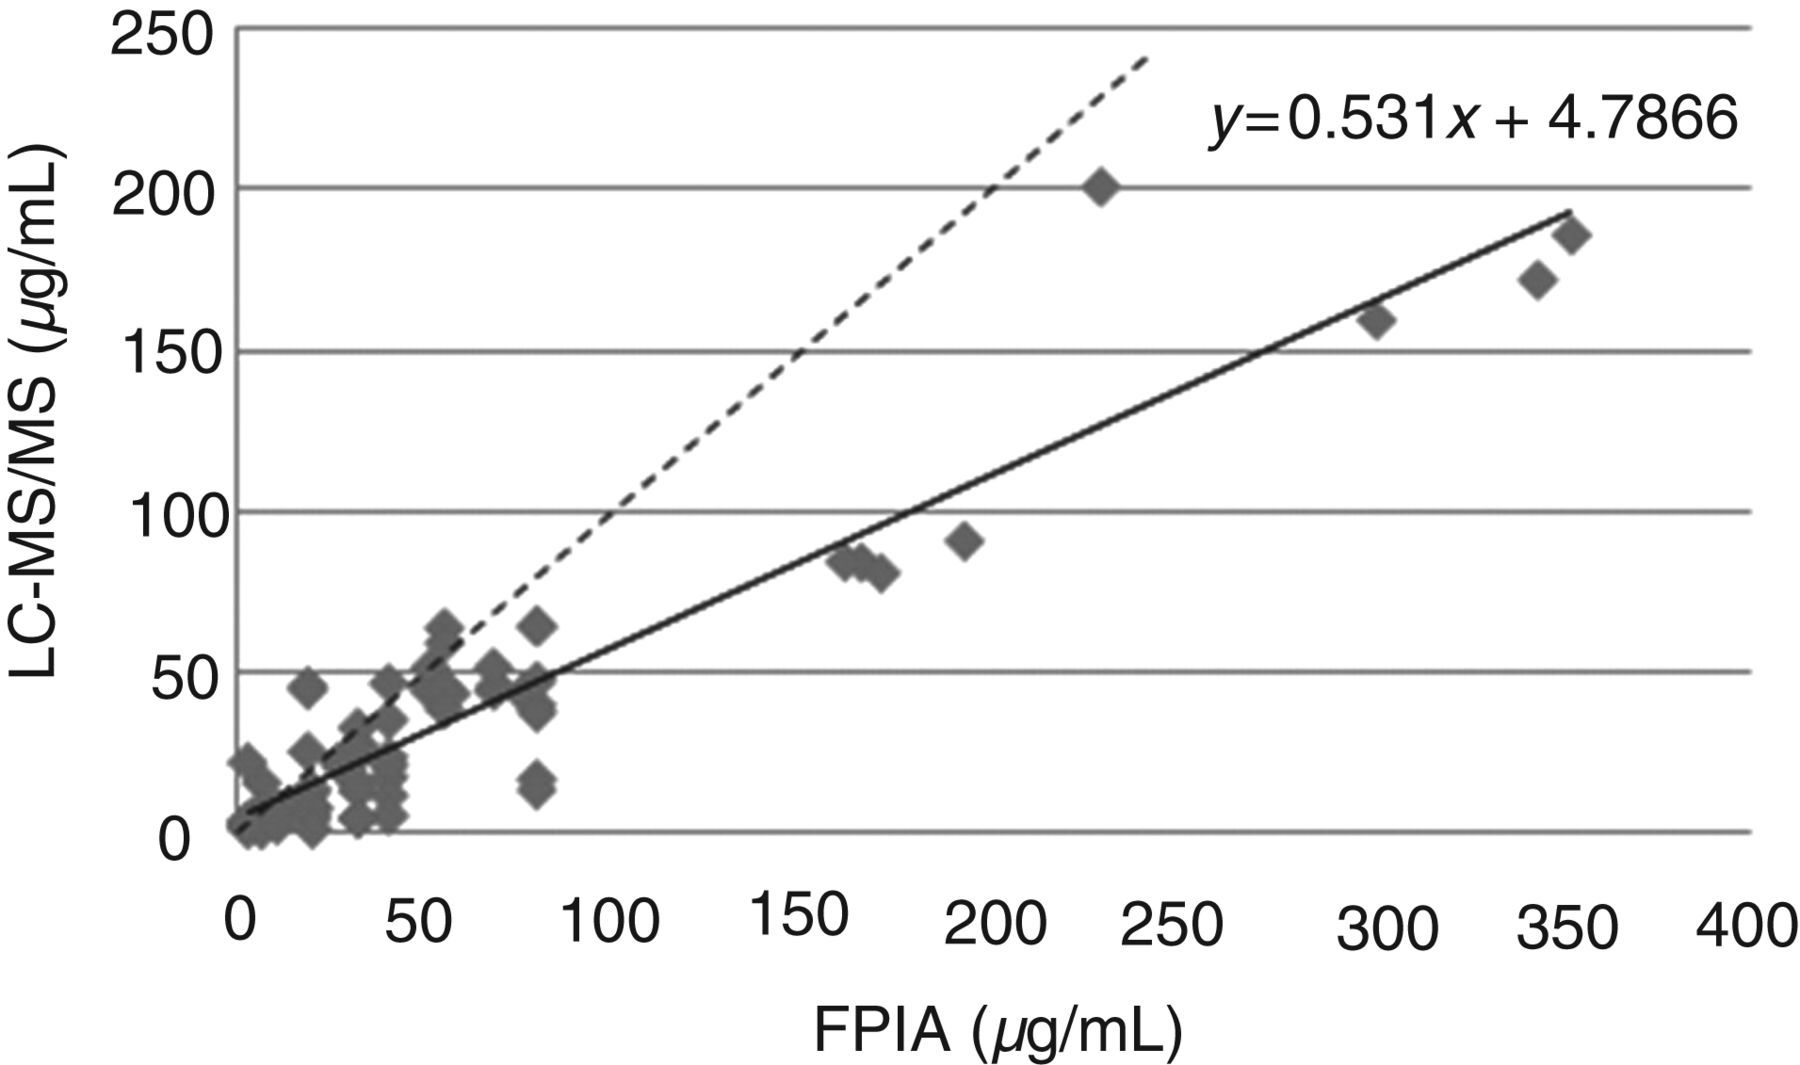
Altman–Bland analysis for FPIA (Abbott TDx) against LC-MS/MS (Figure 4) showed the LC-MS/MS method with a negative bias compared with the FPIA method. The mean bias was −20.8 μg/mL. Linear regression analysis (Figure 5) plotted the results generated from FPIA against the new LC-MS/MS results, and a line of best fit illustrated the relationship between the two methods. The majority of the data supported the trend that LC-MS/MS reports lower values for the same sample analysed by FPIA, where the r2
value was 0.86.
Altman–Bland difference plot comparing the FPIA method (Abbott TDx) and LC-MS/MS method. Dashed lines represent the 1 SD limits of agreement for the mean difference between the two methods. Rectangle represents the therapeutic range of teicoplanin (25–75 μg/mL). FPIA, fluorescence polarization immunoassay; LC-MS/MS, liquid chromatography-tandem mass spectrometry Linear regression graph comparing FPIA versus LC-MS/MS. The relationship between results generated by FPIA and LC-MS/MS are illustrated in this linear regression plot. The line of best fit generated a slope of 0.53 and an r2
value of 0.86. Dashed line represents y = x. FPIA, fluorescence polarization immunoassay; LC-MS/MS, liquid chromatography-tandem mass spectrometry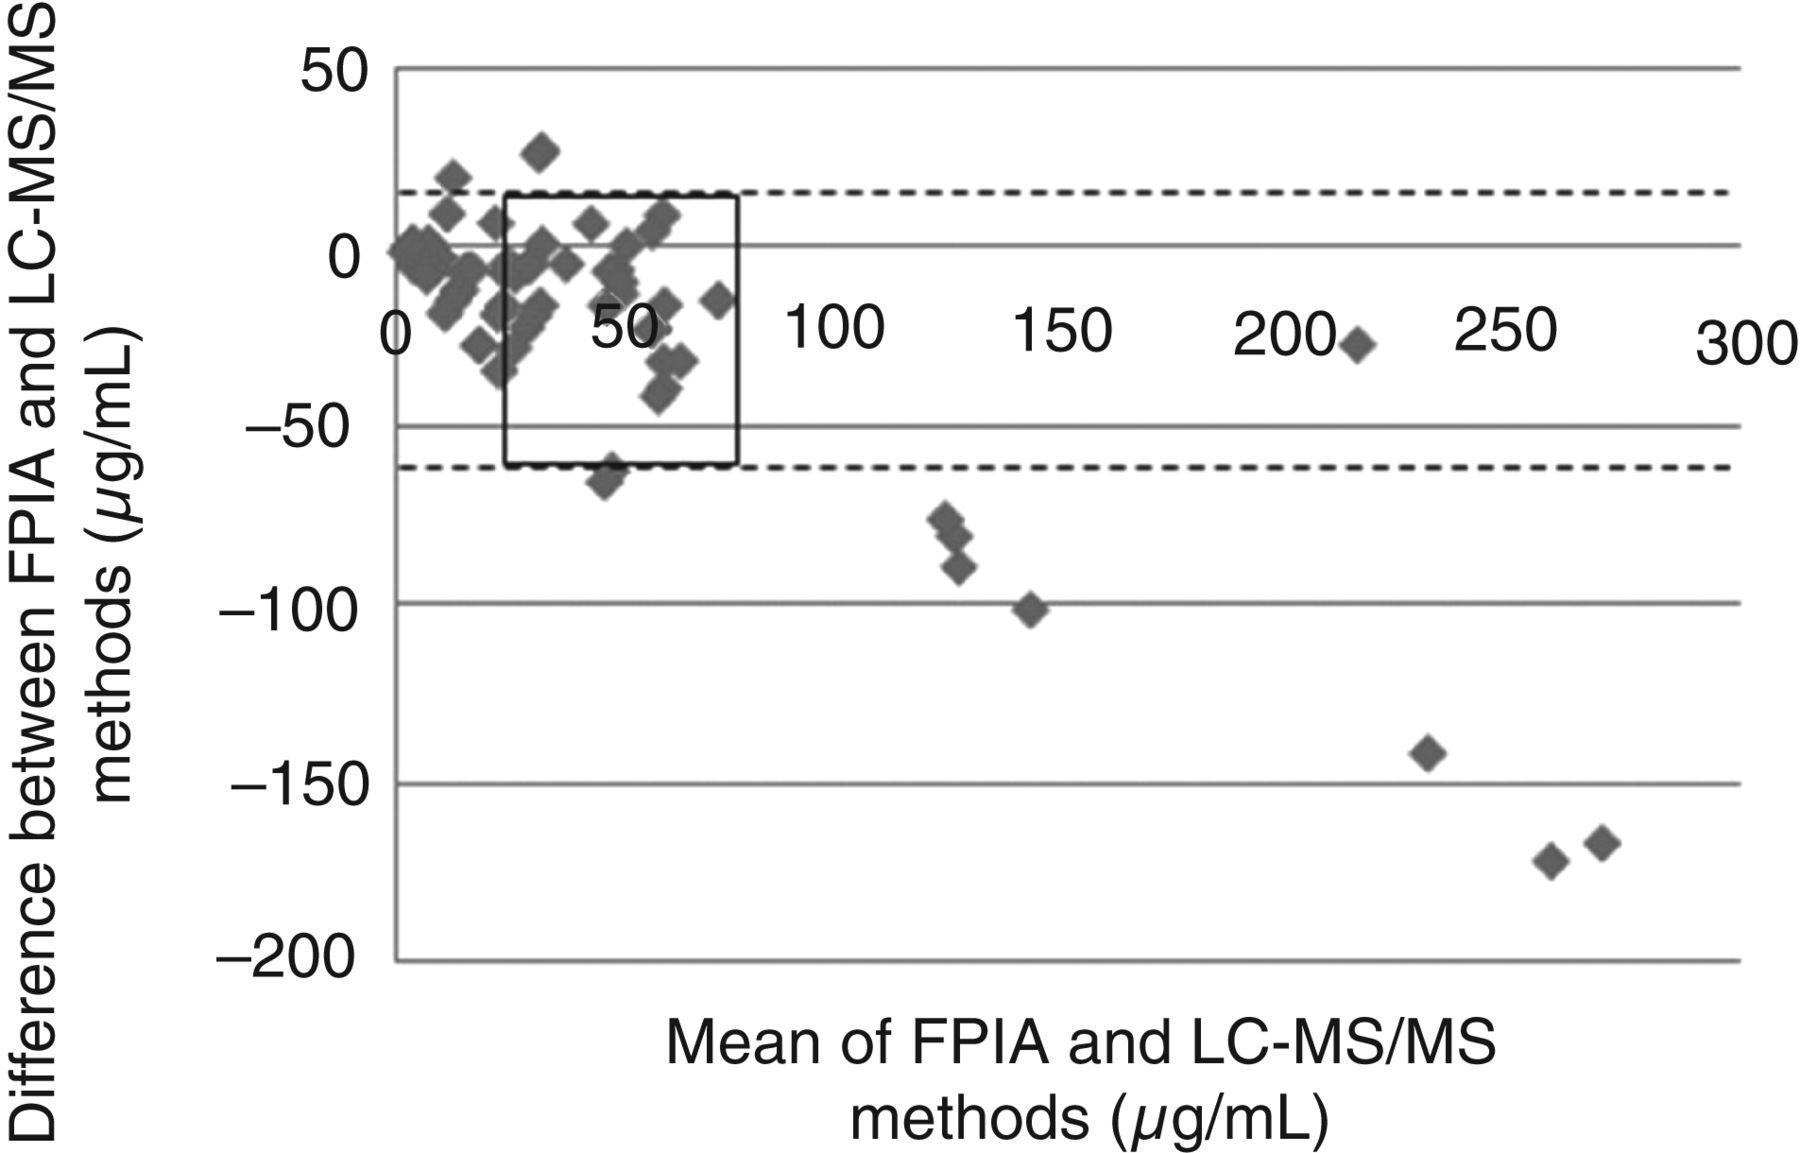
Discussion
LC-MS/MS has long been regarded as a powerful tool for the quantitative determination of biological compounds in a physiological matrix. 32 Methods such as FPIA have traditionally been employed for measuring teicoplanin and other antibiotics in serum, and as alternative techniques became available, a number of laboratories have explored the possibility of other methodologies. 30 With the emergence of teicoplanin as an alternative to vancomycin 13 and the recognized importance of trough serum concentration monitoring in patients’ serum, the need for a mass spectrometry method for teicoplanin determination is now apparent.
This is the first report detailing the development of an LC-MS/MS method for measuring teicoplanin in patients’ serum. Ristocetin was chosen as the internal standard due to its similar structure and ionisation properties. A deuterated teicoplanin compound would be ideal; however, this was found to be cost-prohibitive. Initial suitability of both compounds for LC-MS/MS was confirmed as both teicoplanin and ristocetin co-eluted within 0.15 min of each other. Transitions for both compounds were consistently specific without interference in their respective regions of elution, and ion suppression studies demonstrated that both peaks were detected within the response increase. The lack of ion suppression is crucial in an LC-MS/MS method, as suppression has been shown to compromise detection selectivity. 32 A calibration curve spanning the therapeutic range of 25–75 μg/mL was demonstrated to be linear up to 200 μg/mL, and can be consistently reproduced having an r2 value >0.99. These preliminary steps to ensure both teicoplanin and ristocetin can be reliably measured by LC-MS/MS are of paramount importance so the performance characteristics of the method are suitable and reliable for the intended analytical applications. 33
Repetitive injection of a teicoplanin sample over a 20-h period was carried out to test the postextraction stability of both the analyte of interest and the internal standard. Postextracted samples displaying a high degree of stability would be beneficial to a clinical laboratory with multiple assays set up on a given instrument. The response of teicoplanin:ristocetin was stable over this period of time. Regarding the extraction efficiency of the protocol, matrix effects were found to be <10%, while the recovery efficiency of this assay was shown to be >93%. This is a big advantage in the properties of the method as a wide-ranging sample matrix can be encountered, and effective recovery of the analyte of interest would increase the reliability of the assay. Intra-assay reproducibility experiments showed that the CV for concentrations ranging 20–100 μg/mL were all <7%. Similarly, the inter-assay CV for these limits spanning the entire therapeutic range were all <10%, highlighting assay reliability. 34 Toxicity is usually associated with teicoplanin levels >60 μg/mL; 35 therefore, it was important to establish consistency in this range of concentration.
A large amount of recent evidence suggests the suitability of teicoplanin as a replacement for vancomycin due to its similar antibiotic activity and lower potential for nephrotoxicity. 13,14 It is unlikely that patients are administered teicoplanin in conjunction with vancomycin, tobramycin, gentamycin or amikacin; nevertheless, an inhibition study was carried out evaluating all possible combinations of these antibiotics and their effects on teicoplanin measurement in the mass spectrometer. As shown in Table 2, vancomycin has the potential of lowering the response of teicoplanin detection, possibility due to their molecular similarity in sharing the same glycopeptide core. This experiment highlights the possible interference of vancomycin, and clinicians should be aware if there is a chance of administering both antibiotics simultaneously, although this scenario is unlikely since teicoplanin is given as an alternative to vancomycin.
Different methods for measuring the same analyte have been known to produce results that vary in their relationship to the outcome of the patient. 29 This new assay using LC-MS/MS was compared with FPIA using QC material, EQA samples and past patients’ samples to decipher the fundamental differences in measuring teicoplanin using two different protocols. Altman–Bland plots and linear regression graphs both show the negative bias that exists for teicoplanin measurement by mass spectrometry. FPIA utilizes a polyclonal antibody that potentially measures all isoforms of teicoplanin, while allowing for the possibility of cross-reactivity that is antibody dependent. The new LC-MS/MS method reported here is specific for the A2–2 and A2–3 variations, which accounts for 93% of total teicoplanin found in serum (personal communication, Santa Cruz Biotechnology, Santa Cruz, CA, USA). More importantly, consistency appeared to be high within the therapeutic range, where the majority of drug-monitored serum levels occur and are maintained. Rarely do serum teicoplanin concentrations rise above 100 μg/mL, in which case drastic action has to be taken to avoid any permanent hepatic or nephritic damage.
In conclusion, this is the first time a novel method of monitoring serum teicoplanin concentrations by LC-MS/MS has been reported. The methodology has been developed, optimized and evaluated according to widely accepted protocols and guidelines. 33,34 There are a number of advantages in this method: small sample volume, minimal sample preparation steps, rapid analysis and accurate read-outs. There appears to be differences between results generated by FPIA and LC-MS/MS. While the protocol reported here is robust, continual evaluation will add further confirmation to the LC-MS/MS methodology. Measuring teicoplanin by mass spectrometry has the potential to dramatically improve the reliability in monitoring this antibiotic, whose trough serum concentrations have to be quickly determined to establish the subsequent dosage concentration. 36 This novel method provides an additional option for medical professionals involved in TDM, one that will hopefully become the new gold standard in serum teicoplanin determination.
DECLARATIONS