
Abstract
Background
It is well known that plasma creatinine concentration is affected by muscle mass, while some studies have suggested cystatin C is affected by body mass index (BMI). Our aim was to assess the effects of lean versus fat mass on cystatin C and creatinine derivative equations in estimating glomerular filtration rate (GFR) in healthy young men.
Methods
Three groups of participants were studied: those classified as normal (BMI 18-25 kg/m 2 with body fat, 30%); muscular subjects (BMI .30 kg/m 2 and body fat, 20%); and obese subjects (BMI .30 kg/m 2 and body fat .30%). All underwent diethylenetriamine pentaacetic acid GFR, bio-electrical impedance and dual-energy X-ray absorptiometry body composition analysis, measurement of plasma cystatin C, creatinine and high-sensitivity C-reactive protein and completed a diet record.
Results
Cystatin C was highest in the obese group (0.77 mg/L; 95% confidence intervals [CI] 0.69-0.77) and creatinine was highest in the muscular group (90.1 μmol/L; 95% CI 84.3-96.0). On multivariate analysis, body fat and GFR (P = 0.003) were significant determinants of cystatin C; muscle mass and age affected creatinine significantly (P = 0.02). Using cystatin C equations, Le Bricon and Hoek showed significantly lower estimated GFR in the obese group but performed reasonably well within 50%, 30% and 20% of GFR. Creatinine equations showed significant underestimations of GFR for the muscular group.
Conclusions
Body fat is a significant determinant of cystatin C while creatinine concentration is highly affected by muscle mass and age. Body composition plays an important role in the interpretation of renal function. Cystatin C equations are still accurate in predicting GFR in our healthy male group without chronic kidney disease.
Introduction
Glomerular filtration rate (GFR) is an important index of kidney function, although gold-standard procedures (inulin clearance, radionuclide GFR) are not practical to perform in routine practice, due to cost and complexity. Instead, plasma creatinine has played a major role in assessing renal impairment even though it is well known that plasma creatinine measurement is affected by analytical interferences, and concentrations are highly dependent on age, muscle mass and gender. More recently, attention and focus have been given to estimated GFR (eGFR) equations such as the Modification of Diet in Renal Disease (MDRD) and Chronic Kidney Disease EPIdemiology (CKD-EPI) equations to improve the interpretation of kidney function. Prediction equations based on plasma creatinine are widely used in clinical practice.1,2 These equations, however, are less accurate in healthy individuals, 3 or in individuals with low muscle mass such as in the elderly.
Cystatin C, alternatively, has been proposed as a more robust marker of GFR. Cystatin C is a member of the family of cysteine proteinase inhibitors. 4 It is produced by all nucleated cells at a constant rate, is freely filtered by the glomerulus, re-absorbed and then catabolized in the proximal tubules.4,5 As it is not secreted, its plasma or serum concentration is a good measure of GFR, with several possible advantages over plasma creatinine. 6
Cystatin C has been reported to be a more accurate kidney marker and better at estimating small changes in GFR. 7 Two meta-analyses have reported the superiority of cystatin C as a renal marker compared with plasma creatinine.8,9 Cystatin C prediction equations have also been developed in many specific populations. 10 Some studies have reported cystatin C concentrations to be affected by certain factors that are independent of GFR, such as smoking, inflammation with elevated C-reactive protein (CRP) and thyroid dysfunction.11–13
Recent reports have found elevated cystatin C concentrations in subjects considered to be either overweight or obese.14–16 ‘Overweight’ and ‘obesity’ were categorized by the use of body mass index (BMI) rather than more detailed body composition analysis. In the National Health and Nutrition Examination Survey (NHANES III), Muntner et al. 14 reported elevated cystatin C concentrations corresponded to higher BMI. Similarly, Stevens et al. 15 reported that higher height, weight, BMI and urine creatinine values were associated with higher concentrations of cystatin C. Higher waist circumference was also associated with elevated cystatin C concentrations in apparently healthy subjects. 17 It is possible that higher cystatin C concentrations found in overweight and obese persons are prognostic for future cardiovascular disease (CVD) events, reflecting a preclinical CKD stage.18,19 The influence of lean versus fat mass in predicting cystatin C with control for the effects of renal function, however, has not been previously reported.
The objective of our study was therefore to assess the effect of body composition on cystatin C- and creatinine-based GFR estimation equations using formal GFR measurements and subjects selected in groups of defined body composition. We report findings involving male subjects (three subgroups) of varying body composition, assessed by bio-electrical impedance (BIA) and dual-energy X-ray absorptiometry (DEXA) methods, and 99mTc-diethylenetriamine pentaacetic acid (DTPA) as the reference standard for GFR determination. We hypothesized that current eGFR equations would be strongly affected by differences in body composition.
Patients and methods
Study population
The study group consisted of 67 male individuals between the ages of 18 and 52 years. The study was given ethical approval by the Upper South B Ethics Committee, New Zealand (reference number: URB/09/051).
At first visit, heights were measured using a wall-mounted stadiometer. Weight and body fat percentage were measured by BIA using a Tanita body fat analyser (TBF-305 scale; Tanita Corporation, Arlington Heights, IL, USA). BMI was calculated as height in metres divided by weight in kilograms squared. The participants were divided into three categories based on their BMI and their BIA body fat percentages: ‘normal BMI’ (n = 22), muscular (n = 23) and obese (n = 22). To describe our control group, we used the term ‘normal BMI’ for participants classified according to the World Health Organization's reference-range BMI criteria of 18-25 kg/m2. Muscular participants and obese participants had a BMI ≥30 kg/m2 and were differentiated by body fat percentages. Muscular participants had BIA body fat percentages of less than 20% and obese participants had BIA body fat percentages of greater than 30%. Volunteers who had thyroid dysfunction, diabetes or unsuitable BMI and body fat percentages were excluded from the study. Unsuitable BMI and body fat were deemed as anything that did not fall in the predefined categories stated above. Thyroid dysfunction and diabetes were based on the history given by participants during their interviews, rather than direct measurements. Two participants with type 2 diabetes were excluded after visit one. All eligible participants (n = 67) also completed a four-day diet record.
On the second study day,99mTc-DTPA GFR, and body composition by DEXA analysis were undertaken. GFR was assessed using a six-hour protocol of 99mTc-DTPA clearance. Lithium heparin blood samples were collected at two, four and six hours postinjection. Plasma samples were counted on a Wallac® 1470 Wizard gamma counter (Wallac Oy, PerkinElmerTM Life Sciences, Turku, Finland). GFR and corrected GFR for body surface area were calculated using a software package developed locally. Body surface area was calculated using the DuBois DuBois formula. 20 Remaining samples were stored at – 20°C until batch analysis for cystatin C and creatinine.
After the GFR procedure, participants underwent a detailed body composition scan analysis by means of DEXA (GE Lunar Prodigy; GE Medical Systems, Madison, WI, USA) which was used for the final analysis. The coefficient of variation (CV) for this method was reported at <3%. 21
Cystatin C analytical measurements
Plasma cystatin C concentrations were measured using a particle-enhanced nephelometric immunoassay on the Behring Nephelometer II (Siemens Diagnostics, Marburg, Germany). 22 The in-house imprecision of this assay was calculated at <2.0% within-batch, and <4.5% between- runs. Other studies reported this assay to have a within-batch CV of <3.3% and a between-run CV of <4.5%.23,24 To allow for comparability between our results and the prediction equations used for the eGFR calculations, we used Siemens calibrators which were not standardized to the international certified cystatin C reference material (ERM®-DA471/IFCC). 22
Plasma creatinine measurements
Plasma creatinine was analysed on a Modular P analyser by the enzymatic creatininase reaction which is calibrated to IDMS (Roche Diagnostic, Indianapolis, IN, USA). 25 The bias of the Roche enzymatic method has been reported to be less than 3%. 26 Internal quality control data used in our laboratory indicated the enzymatic method to have a CV of <3.5%.
High-sensitivity CRP and urine protein analysis
Determinations of CRP and urine protein concentrations were based on immunoturbidimetric assays by Roche Diagnostics on a Modular P analyser.27,28
Cystatin C and creatinine eGFR calculations
For each patient, eGFR was estimated by these cystatin C equations: Le Bricon et al., 29 Hoek et al., 30 Larsson et al., 31 MacIsaac et al., 32 Rule et al. 33 and Stevens et al. 34 For the Stevens 3 equation, enzymatically measured creatinine was included in the calculations. For creatinine equations, we used the standardized MDRD and CKD-EPI equations.35,36 Table 1 summarizes all the equations used.
Cystatin C and creatinine equations
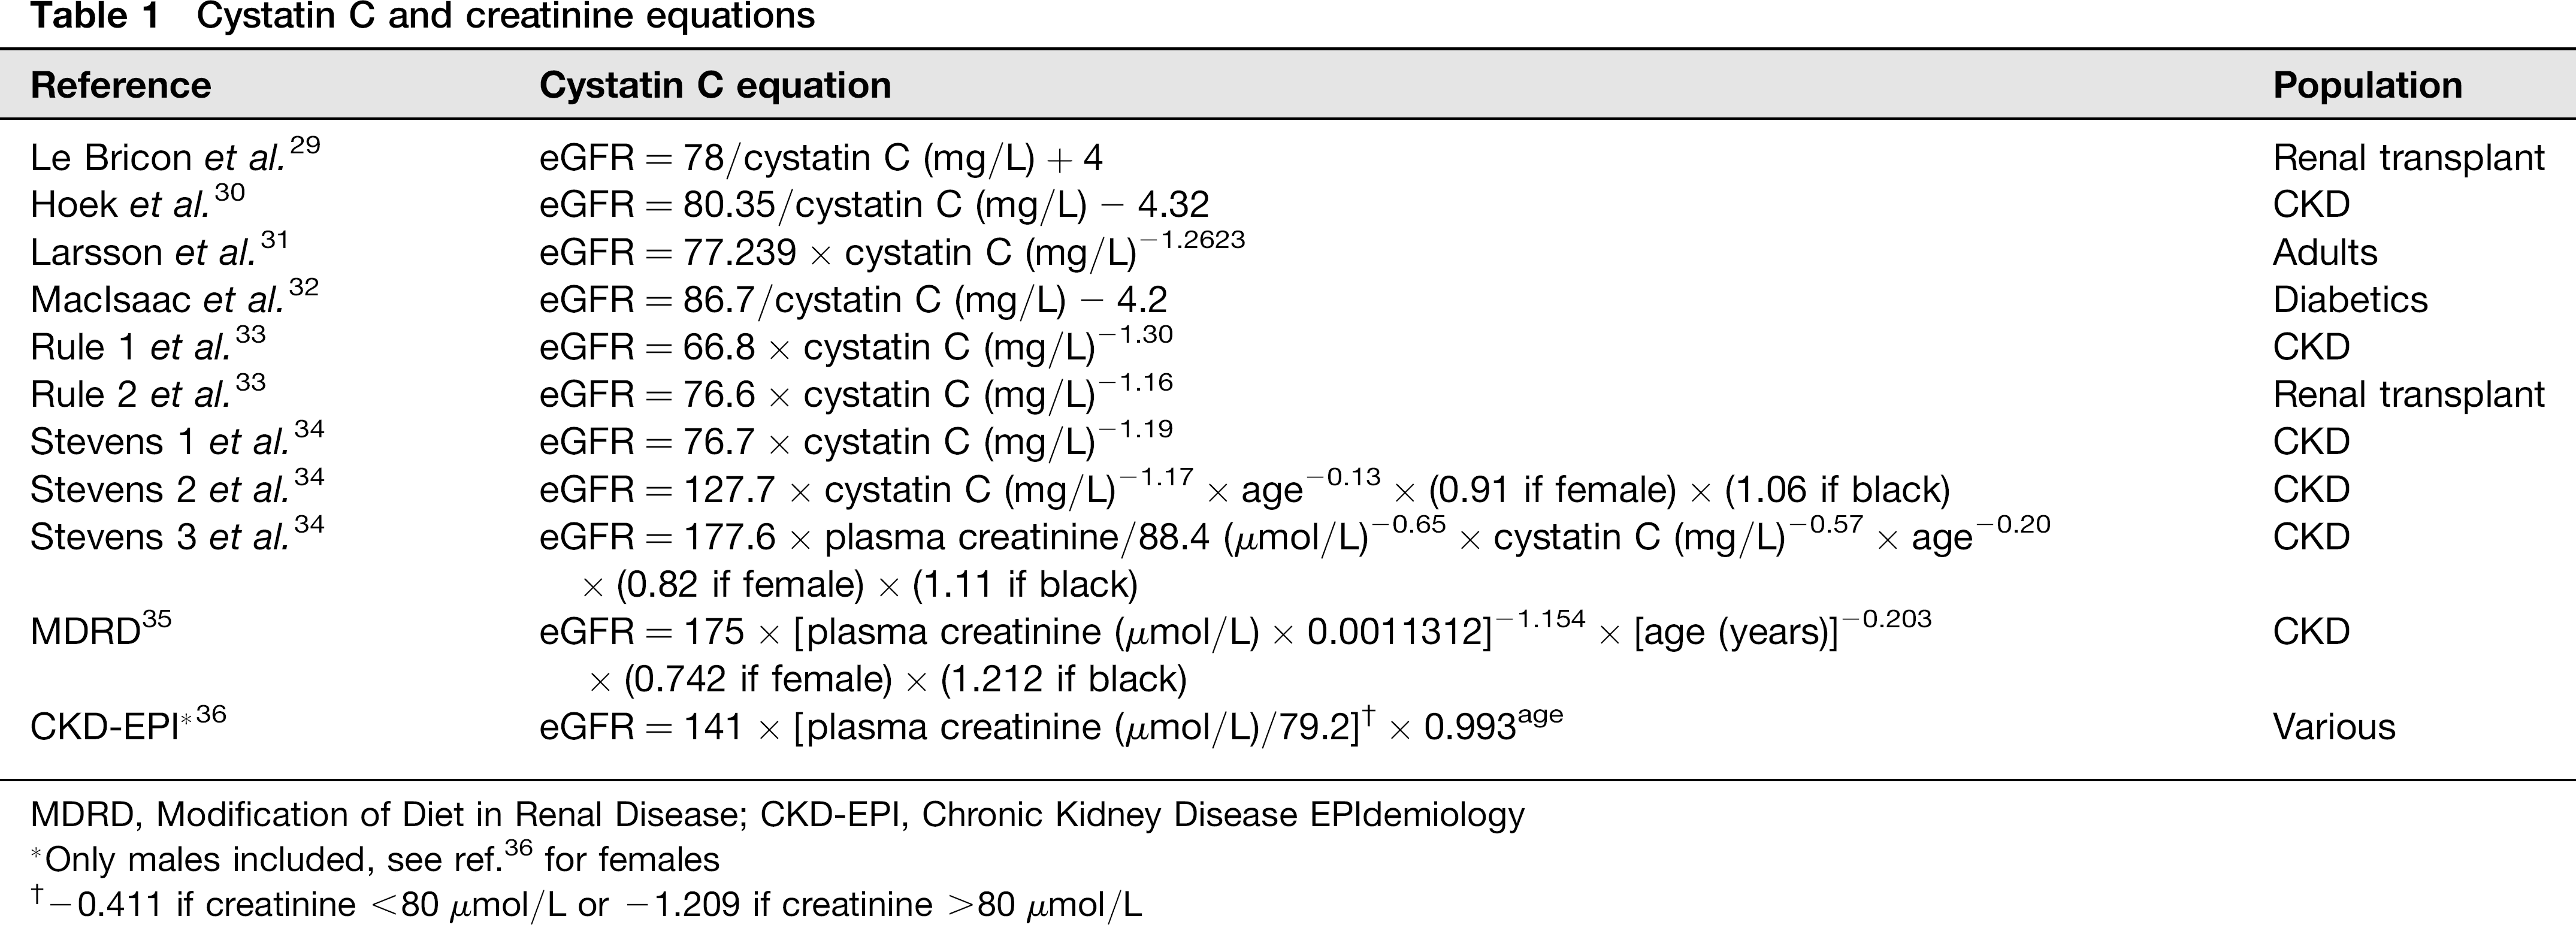
MDRD, Modification of Diet in Renal Disease; CKD-EPI, Chronic Kidney Disease EPIdemiology
Only males included, see ref. 36 for females
-0.411 if creatinine <80 μmol/L or -1.209 if creatinine >80μmol/L
Estimation of skeletal muscle mass
DEXA body composition exploits the principle that dual energy X-rays, using scattering rays and photoelectric absorption, can determine the mass and composition of any two known materials, i.e. lean, fat and bone mass. Estimation of skeletal muscle mass was calculated from the equation of Kim et al. 37 based on appendicular lean tissue mass obtained using DEXA, which did not consist of intermuscular fat.
Dietary analysis
All eligible participants completed a four-day diet record prior to the second study visit. Participants were asked not to change their habitual diet consumption and to estimate the quantities eaten using a combination of photographs and household measures. 38 Nutrient analyses were undertaken using Foodworks Professional 2009, Version 6.0.2562 (Xyris Software Ltd, Kenmore Hills, Queensland, Australia) to access New Zealand FOODfiles 2004 (Crop and Food Research, Palmerston North, Ministry of Health, Wellington, New Zealand).
Statistical analysis
Statistical analyses were conducted using MedCalc® (http://www.medcalc.be, version 9.3.5.0; MedCalc Statistical Software, Mariakerke, Belgium). Both creatinine (P = 0.534) and cystatin C (P = 0.853) were of normal distribution evaluated by the Kolgomorov–Smirnov test. We assessed cystatin C- and creatinine-derived eGFR with respect to bias, correlation coefficients and absolute percentage error relative to the radionuclide GFR results. Bias, defined as systematic deviation of the predicted eGFR from radionuclide GFR, was expressed as mean (±95%) confidence intervals (CI) bias and limits of agreement (±2SD) by Bland- Altman analysis. 39 The proportions of patients within 20%, 30% and 50% of the radionuclide GFR mean were compared by chi-squared analysis. Comparisons of means between study groups were done using t-tests. Determinants of cystatin C and creatinine were determined by using Spearman's correlation and by stepwise multivariate analysis using the NCSS statistical software programme (version 07.1.04, released January 2009).
Sample size
Based on 601 data points, approximately 80% of GFR estimates using plasma creatinine will agree with measured Tc-DTPA GFR in a healthy population. 40 With this assumption, we calculated that 22 participants in each group will provide us with 80% power, with a P < 0.05 significance level to detect a 40% difference in agreement between the groups. 41 Due to the expected disparity in each group, we were not looking explicitly for an agreement for the estimates, but rather results that may fall within the predefined tolerances (within 50%, 30% and 20% of Tc-DTPA GFR).
Results
Participant characteristics
Of all the participants, only seven were current smokers, with only four participants smoking more than five cigarettes per day. Three participants took medication for asthma. Participant characteristics are shown in Table 2.
Participant characteristics (mean and ranges)
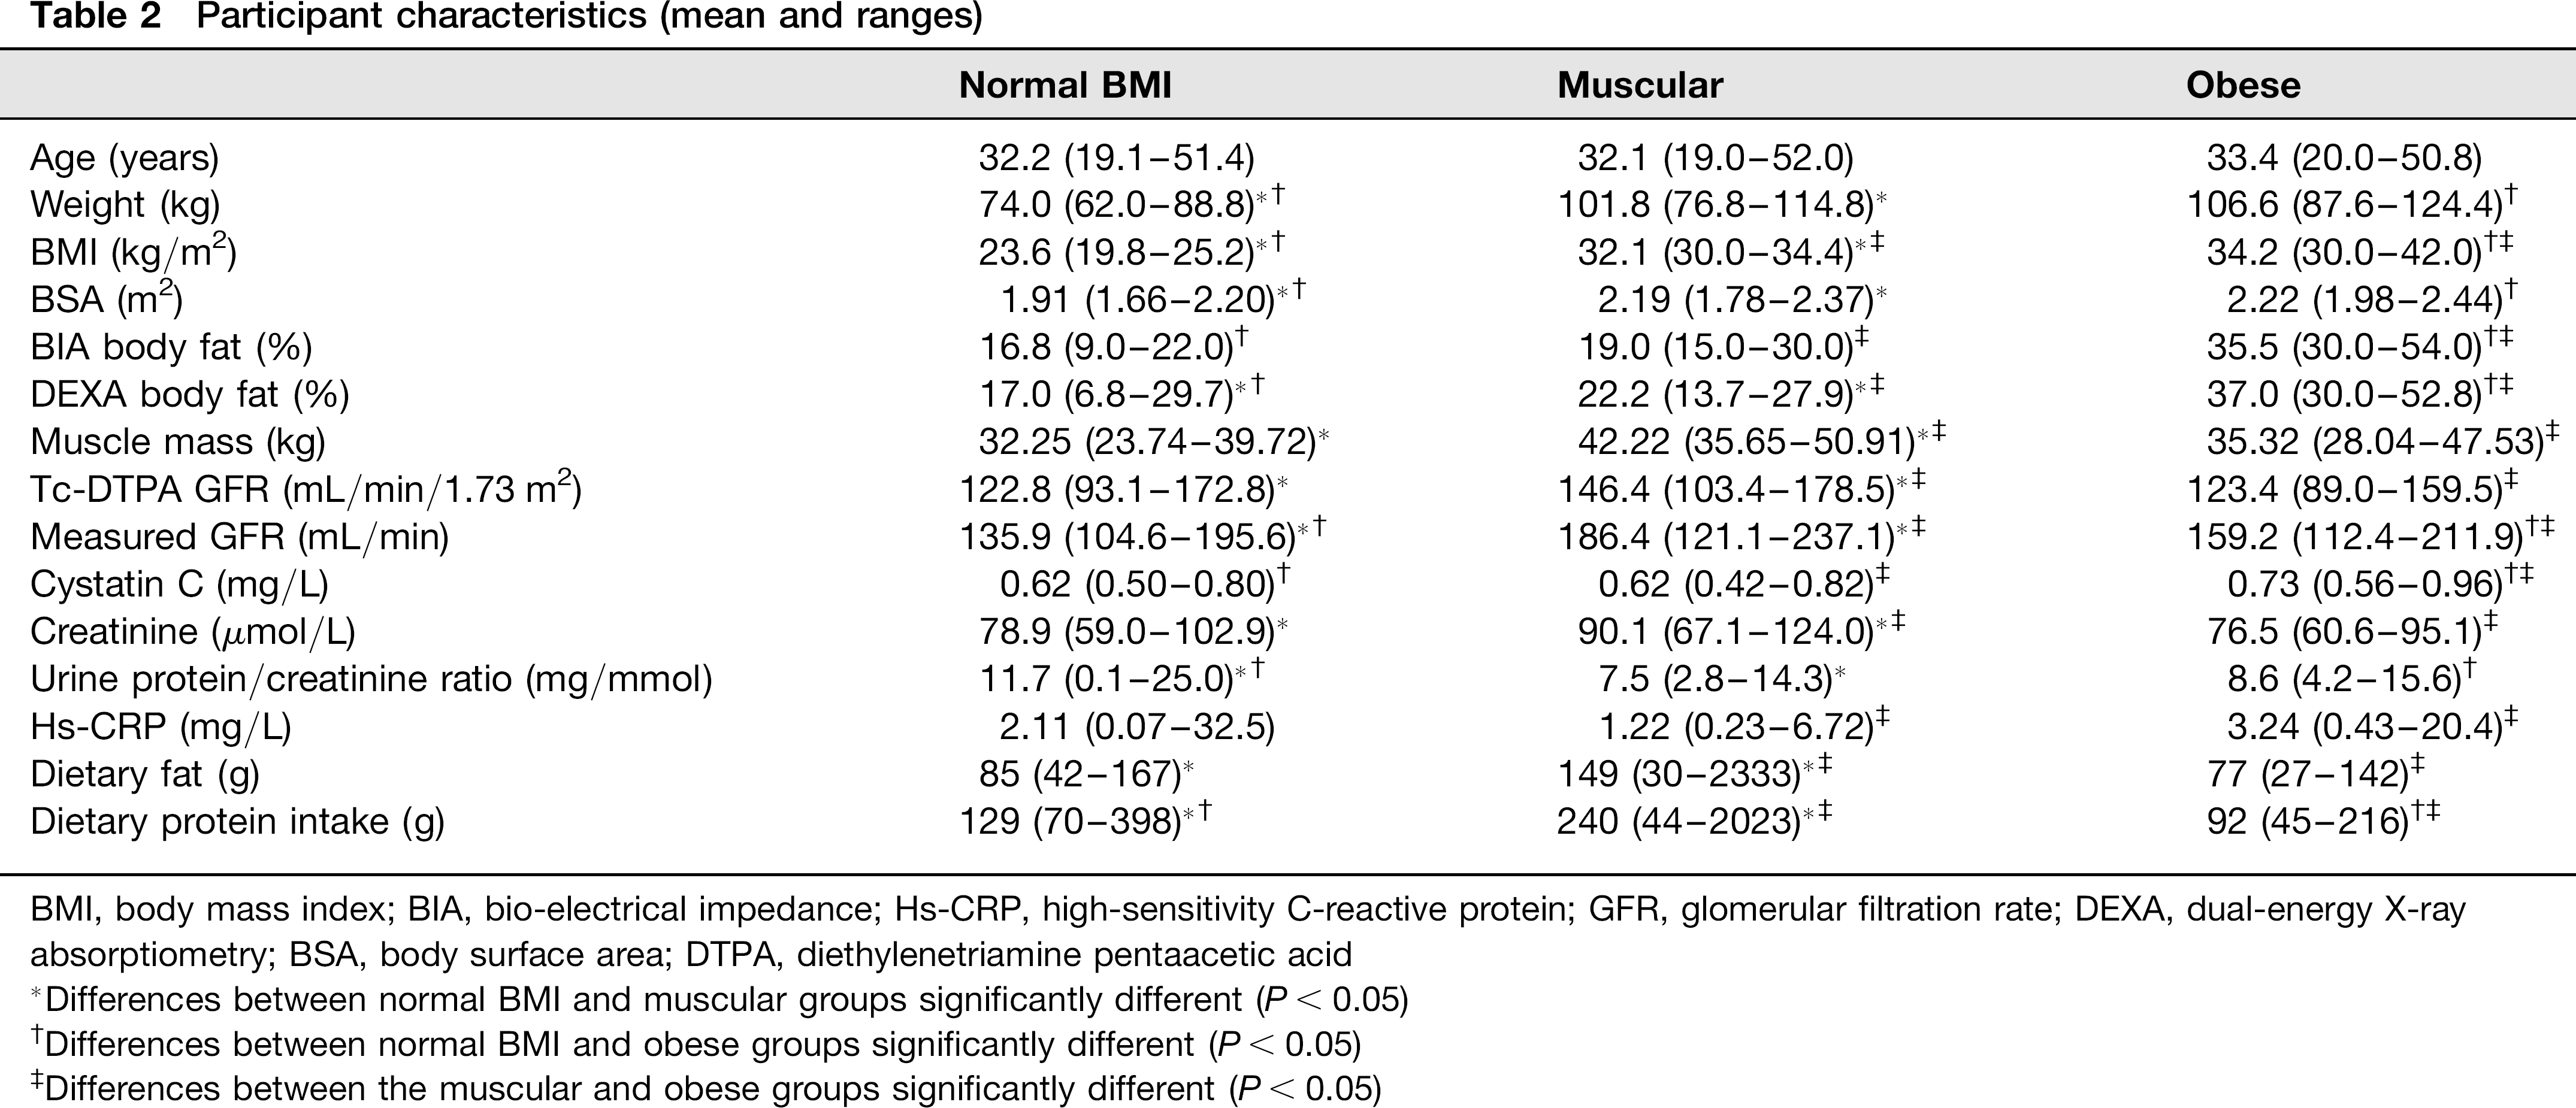
BMI, body mass index; BIA, bio-electrical impedance; Hs-CRP, high-sensitivity C-reactive protein; GFR, glomerular filtration rate; DEXA, dual-energy X-ray absorptiometry; BSA, body surface area; DTPA, diethylenetriamine pentaacetic acid
Differences between normal BMI and muscular groups significantly different (P< 0.05)
Differences between normal BMI and obese groups significantly different (P < 0.05)
Differences between the muscular and obese groups significantly different (P < 0.05)
Body composition
Both BIA method and DEXA measurements were found to compare well (mean bias = -1.7% [95% CI = -2.85 to -0.45, 2SD = -11.3 to 8.0]). The obese group was found to have the highest DEXA body fat, 37% (95% CI: 34.6–39.4), compared with the other two groups (P <0.0001) (Figure 1a). The body fat for the muscular group, 22.2% (95% CI: 20.6–23.8), was also significantly higher than the body fat of the normal BMI group, 17.0% (95% CI: 13.9–20.1) (P = 0.0034). The muscular group had the highest skeletal muscle content (mean = 42.22 kg; 95% CI: 40.57–43.90) (P < 0.0001), followed by the obese group (P = 0.05) (Figure 1b).
(a) Box and whisker plot for dual-energy X-ray absorptiometry (DEXA) body fat (%) for each group (mean and interquartile ranges). (b) Box and whisker plot for skeletal muscle mass for each group (mean and interquartile ranges). BMI, body mass index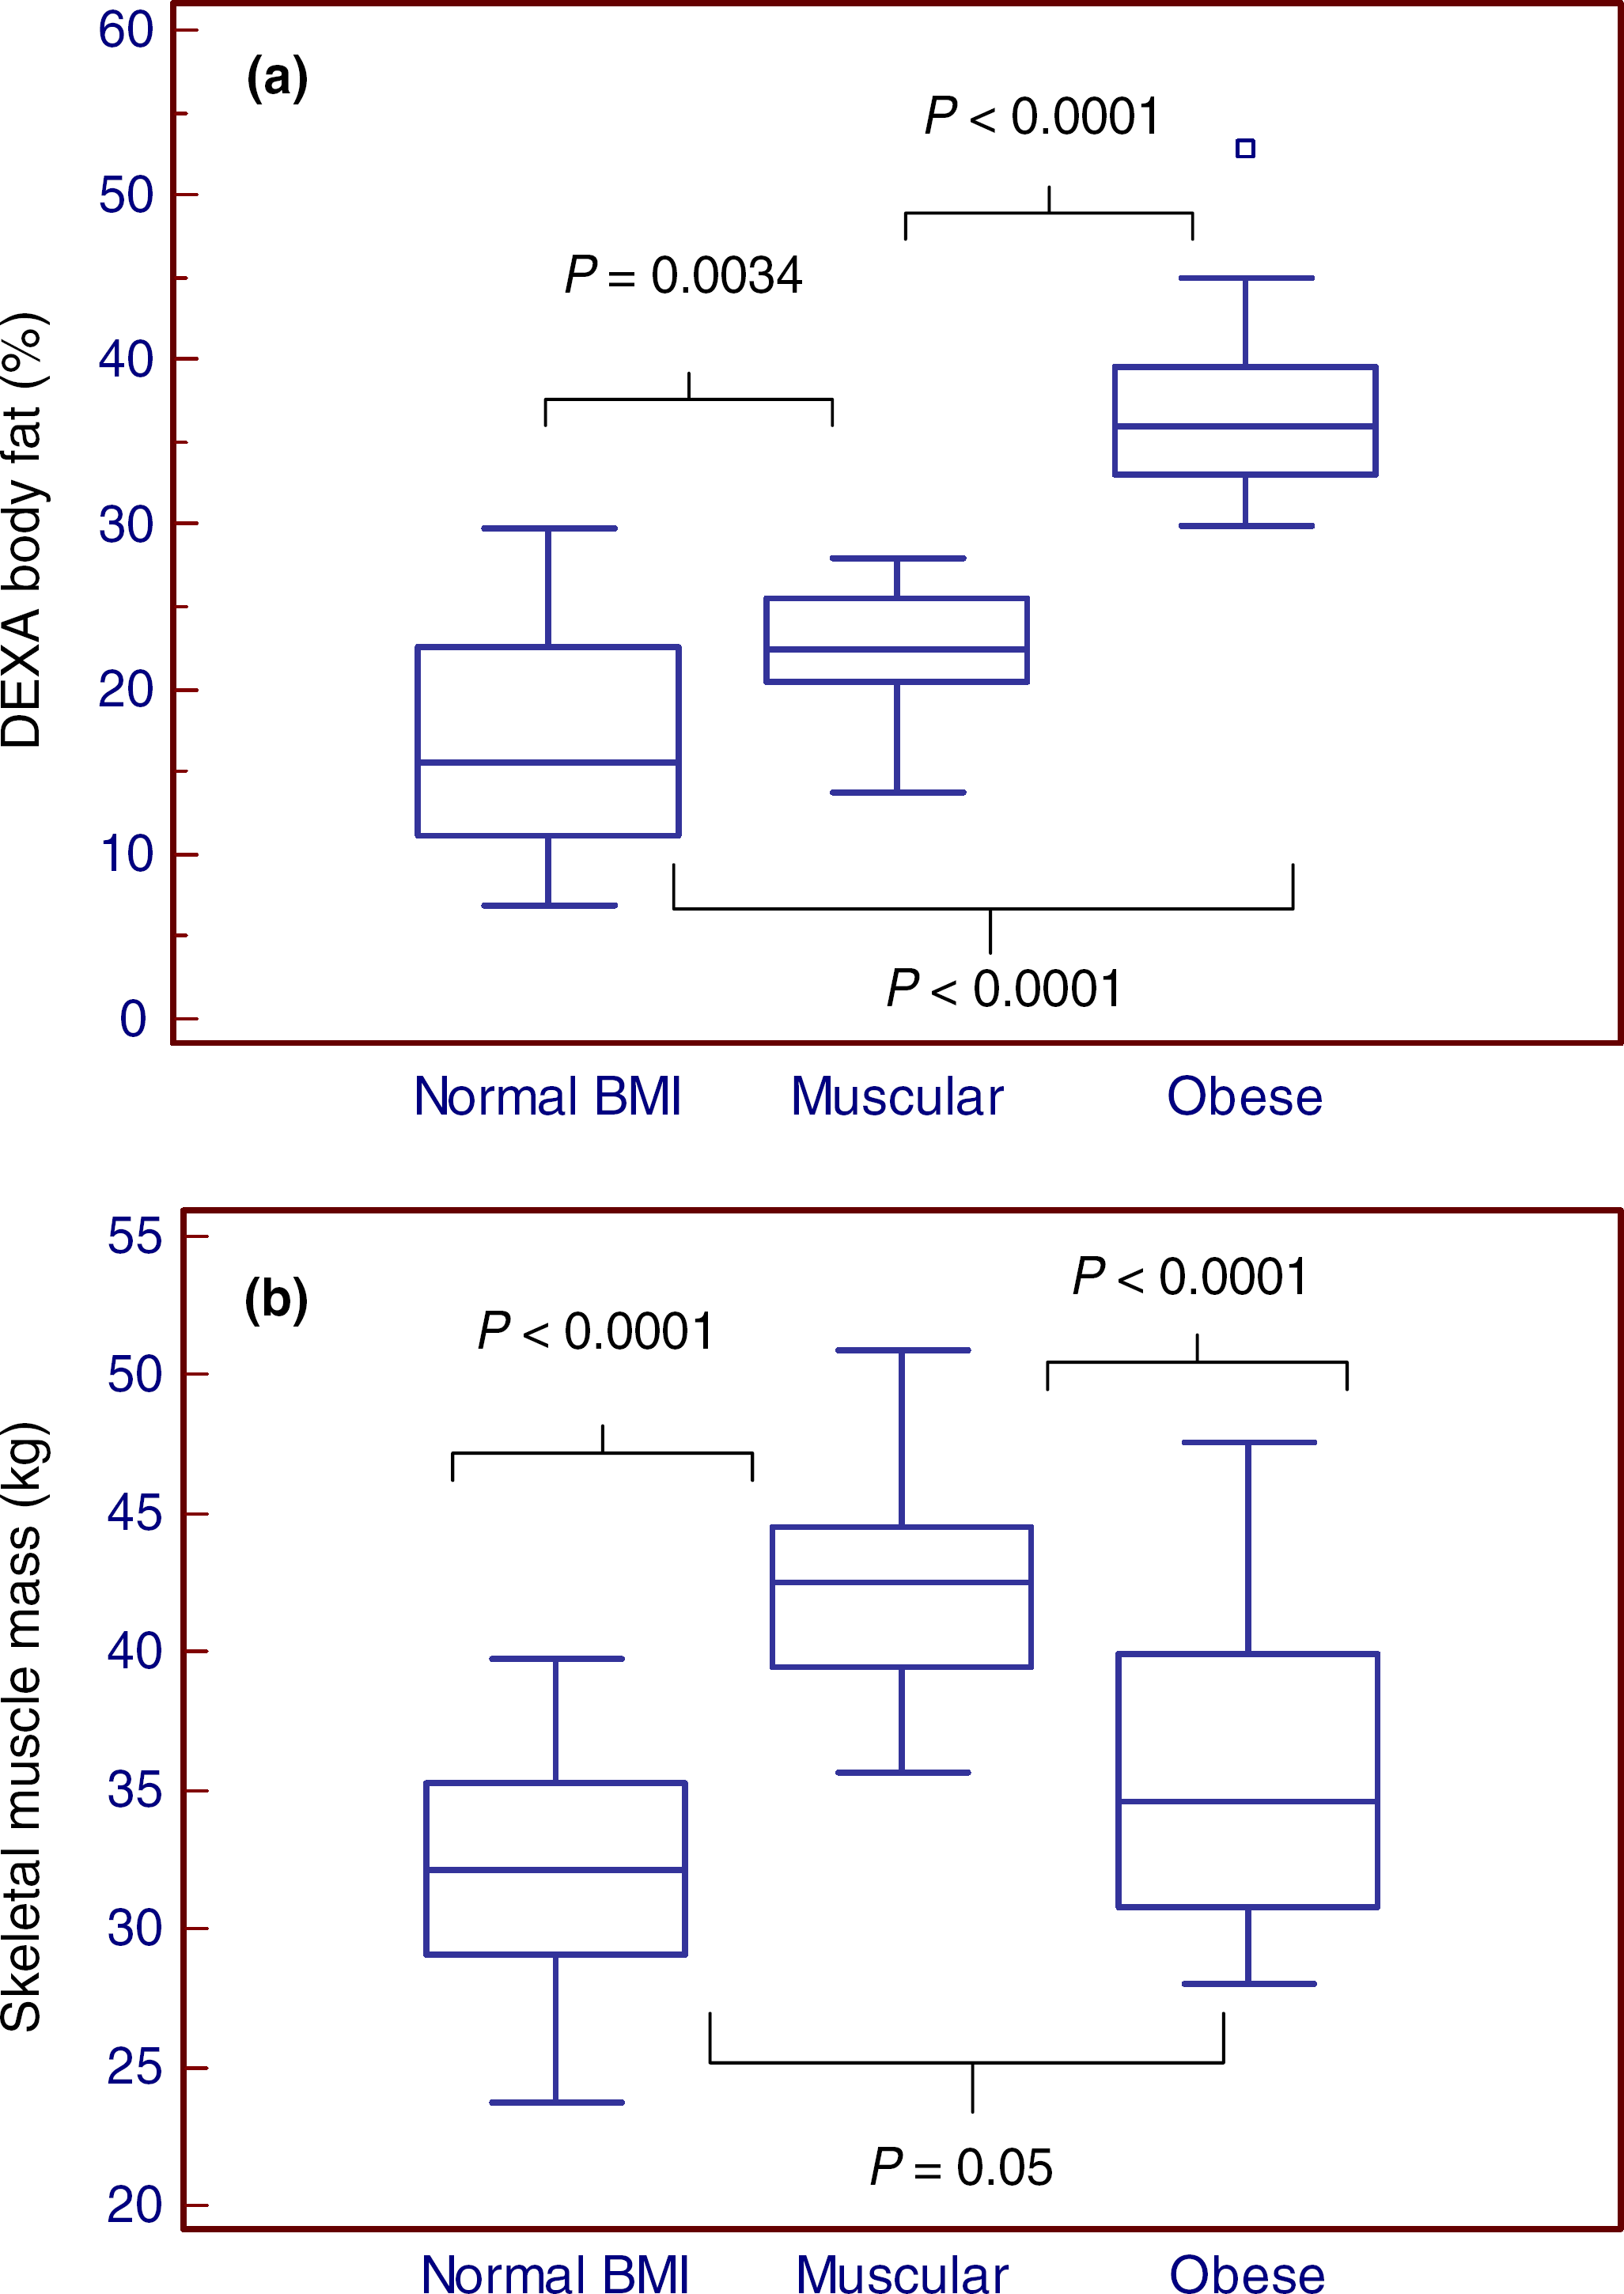
Cystatin C and creatinine values
Cystatin C results for the obese group were significantly higher than the normal BMI group and muscular group (P = 0.0002) (Figure 2a). However, there was no significant difference noted between the cystatin C values of the normal BMI group and the muscular group (P = 0.92). As expected, the muscular group had the highest creatinine concentrations than the other two groups (largest P value = 0.004) (Figure 2b).
(a) Cystatin C raw values for each participant against dual-energy X-ray absorptiometry (DEXA) body fat (%). (b) Plasma creatinine raw values for each participant against skeletal muscle mass (kg)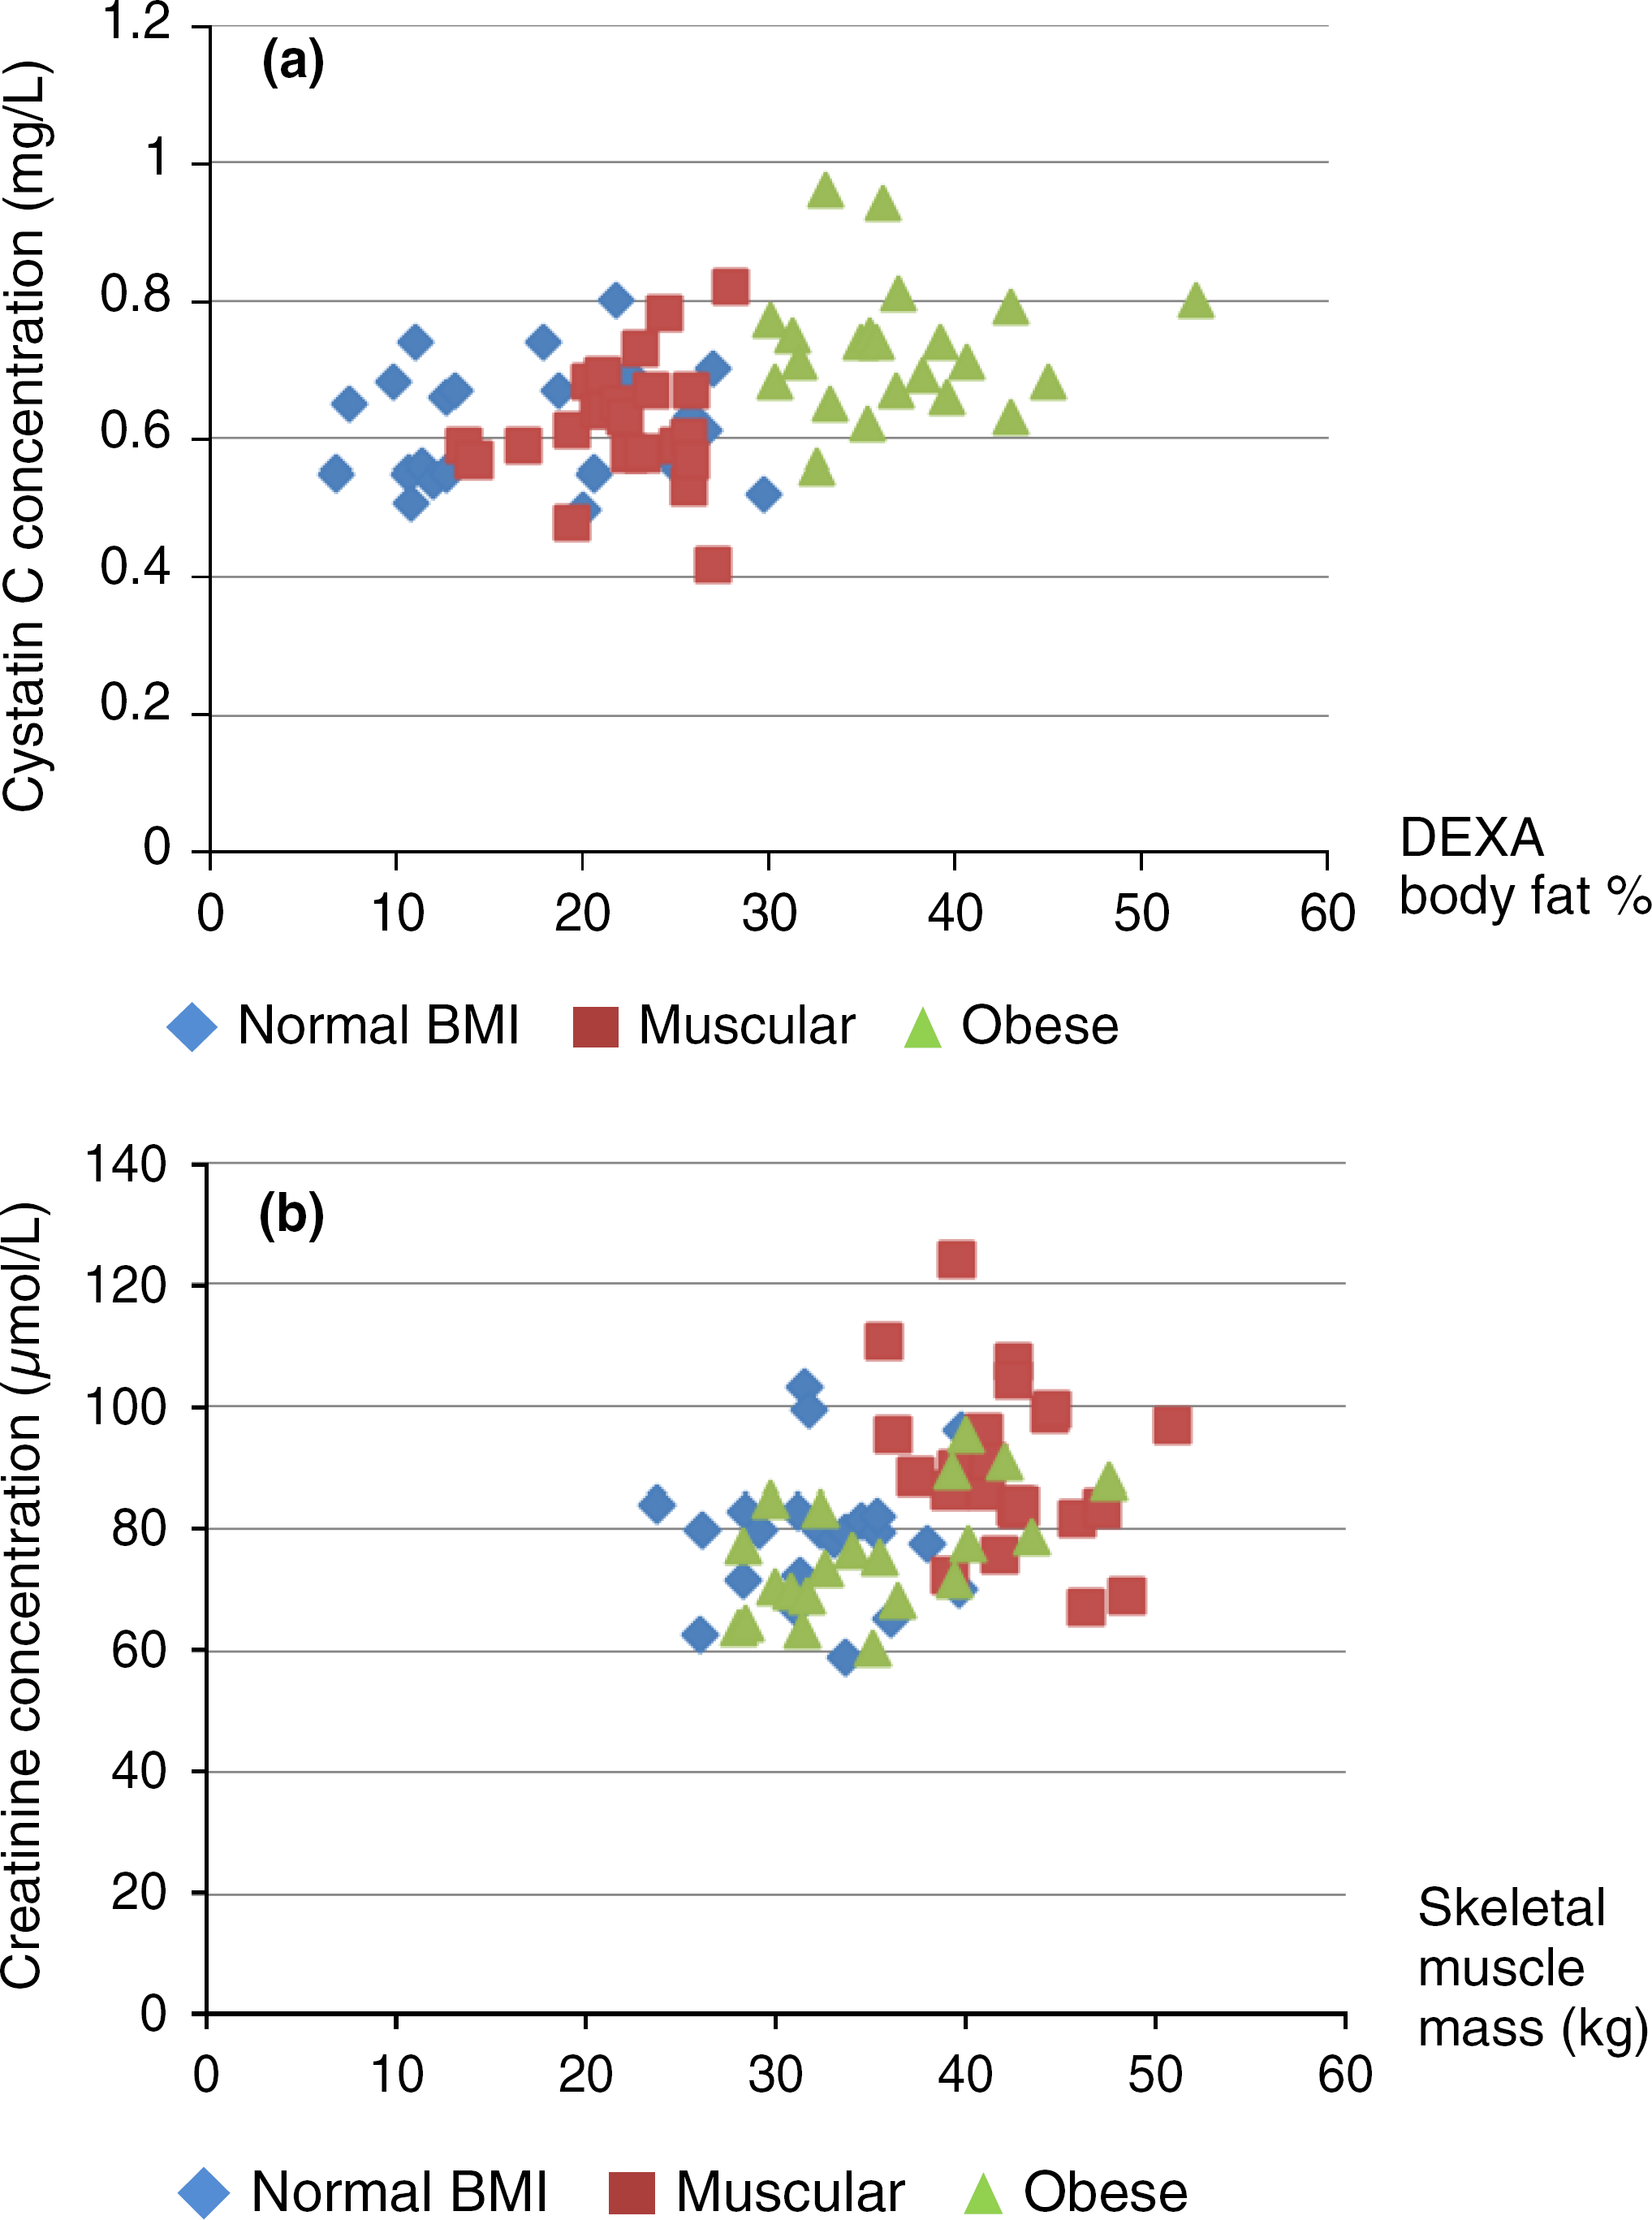
Measured GFR
The obese group and the normal BMI group had similar Tc-DTPA GFR results (P = 0.91), which were all within the expected ranges (Table 2). However, the muscular group had significantly higher GFR (P = 0.0007) compared with the other two groups.
High-sensitivity CRP and urine protein values
Some elevated high-sensitivity CRP (hs-CRP) values were noted (in one normal BMI and in one obese participant), possibly reflecting low-grade inflammation. After exclusion of subjects with hs-CRP concentrations > 10 mg/L, the obese group (n = 21) still had significantly higher hs-CRP results than the normal BMI and muscular groups (P = 0.03). None of the participants had overt proteinuria (urine protein/creatinine ratio ≥22.9 g/mol), confirming that none of the participants had kidney dysfunction (or GFR <60 mL/min/1.73 m2).
eGFR results
Cystatin C equations generally show a similar pattern for the three groups of participants (Figure 3 as an example) - with the normal BMI and muscular groups not statistically different from one another (smallest P value >0.35), but the obese group having lower eGFR values (largest P value <0.004), except for the Stevens 3 equation which was significantly higher in the normal BMI group (P = 0.009). Bias from measured Tc-DTPA GFR across the groups was not consistent (please see Supplementary Table 1 at http://acb.rsmjournals.com/lookup/suppl/ doi:10.1258/acb.2012.011241/-/DC1). When comparing the bias of the equations in each group, eGFR was significantly lower for the obese and muscular groups compared with the normal BMI group, as is evident by the lack of overlap in the 95% CI. In contrast, the obese and muscular groups are only different from each other with the Stevens 3 formula. Using cystatin C equations, none of the participants had eGFR <60 mL/min/1.73 m2.
Box and whisker diagram for the Le Bricon equation for the three groups of participants (mean and interquartile ranges). eGFR, estimated glomerular filtration rate; BMI, body mass index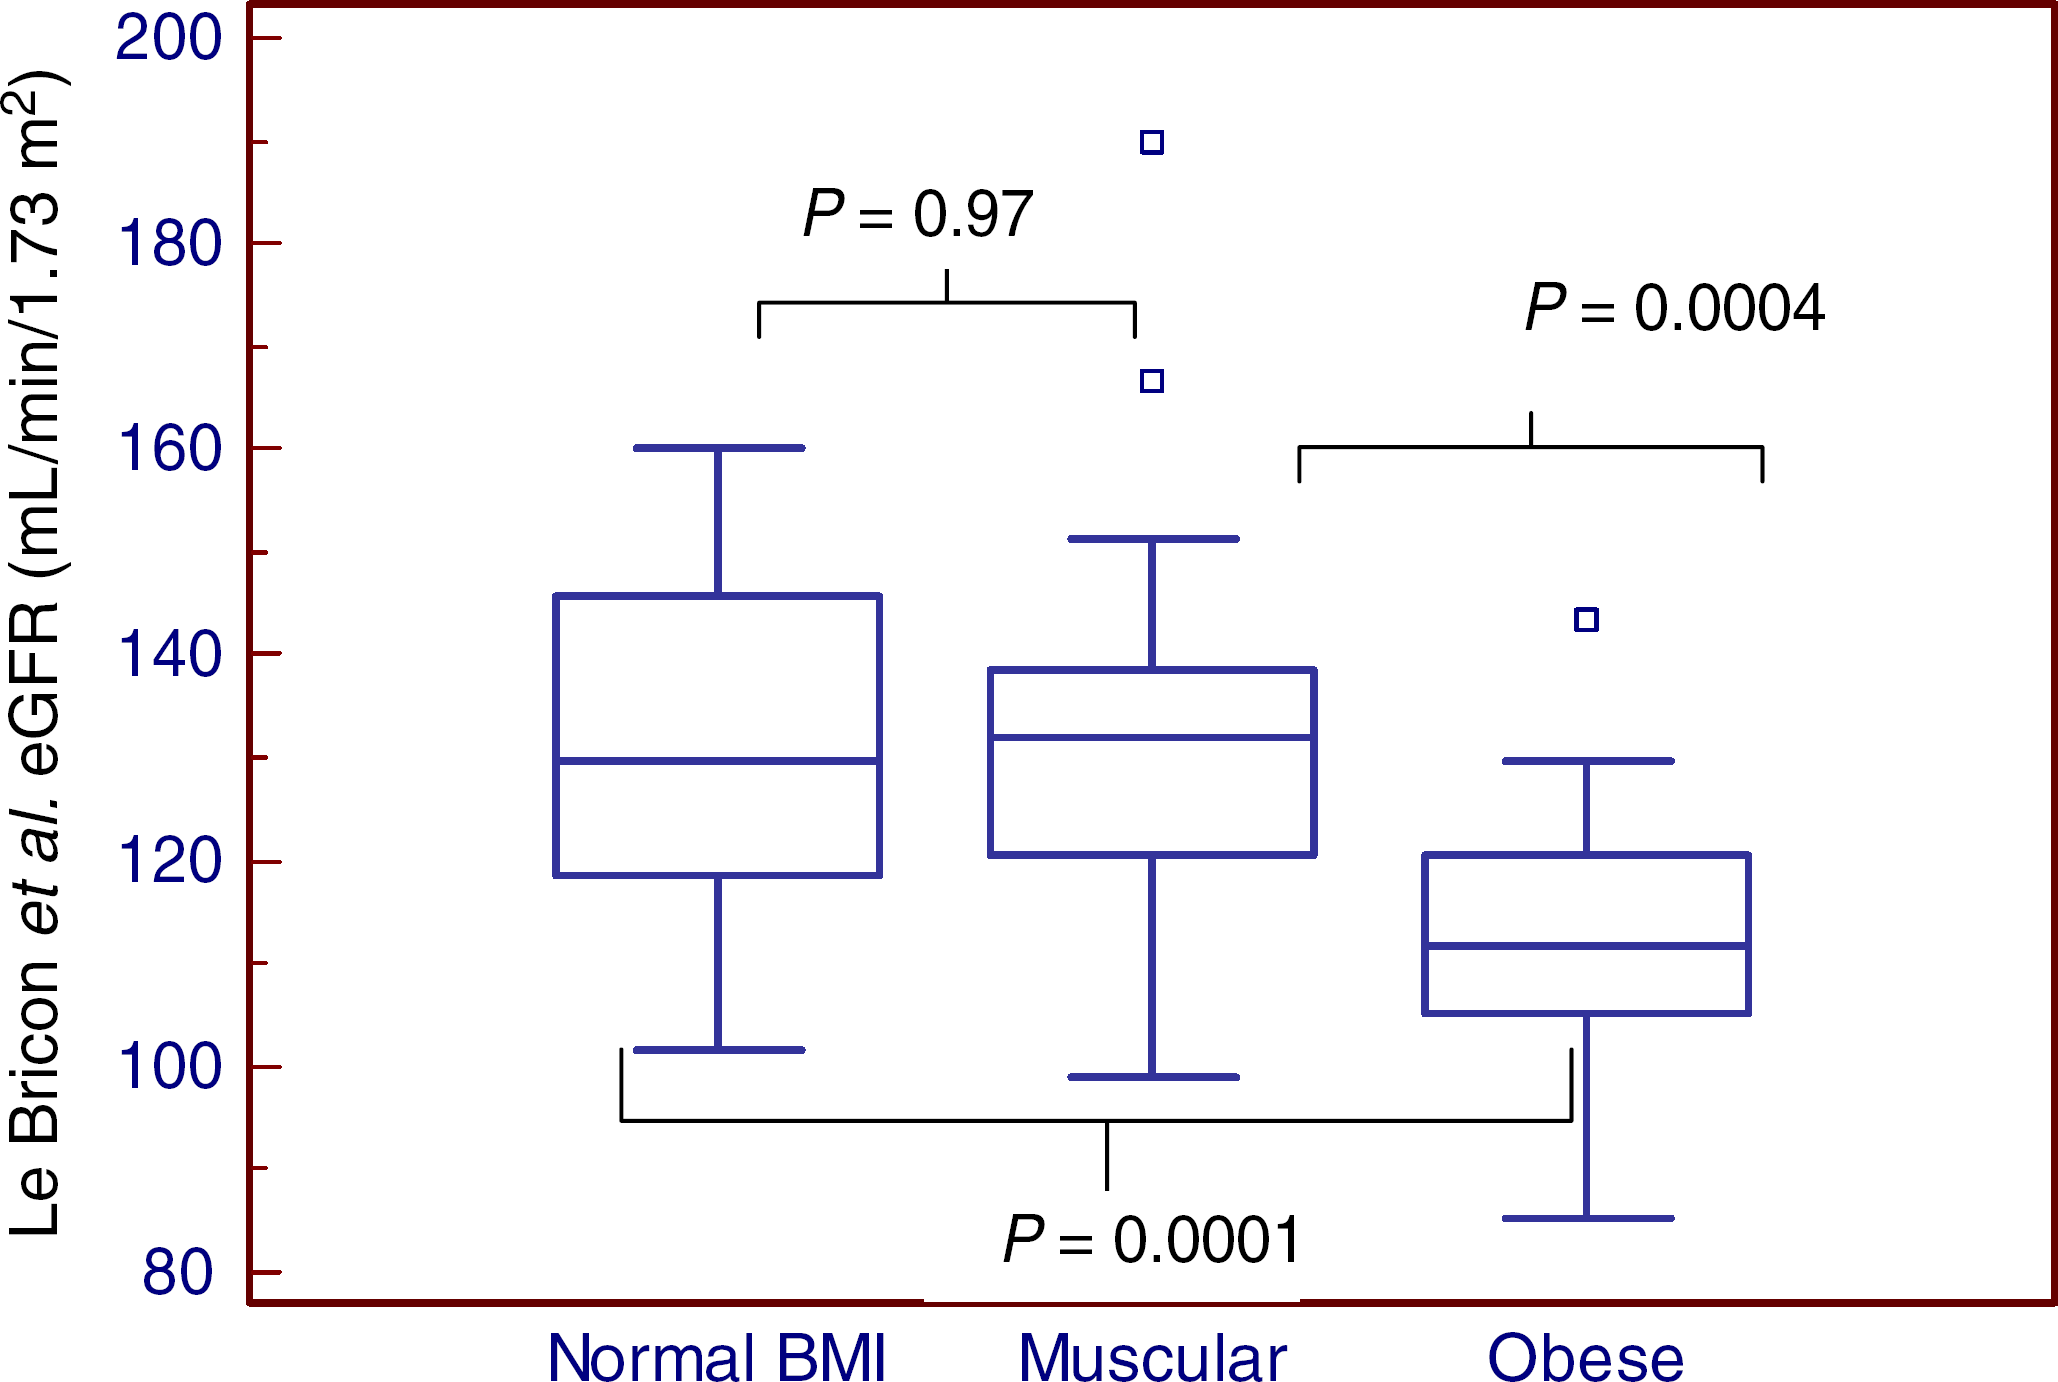
When comparing mean bias across all groups for the creatinine equations, the MDRD and CKD-EPI equations generally underestimated Tc-DTPA GFR, with the muscular group showing the largest underestimations (please see Supplementary Table 1). Using the MDRD equation, two muscular participants were classified as having eGFR ≤60 mL/min/1.73 m2, although Tc-DTPA GFR measured for both were normal. For the CKD-EPI equation, no subject had eGFR ≤60 mL/min/1.73 m2.
The performance of cystatin C and creatinine equations and the differences of proportions of results within 50%, 30% and 20% of GFR between the groups are listed in Supplementary Table 1. Generally, cystatin C equations such as Le Bricon et al., Hoek et al., MacIsaac et al., Rule 1 and 2 et al. and Stevens 1 and 3 et al., performed well within 30% of Tc-DTPA GFR and did not show differences between the groups. In contrast, significantly lower proportions of results within 30% of GFR were obtained for the muscular group for both the MDRD and CKD-EPI equations (P = 0.001).
Determinants of cystatin C, creatinine and GFR
On univariate analysis, body fat percentage (r = 0.45, P < 0.0001), hs-CRP concentrations after exclusion of concentrations >10 mg/L (r = 0.35, P = 0.004) and GFR (r
Variables included in the multiple regression analysis for cystatin C and creatinine were age (years), DEXA body fat (%), skeletal muscle mass (g), hs-CRP (mg/L), total dietary protein intake (g), total dietary fat intake (g) and categorical variables, smoking and dietary supplements. DEXA body fat % (P = 0.003) and Tc-DTPA GFR (P = 0.0001) were the only variables that independently affected cystatin C. Age (P = 0.03) and skeletal muscle mass (P = 0.0008) were significant determinants for creatinine in our study population. Variables affecting measured Tc-DTPA GFR itself were age (P = 0.02), skeletal muscle mass (P = 0.0002) and cystatin C (P = 0.0006), but not creatinine (P = 0.66).
Effect of varying body composition on cystatin C and creatinine
Differences between cystatin C-derived eGFR equations relative to Tc-DTPA GFR were compared with body fat percentages. None of the differences was observed to have any correlation with body fat percentage (smallest P value = 0.06, individual data not shown), suggesting that cystatin C eGFR underestimation or overestimation is not associated with the varying degree of obesity. However, if plotted against BMI, all cystatin eGFR bias was found to have a negative correlation with BMI (P = 0.0001, r = -0.50).
All creatinine eGFR equations were found to be highly affected by the amount of skeletal muscle mass (P < 0.0001, r = -0.60) (Figure 4 as an example). BMI was also found to negatively correlate with creatinine eGFR bias, although less strongly (P = 0.02, r = 0.30).
Differences between Modification of Diet in Renal Disease estimated glomerular filtration rate (MDRD eGFR) and Tc-diethylenetriamine pentaacetic acid (DTPA) GFR versus skeletal mass muscle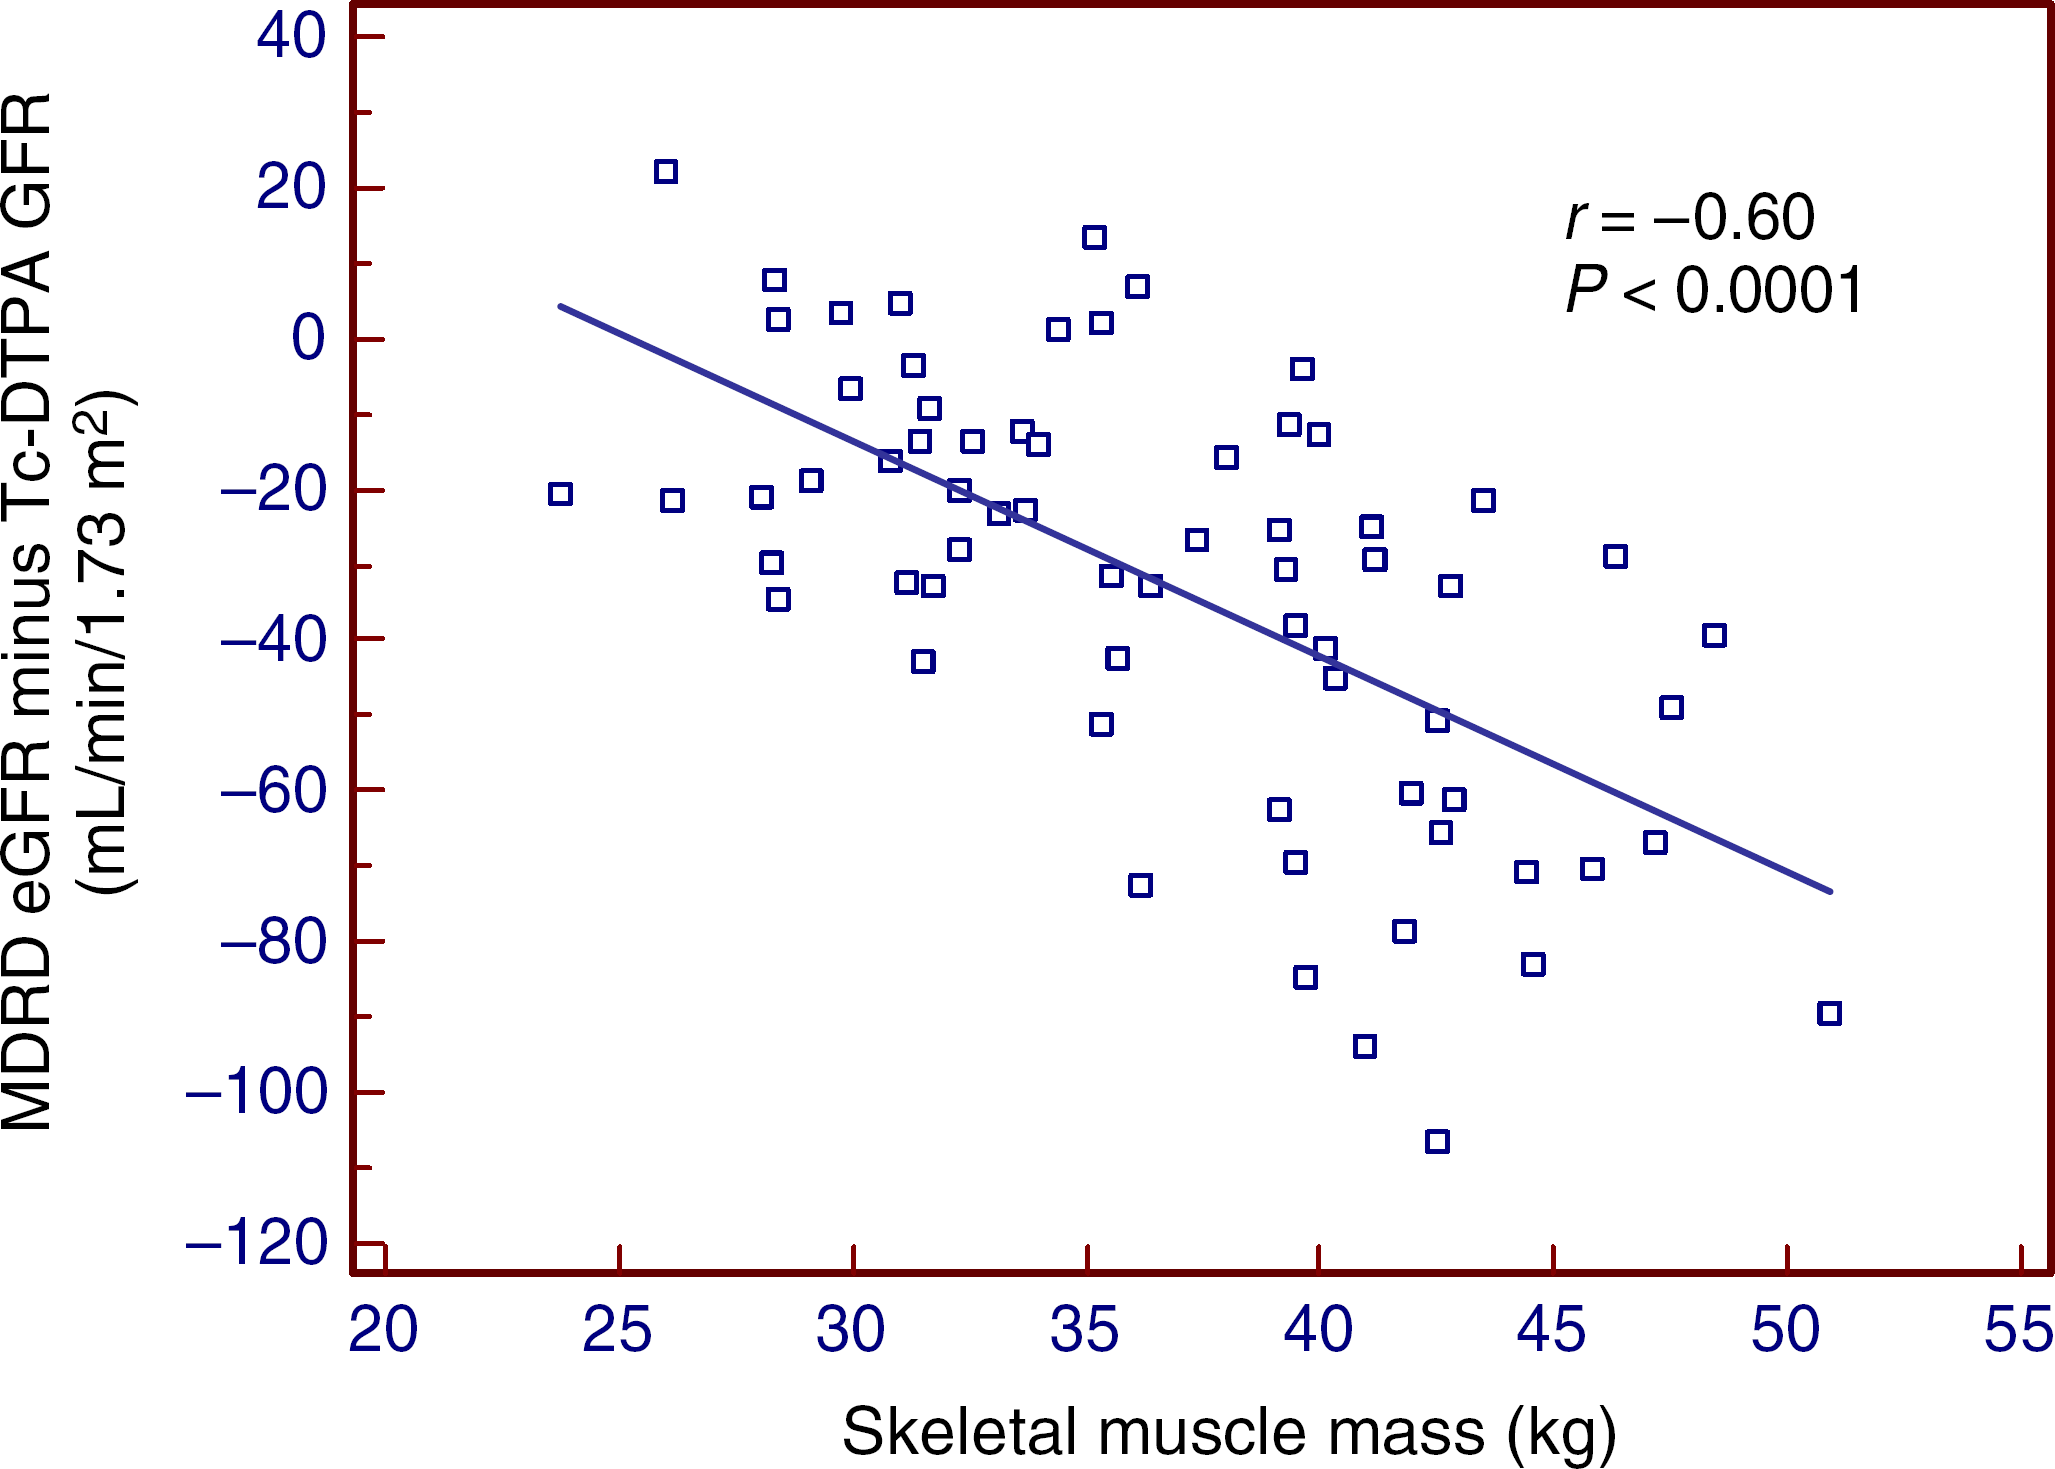
Discussion
Our study highlights the importance of recognizing the effect of body composition on the interpretation of renal function. The principal findings of our study show that plasma cystatin C was elevated in relation to fat mass, and that muscle mass and age are significant determinants of plasma creatinine.
Our study extends many studies which found a correlation between BMI and cystatin C.14–16 In particular, we used more detailed body composition analyses (BIA and DEXA), which were capable of differentiating lean versus fat mass in the same categorical BMI, confirming that higher cystatin C and creatinine concentrations were indeed directly related to differences in body composition, body fat and muscle mass, respectively. These observations were found to be independent of reduced GFR concentrations, measured by a gold-standard GFR method.
Although elevated cystatin C concentrations were found in our healthy obese population without any known kidney disorder (normal Tc-DTPA GFR ranges), the cystatin C concentrations were still within the reference interval. In other studies, elevated values have been shown to be predictive of future CVD events. 42 In our whole study population, cystatin C was associated with body fat percentage and also hs-CRP, suggesting a possible relationship with inflammatory cytokines. This relationship with hs-CRP, however, was only seen in univariate analysis and only body fat percentage and GFR were predictors of cystatin C in multiple regression analysis. A relationship between cystatin C eGFR values and obesity was not present in our study, although cystatin C eGFR bias was associated with BMI.
In this study, the effect of body composition and its contribution towards cystatin C and creatinine production may not be clearly represented by their plasma concentrations. For cystatin C, calculations of its removal (and hence its production), with the assumption that cystatin C is freely filtered and otherwise not metabolized, showed the muscular group to have the same cystatin C removal rate as those of the obese group (0.11 mg/min, P = 0.82). Given that plasma cystatin C concentrations in the muscular group were lower than the obese group (Table 2), the plasma concentrations may therefore be confounded by the higher clearance in muscular subjects due to renal hyperfiltration. We therefore also hypothesize that plasma creatinine concentrations would have been much higher than what was measured for our muscular participants. Renal function is consequently poorly represented by using plasma concentrations alone. Cystatin C eGFR equations were, however, still accurate in estimating GFR in both the obese and muscular group, where the highest proportions of results within 30% and 20% of Tc-DTPA GFR were obtained. Interestingly, in type 1 diabetic subjects, cystatin C concentrations were found to be lower in hyperfiltration, 42 in contrast to another study where cystatin C was accurate in estimating GFR longitudinally in subjects with hyperfiltration. 43 The utility of cystatin C in subjects with hyperfiltration requires further investigation.
The higher production of cystatin C in muscular men could be due to higher adiposity seen in these individuals or perhaps by other unknown factors. Although higher urine creatinine, possibly suggesting higher muscularity, has been found to correlate with higher cystatin C concentrations, 15 multiple regression in our study indicated that only body fat and GFR were significant predictors of cystatin C. In cellular studies, adipose tissue was among the tissues expressing the highest concentration of cystatin C mRNA. 44 Increased concentrations of plasma cystatin C in obesity may be due to a possible role in regulating cathepsins, which is implicated in atherosclerosis.45–47 A ‘preclinical kidney disease’ stage, defined as elevated cystatin C in the absence of stage 3-5 CKD, was associated with an increase risk of CKD progression and CVD morbidity and mortality. Similarly, elevated cystatin C defined as ≥1.09 mg/L (in NHANES III) was associated with metabolic abnormalities, without stage 3 or 4 CKD measured by creatinine-based eGFR. 48,49 Given that cystatin C concentrations were shown to outperform plasma creatinine in a cohort of elderly population with measured GFR concentrations, it is possible that cystatin C provides prognostic information beyond its role as just an index of kidney function. 1 It is therefore foreseeable that in our obese group, and possibly in our muscular group, cystatin C concentrations may continue to rise with time which can only be determined if our participants were followed longitudinally.
Current equations in clinical practice use demographics, such as age, gender and ethnicity to account for creatinine determinants, but this is inadequate to differentiate between fat and lean mass. It is not surprising that increased muscle mass results in a greater underestimation of creatinine-based eGFRs (approximately 40 mL/min/1.73 m2 underestimation with 40 kg of muscle mass using the MDRD equation), since these formulae do not correct for the increased creatinine production. Plasma creatinine itself was found to be highly affected by both muscle mass and dietary protein intake, as is shown in univariate analysis. Interestingly in multivariate analysis, only age, skeletal muscle mass and cystatin C were found to be dependent variables of measured GFR, suggesting the use of creatinine itself may not be appropriate in GFR estimation.
Rule et al. 50 reported that the use of age and/or sex variables in equations that estimate GFR distorted the likelihood of CKD. This exaggerated the risk of mortality and CVD, as equations that included gender inflated the likelihood of CKD in women, whereas the inclusion of age inflated the likelihood of CKD in the elderly. Similarly, Macdonald et al. 51 found that muscle mass explained more variance in GFR than demographic variables.
The Kidney Disease Outcomes Quality Initiative (KDOQI) states that an eGFR estimate within 30% of measured GFR is considered acceptable for clinical interpretation, identifying individuals with CKD as defined by GFR <60 mL/min/ 1.73 m2 for three months or more. If these guidelines were strictly followed, 26.1% of our muscular people would be correctly classified. Two muscular participants were misclassified as having MDRD eGFR <60 mL/min/1.73 m2. Improved classification is achieved using the CKD-EPI, although the majority of the muscular group will still be wrongly classified. Our study does not address those with very low muscle mass or body fat, such as those in the elderly population, which may be misclassified as having normal eGFR when renal function may actually be deteriorating.
We recognize several limitations in our study, including a small sample size without female participants, participants over the ages of 52 years, or participants with reduced GFR concentrations. Furthermore, the equations used in our study have been developed in populations that differ from our study population (Table 1). The validity of these equations used to calculate GFR in our study population may therefore not be strictly appropriate or representative. Nevertheless, this study has many strengths, including the use of gold-standard GFR measurements, detailed body composition analysis and the study design allowing potential confounding factors to be controlled for.
We therefore suggest future studies should be directed at a bigger study sample size. We strongly suggest prediction equations should include some index of body composition, ideally a measure of body composition to replace the use of demographic factors, as this may improve the estimation of GFR. Body composition analysers such as BIA could be practical in clinical settings. 52
In conclusion, our study has demonstrated a significant association between cystatin C concentrations and body fat, and creatinine and its derivative equations are affected strongly by muscle mass and age. The impact of body composition as a potential confounding variable in the interpretation of renal function should not be ignored. Cystatin C-derived equations were, however, still more accurate than creatinine-derived equations in estimating GFR in our study population.
DECLARATIONS
Footnotes
Acknowledgements:
We are extremely grateful to the New Zealand Kidney Foundation and Canterbury Medical Research Foundation for grant support. We are also grateful to Dr John Livesey and also Dr John Pearson for advice on statistical analysis. The staff of Primorus Clinical Trials, including Dr Alison Luckey and Jo Kepple, are also acknowledged for providing support and clinical infrastructure.
References
Supplementary Material
Please find the following supplemental material available below.
For Open Access articles published under a Creative Commons License, all supplemental material carries the same license as the article it is associated with.
For non-Open Access articles published, all supplemental material carries a non-exclusive license, and permission requests for re-use of supplemental material or any part of supplemental material shall be sent directly to the copyright owner as specified in the copyright notice associated with the article.