
Abstract
Background
The plasma renin activity (PRA) assay measures the ability of renin to generate angiotensin I (AngI) from angiotensinogen. It is used to monitor mineralocorticoid therapy and to screen hypertensive individuals for primary aldosteronism (PA).
Methods
Samples were incubated in the presence of protease inhibitors for 6.5 and 24 h. The reaction was stopped by the addition of 2% ammonium hydroxide. AngI was then quantified by liquid chromatography tandem mass spectrometry using online solid-phase extraction (XLC-MS/MS).
Results
This method requires a sample volume of 50 μL and has an inter-assay precision <14% across the working range. A 6.5-h incubation gave a lower limit of quantification (LLOQ) of 0.3 nmol/L/h and this can be reduced to 0.08 nmol/L/h using a 24-h incubation. Comparison to a radioimmunoassay revealed excellent correlation (r 2 = 0.98), but a 37% negative bias. We also found that renin is stable in whole blood for up to 24 h at room temperature. In contrast, storage at 4°C should be avoided as prorenin cryoactivation can affect the PRA result in some patient groups.
Conclusions
We have developed and fully validated a semi-automated XLC-MS/MS method for the measurement of PRA. In addition, a reference range specific to this assay has been defined. We have also demonstrated that renin is stable for up to 24 h at room temperature. This will enable this assay to be extended to samples taken in primary care, potentially increasing the number of hypertensive patients who can be screened for PA.
Introduction
Primary aldosteronism (PA) is a common cause of secondary hypertension. It is caused by inappropriate aldosterone production, usually as a result of either an aldosterone-producing adrenal adenoma or adrenal hyperplasia. 1 Typically, the excess aldosterone produces severe and drug-resistant hypertension. In some cases, hypokalaemia and/or a metabolic alkalosis may also occur. The prevalence of PA among the hypertensive population remains unclear, although a number of recent studies have reported PA in more than 10% of hypertensive patients, and in resistant hypertension (>140/90 mmHg despite treatment with three hypertensive agents), the prevalence may be as high as 17–23%. 2
The potentially high prevalence of PA combined with evidence that aldosterone may cause significant cardiovascular damage independently of its effects on blood pressure, 3 highlights the importance of correctly identifying cases of PA. The aldosterone to renin ratio (ARR) is currently recommended as a screening test for PA. 2 Traditionally, renin has been quantified by measuring the plasma renin activity (PRA). This is a two-step assay involving: (1) the generation of angiotensin I (AngI) during a plasma incubation step, and (2) quantification of the AngI produced. The PRA is then calculated as the amount of AngI produced in unit time. PRA is a well-established assay which has been in use for more than three decades and has two significant advantages. First, if endogenous substrate is used, renin activity correlates with the concentration of angiotensin II (AngII) in plasma. 4 Second, the sensitivity of the assay can be increased simply by extending the incubation time. More recently, the direct renin concentration (DRC) assay, which measures the total mass of renin present in plasma by immunoassay, has been developed. This is easier to perform than the PRA assay and thus better inter-laboratory precision is achieved. 5 However, it has been suggested that the commercial DRC kits may be insufficiently sensitive to measure the low concentrations of renin found in PA patients and, in support of this, no correlation was observed between DRC and PRA results for low plasma renin samples (<0.8 nmol/L/h). 6 Furthermore, a number of studies have demonstrated that using DRC may produce false-positive ARR results in women in the luteal phase of the menstrual cycle or in women taking combined oral contraceptives. 7,8 This is likely to result from the increase in angiotensinogen concentration which occurs in response to oestrogens. This will cause an increase in renin activity and AngII production and a subsequent decrease in renin release. 9
Until recently, all established PRA assays have used a competitive radioimmunoassay (RIA) to measure the amount of AngI generated during the incubation step. RIAs are manual, time-consuming and have a limited dynamic range. In addition, non-specific binding may occur between the AngI antibody and other related peptides, potentially overestimating the PRA result. Consequently, more recently developed PRA assays have used high-performance liquid chromatography (HPLC) and mass spectrometry methods for the quantification of AngI. 10,11 The use of liquid chromatography coupled to mass spectrometry (LC-MS/MS) is becoming increasingly common in routine clinical laboratories and there is growing interest in the use of LC-MS/MS techniques for the quantification of peptides such as the angiotensins.
LC-MS/MS analysis of analytes in complex biological matrices often requires some degree of sample extraction prior to injection onto the LC column. Extraction methods used routinely include protein precipitation, liquid–liquid extraction and solid-phase extraction (SPE). SPE is often performed offline using fairly manual techniques. However, instruments are now available which combine both SPE and LC coupled to MS/MS (known as XLC-MS/MS). These instruments automate the SPE step and can produce faster and more precise assays. Samples are analysed immediately after extraction and therefore there is no variation in wait times between sample preparation and analysis. Other advantages include reduced sample handling, reduced staff time, reduced consumable requirements (no need for tubes to collect the eluate in) and faster method development.
In this report, we describe the development and validation of a semi-automated XLC-MS/MS method for the measurement of PRA. In addition, the stability of renin at room temperature and the extent to which cryoactivation of prorenin occurs during 4°C storage were also assessed.
Materials and methods
Materials
AngI was purchased from the National Institute for Biological Standards and Control (NIBSC; Hertfordshire, UK). The internal standard 13C15N-AngI was purchased from Cambridge Biosciences (Cambridge, UK). All stock solutions were prepared in methanol. Lyphochek hypertension markers were purchased from Bio-Rad (Hertfordshire, UK). All other reagents were from Sigma-Aldrich (Poole, UK).
AngI generation buffer
A 0.5 mol/L acetate buffer at pH 5.5 was prepared by adding 4.58 mL glacial acetic acid and 54.4 g sodium acetate trihydrate to 1 L of water. This buffer was then supplemented with neomycin and ethylenediaminetetraacetic acid (EDTA) to produce a working AngI generation buffer. On the day of analysis, an aliquot of the working AngI generation buffer was treated with phenylmethylsulphonylfluoride (PMSF) and soybean trypsin inhibitor (SBTI) and then immediately mixed with plasma samples in a 1:1 ratio. Final inhibitor concentrations were 100 mg/L neomycin, 8.9 mmol/L EDTA, 2 mmol/L PMSF and 50 μg/L SBTI. The pH of the buffer was set to 5.5 as maximum renin activity has been demonstrated between pH 5.5 and 6.0. 12 In addition, the serine protease inhibitor PMSF is considerably more stable at this pH than at the more physiological pH of 7.5. 13 EDTA was included as it is a metalloprotease inhibitor and will inhibit angiotensin-converting enzyme (ACE), thus preventing conversion of AngI to AngII. PMSF and SBTI were included to inhibit AngI degradation by serine proteases. Neomycin was used to prevent bacterial growth during longer incubations. The combination and concentration of inhibitors described above were determined experimentally to ensure optimal AngI stability throughout the incubation period (data not shown).
Calibrators and controls
AngI calibrators and quality controls (QCs) were prepared in fresh frozen plasma that contained undetectable levels of AngI, but did contain enzymes which rapidly metabolized AngI. To ensure the stability of AngI, the plasma was pretreated in a 1:1:1 ratio with AngI generation buffer and 2% ammonium hydroxide. Final calibrator concentrations were 2.4, 4.8, 9.7, 19.3, 38.6, 77.2, 154.3 and 308.6 nmol/L. Final QC concentrations were 3.9, 38.6 and 154.3 nmol/L. For renin QC material, we used commercial Lyphochek hypertension markers (three plasma renin activities). In addition, a low-activity QC sample was prepared from a patient sample which had renin activity of 0.2 nmol/L/h.
Sample preparation and AngI generation
Whole blood was centrifuged at 1400 ×
Blank subtraction
Experiments to assess the effects of blank subtraction required the preparation of a third plate.
This also contained QC/sample and AngI generation buffer, but no 37°C incubation was performed before the addition of the 2% ammonium hydroxide.
The following equation was used to calculate blank subtraction modified PRA:
Online SPE-LC
The plates were transferred to a Symbiosis™ Pharma HPLC-online SPE system (Spark Holland, Emmen, Netherlands). A Prospekt™-2 mixed anion-exchange extraction cartridge (10 mm × 1 mm) (Oasis® MAX; Waters, Manchester, UK) was preconditioned with 4 mL 2% formic acid in 60% methanol followed by 2 mL methanol, equilibrated with 1 mL 1% ammonium hydroxide and then loaded with 50 µL sample using 1 mL water. Unbound contaminants were then removed by washing the cartridge with 2 mL of 1% ammonium hydroxide in 35% methanol followed by 2 mL water. AngI was then eluted from the cartridge under the initial chromatographic conditions for four minutes before the cartridge was taken offline. Chromatography was performed by injection of the cartridge eluate into a Gemini C18 security guard column (Phenomenex, Macclesfield, UK) attached to an Xbridge™ C18 3.5 μm column (Waters) which was maintained at 60°C. Mobile phase A contained 0.2% formic acid in deionized water and mobile phase B contained 0.2% formic acid in 95% methanol. Initial conditions were 90:10 (v/v) A:B. AngI was eluted from the column using a gradient of 10–100% mobile phase B over two minutes, followed by 100% mobile phase B held for one minute. The column was then re-equilibrated back to initial conditions and held for one minute prior to the next sample injection. The flow rate was maintained at 0.5 mL/min and the total run time was 5.5 min. The Symbiosis™ has two cartridge clamps and can begin preconditioning a second cartridge while the first cartridge is eluting. This allows the SPE steps for a second sample to be performed while the first sample is being chromatographed. Consequently, for the second and for all subsequent samples, no additional time is required for the SPE part of the analysis.
Tandem mass spectrometry
The column eluate was injected into a Xevo™ TQ tandem mass spectrometer (Waters) maintained in electrospray positive ionization mode, with a source temperature of 150°C and using nitrogen as a desolvation gas (flow of 700 L/h, temperature of 400°C). The capillary voltage was maintained at 0.7 kV. The most abundant transitions identified for AngI and 13C15N-AngI were m/z 649.2 > 784.5 and m/z 652.7 > 791.5, respectively. The cone voltage and collision energies were 40 V and 26 eV for AngI and 38 V and 30 eV for 13C15N-AngI. System control and data acquisition were performed with MassLynx v4.1 software. Sample analysis was performed in MRM mode, with a dwell time of 0.3 s.
Cartridge breakthrough
Cartridge breakthrough occurs when a fraction of the analyte is not captured by the SPE cartridge during the sample extraction step and/or is lost from the cartridge during the wash steps. This loss of analyte will reduce the sensitivity of the assay and therefore cartridge breakthrough must be minimized. In this study, the Symbiosis™ Advanced Method Development (AMD) program was used to measure cartridge breakthrough. Briefly, two cartridges were placed in line and a sample and subsequent washes were applied to the first cartridge. Any analyte lost from the first cartridge (breakthrough analyte) was then captured on the second cartridge. Each cartridge was then eluted sequentially and the amount of analyte eluted was quantified by LC-MS/MS. Cartridge breakthrough (%) was calculated as the quantity of breakthrough analyte (eluted from cartridge 2) divided by the quantity of total analyte (eluted from both cartridges). This method was used to assess the effects of sample matrix and injection number on the cartridge breakthrough of both AngI and the internal standard.
Ion suppression
Ion suppression/enhancement was assessed using a postcolumn infusion of 0.5 mg/L 13C15N-AngI at a constant flow rate of 10 μL/min. Ten potassium EDTA plasma samples were extracted and chromatographed by XLC and the column eluate was allowed to mix with the infusion of 13C15N-AngI before entering the mass spectrometer. Ion suppression or enhancement was monitored by a reduction or increase of the 13C15N-AngI response at the normal retention time of AngI.
Linearity
Linearity of the method was evaluated by analysing AngI calibrators up to a concentration of 308.6 nmol/L. Calibration curves were produced by TargetLynx™ software, which plotted standard concentration values against the corresponding calculated XLC-MS/MS response (AngI peak area/13C15N-AngI peak area). Standards were considered to be linear if the weighted (1/x) linear regression analysis produced an r 2 value of >0.9900.
Lower limit of quantification
To determine the lower limit of quantification (LLOQ) for the quantification of AngI, fresh frozen plasma was pretreated with AngI generation buffer and 2% ammonium hydroxide and AngI was spiked in to give final concentrations of 1.0 and 1.9 nmol/L. These samples were then analysed 12 times within the same analytical run. The LLOQ was defined as where the analyte response is at least five times that of a sample blank with a discrete, identifiable peak, and both precision and deviation from the target value less than 20%. 14 The sensitivity of the assay was shown to decrease for each subsequent use of a single cartridge as a result of increasing cartridge breakthrough. Consequently, the LLOQ was determined separately for one, two, three, four and five uses of the Oasis® MAX cartridges.
Recovery
Four potassium EDTA plasma samples were spiked with AngI, producing samples with final concentrations of 3.1, 15.4, 77.2 and 154.3 nmol/L. Recovery was calculated from measured compared with expected concentrations.
Imprecision
To determine the intra-assay precision for the XLC-MS/MS measurement of AngI, the three AngI QCs were analysed 12 times within one batch. To determine the intra- and inter-assay precision for the complete PRA assay, the Lyphochek hypertension markers and low-activity QC sample were analysed 12 times within one batch and 10 times in different batches, respectively. The lyphochek markers were analysed after 6.5-h incubations and the low-activity QC was analysed after 24-h incubations. Precision was deemed acceptable if the coefficient of variation (CV) of the results was less than 15%. 14
Method comparison
Ninety-five lithium heparin plasma samples with requests for PRA were divided into two aliquots upon arrival at the laboratory. For each sample, one aliquot was analysed by RIA 15 (SAS Steroid Centre, Leeds General Infirmary, Leeds, UK) and the other aliquot was anonymized and then analysed by XLC-MS/MS. Statistical analysis was performed using Analyse-it software, version 2.22 (Analyse-it Software Ltd, Leeds, UK).
Reference range determination
PRA was measured in samples obtained from 100 healthy normotensive (blood pressure <140/90 mmHg) individuals (50 men and 50 women) who were not using anti-hypertensives, oral contraceptives, sex hormone-replacement therapy, non-steroidal inflammatory drugs or glycyrrhizin-containing products. 16 These individuals had blood samples collected before and after salt loading. For reference range determination, the presalt loading samples were analysed.
Room temperature stability
There is significant confusion in the literature regarding the stability of renin in whole blood. Some studies have concluded that samples can be stored on the bench for up to 24 h, 17 whereas others report a significant loss of renin activity after storage at room temperature. 18,19 To investigate this, blood samples were taken from seven volunteers into potassium EDTA and lithium heparin tubes and stored for 24 h at room temperature. Aliquots were removed from each tube at the following time points: 0 (baseline), 1, 2, 4, 7, 8 and 24 h. Each aliquot was immediately centrifuged and the plasma removed and stored at −30°C. All samples were then thawed, thoroughly vortex-mixed and analysed in the same analytical run. For each sample, a CV was calculated for all results obtained across the 24-h time period.
Cryoactivation
Plasma samples will contain both active renin and potentially large quantities of prorenin. Since the clinical usefulness of prorenin is unknown, it is important that any in vitro activation of prorenin is limited, thus ensuring that only active renin is assayed. Exposing samples to cryoactivating temperatures (0–5°C) can potentially activate prorenin and many studies have examined the extent to which this can occur. However, as yet, no consensus has been reached, with some reports describing a significant increase in activity after just a short incubation at 4°C, 17 whereas others find little effect of cold storage on renin activity. 18,20 To assess this, plasma was removed from 21 anonymized potassium EDTA samples and stored at 4°C. After 0, 6 and 24 h, an aliquot was removed and frozen at −30°C. All samples were then thawed, thoroughly vortex-mixed and analysed in the same analytical run. Six of the samples used were from the antenatal clinic as it is known that prorenin concentrations are markedly increased during pregnancy. 21 All samples used in this study were anonymized according to local ethical guidelines. For each sample, the percentage difference between the 0- and 6-h time points and between the 0- and 24-h time points were calculated.
Results
SPE and liquid chromatography
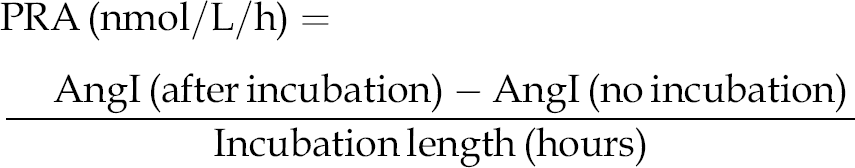
Clean discrete peaks with a retention time of 3.09 min were obtained for both AngI and 13C15N-AngI (Figure 1) and minimal ion suppression was detected at this time. For the SPE step, maximum sensitivity was achieved using mixed-mode anion exchange (MAX) extraction cartridges. These cartridges use both reverse phase interactions and a strong anion exchanger to separate AngI from other matrix components, providing much greater selectivity than the C18 and HLB cartridges used in other LC-MS/MS-based PRA methods.
10,11
To ensure that AngI remains negatively charged and is retained by the anion exchanger, a solvent with a pH greater than 7 must be used to wash the cartridges. This would be incompatible with the positive ion mode used in the mass spectrometer in this assay. However, the Symbiosis™ Pharma-HPLC system contains a high-pressure dispenser mix module, which provides great flexibility in solvent choice and mixing and enables the MAX cartridges to be washed online with a buffer containing 1% ammonium hydroxide, but then eluted with a buffer containing 0.2% formic acid. The high pH wash buffer is removed to waste and is therefore never in contact with the ionization source within the mass spectrometer.
Typical chromatogram of an extracted plasma sample. Chromatograms showing the ion detection response for each transition. (a) AngI m/z 649.2 > 784.5. (b) 13C15N-AngI m/z 652.7 > 791.5. AngI, angiotensin I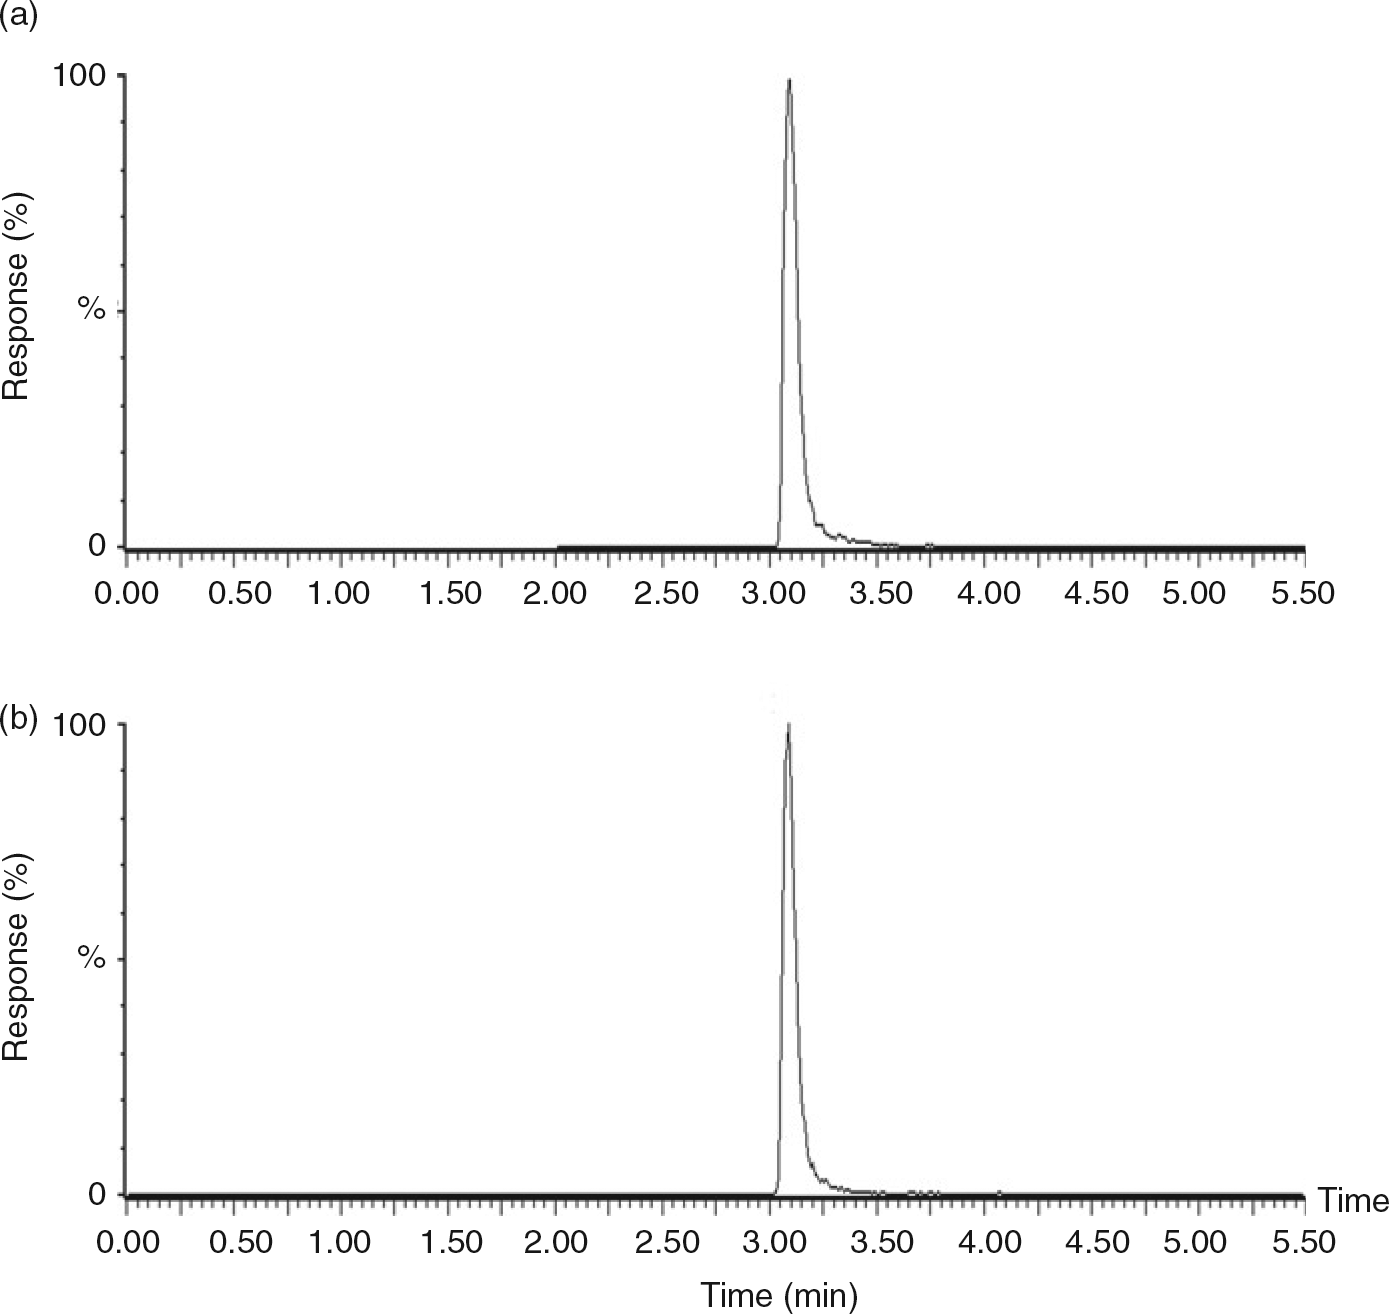
Cartridge breakthrough
After initial optimization of the SPE method, cartridge breakthrough was assessed. Using plasma as a sample matrix, more than 10% breakthrough for both AngI and 13C15N-AngI was consistently observed when a cartridge was used for the first time. This increased to 25–30% breakthrough when a cartridge had been used more than five times. This will reduce the sensitivity of the assay and consequently cartridge use was limited to a maximum of five injections. In further studies, we observed similar levels of breakthrough for both potassium EDTA and fresh frozen plasma, but significantly less breakthrough when 0.1% bovine serum albumin (BSA)/phosphate-buffered saline (PBS) was used as the sample matrix. Although matrix differences can be controlled for by use of an internal standard, there will still be significant differences in the ion counts produced by plasma-based and BSA/PBS-based samples. As a result, calibrators and samples used to determine the LLOQ were prepared in fresh frozen plasma to ensure that the LLOQ results were relevant to the sample type.
AngI stability
AngI is known to have a very short half-life in plasma as it is either rapidly converted to AngII by ACE, or it is quickly degraded by angiotensinases. To ensure stability of both the AngI calibrators and the AngI generated during the incubation step, we carefully optimized the combination and concentrations of the inhibitors used. We found that the concentration of the serine protease inhibitor PMSF was particularly important, as an increase in PMSF from 1 to 2 mmol/L increased plasma AngI recovery from 82 to 94% (after a 24-h incubation at room temperature). At higher concentrations, PMSF was found to be insoluble in the aqueous acetate buffer and therefore concentrations above 2 mmol/L could not be tested.
Validation of AngI quantification
Initially, the XLC-MS/MS method for AngI quantification was validated according to US FDA guidelines for industry. 14 The assay was shown to be linear to a concentration of 308.6 nmol/L (r 2 = 0.9997). The LLOQ was 1.9 nmol/L and this was valid for up to five uses of the MAX cartridges. The mean recoveries from four samples were 106, 97, 87 and 91% when 3.1, 15.4, 77.2 and 154.3 nmol/L AngI were spiked into potassium EDTA plasma. The intra-assay precision was shown to be 7.0, 4.0 and 1.6% at AngI concentrations of 3.9, 38.7 and 154.3 nmol/L, with a mean negative bias of 8.6% from theoretical levels.
AngI generation
Samples will already contain variable amounts of AngI before the incubation step. If this preincubation AngI (the blank) amounts to a significant fraction of the total AngI measured after incubation, then renin activity will be over-estimated. To avoid this, many assays subtract the blank from the total AngI. However, this approach has been criticized as AngI concentrations in the blank are often low and difficult to quantify. Instead, longer incubation times can be used to ensure that the blank AngI is only a small fraction of the total AngI and will therefore have little effect on the calculated renin activity (demonstrated in Figure 2a using the top-level Bio-Rad hypertension marker).
22
In this study, we found that the majority of patient samples had blank AngI concentrations below the LLOQ. A few high renin activity patient samples did have measurable AngI concentrations in the blank and these were used to evaluate the effect of incubation time and blank subtraction on the final renin activity result. Similar to results obtained using the Bio-Rad hypertension marker, we found that if a 6.5-h incubation was used, then only a modest difference (mean = 7.6%) was observed between the results obtained with and without blank subtraction for the patient samples. Consequently, we decided not to perform blank subtraction and instead to use a 6.5-h incubation for all samples. This incubation time fitted well into a working day and, in addition, we found that AngI production remained linear for relatively high-activity samples (at least 7.3 nmol/L/h) over this time period. Based on the LLOQ of 1.9 nmol/L, this gave a reporting limit of 0.3 nmol/L/h. However, analysis of 95 samples in the method comparison study revealed that 33 (35%) had renin activities below 0.3 nmol/L/h. Consequently, a 24-h incubation was then performed for low-activity samples. This reduced the reporting limit to 0.08 nmol/L/h, allowing a result to be reported for 93% of the method comparison samples. However, it is important to note that long incubations can potentially underestimate renin activity due to substrate exhaustion. To investigate this, we analysed 208 samples with renin activities ranging from 0 to 63.3 nmol/L/h. All samples were incubated for 6.5 and 24 h and PRA was calculated for each incubation time (Figure 2b). For low-activity samples (≤0.8 nmol/L/h), we found excellent agreement between the two incubation times (r
2 = 0.83, n = 116) and very little bias (PRA [24 h] = 0.91 × PRA [6.5 h] + 0.0015; Figure 2b(i)). However for higher-activity samples (>0.8 nmol/L/h), there remained excellent correlation (r
2 = 0.92, n = 92), but a significant proportional negative bias was observed (PRA [24 h] = 0.73 × PRA [6.5 h] + 0.04; Figure 2b(ii)).
Effect of incubation time and blank subtraction on PRA. (a) AngI concentrations were determined by XLC-MS/MS for the top activity Bio-Rad lyphochek hypertension marker after no incubation or at multiple time points during a 7.5-h incubation. PRA was then calculated with or without blank subtraction. (b) Two hundred and eight potassium EDTA samples were analysed for PRA using 6.5- and 24-h incubations. (i) Bland–Altman analysis for samples with PRA ≤ 0.8 nmol/L/h (n = 116). (ii) Bland–Altman analysis for samples with PRA >0.8 nmol/L/h (n = 92). Solid lines represent the mean negative bias. Dotted lines represent 95% limits of agreement. PRA, plasma renin activity; AngI, angiotensin I; EDTA, ethylenediaminetetraacetic acid; XLC-MS/MS, liquid chromatography tandem mass spectrometry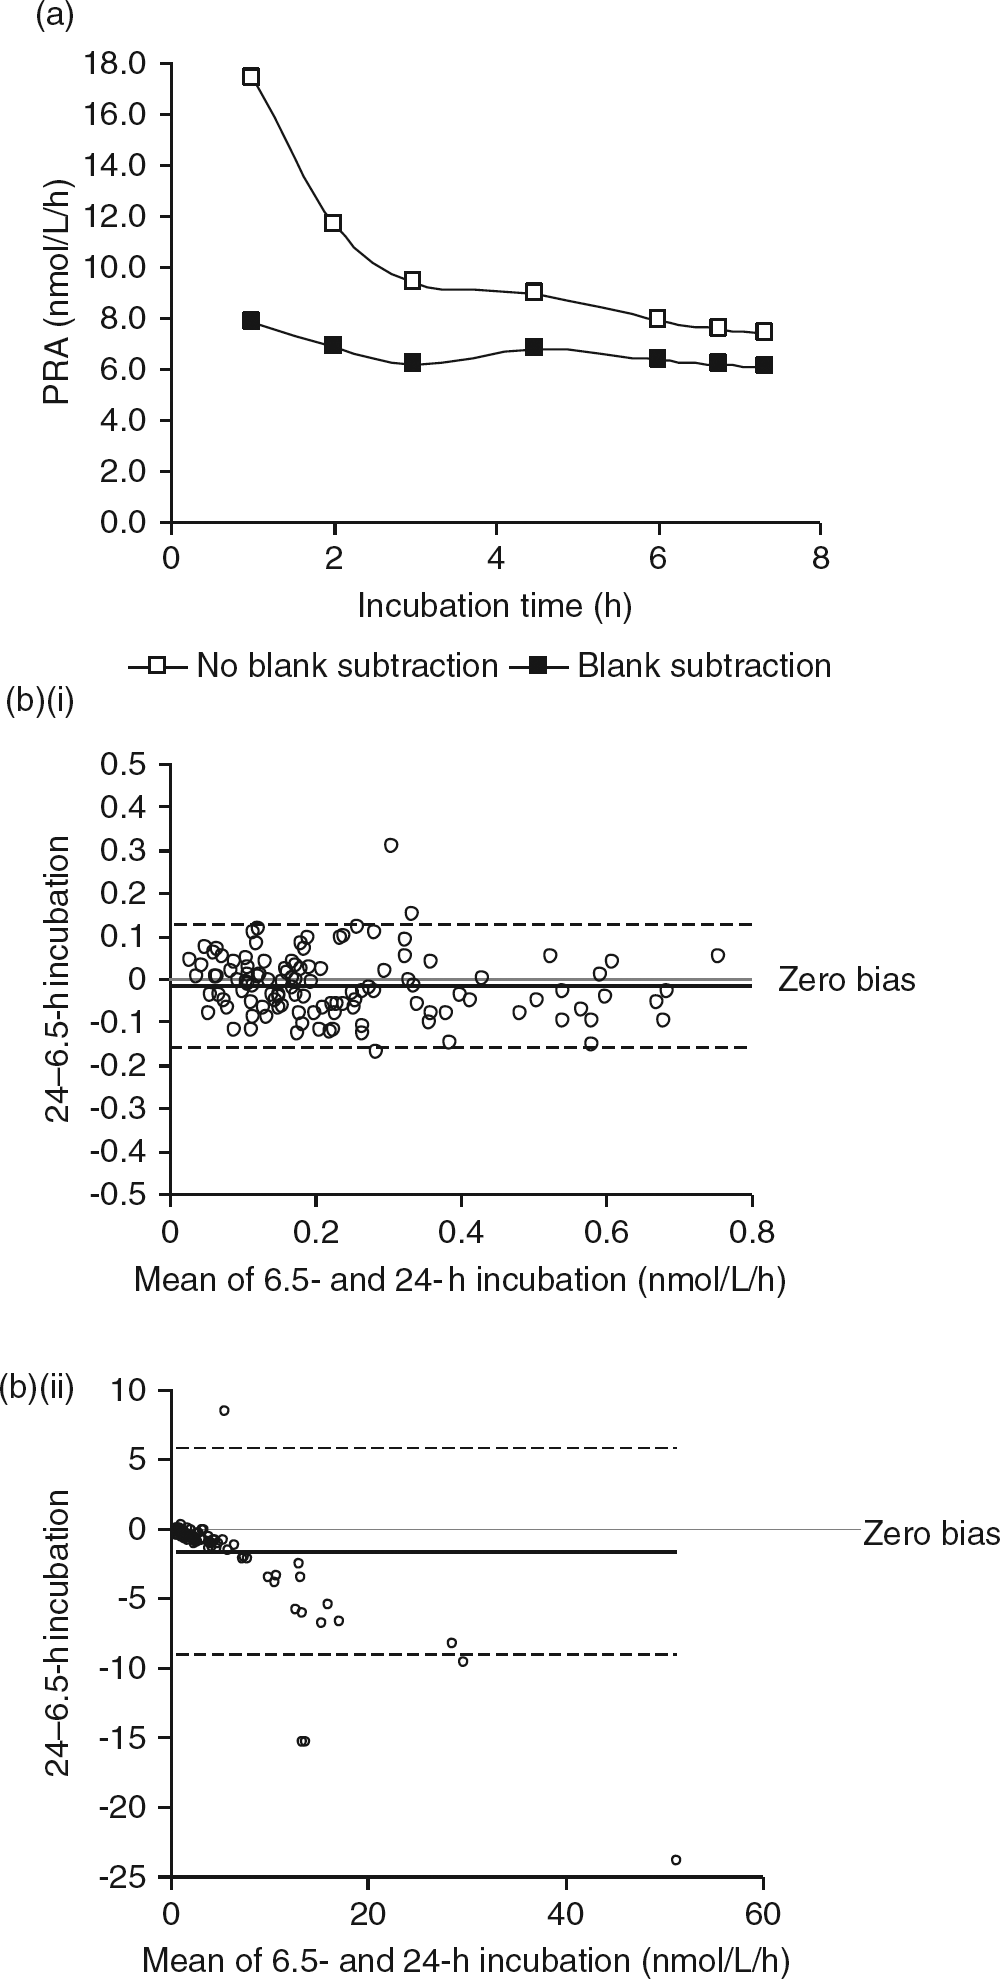
Imprecision of the complete assay
Precision experiments demonstrated that the inter-assay precision of the complete PRA assay (AngI generation and quantification) was 13.9, 12.5, 6.6 and 7.4% at renin activities of 0.2, 1.5, 3.8 and 13.5 nmol/L/h. However, a significant negative bias (20.0, 28.9 and 45.3%) was detected for all three Bio-Rad hypertension markers when the results were compared with the targets published by the manufacturer (derived using the DiaSorin RENCTK RIA kit; DiaSorin Ltd, Kent, UK).
Method comparison
PRA was measured in 95 samples by RIA and XLC-MS/MS. In 12 samples, renin activity was below the LLOQ for either or both assays and these results were excluded from the correlation. The actual results for these samples are presented in Table 1 and show clear agreement between the two methods, with slightly discrepant results being obtained for just one sample. The remaining 83 samples had renin activities that ranged from 0.09 to 16.8 nmol/L/h and these were compared using Analyse-it software. A separate comparison was also performed for the low-activity samples (0.09–1.0 nmol/L/h, n = 40). Bland–Altman analysis (Figures 3a and c) revealed that the XLC-MS/MS method demonstrated a negative proportional bias when compared with the RIA method (mean negative bias of 1.2 nmol/L/h for all samples and 0.3 nmol/L/h for the low-activity samples). The Passing and Bablok method comparisons (Figures 3b and d) gave the following equations: XLC-MS/MS (nmol/L/h) = 0.63 × RIA (nmol/L/h)−0.03 (for all samples) and XLC-MS/MS (nmol/L/h) = 0.58 × RIA (nmol/L/h)−0.02 (for low-activity samples). Correlation coefficient (r
2) values of 0.98 and 0.92 were achieved for all samples and low-activity samples, respectively.
Comparison between XLC-MS/MS and RIA methods for PRA. Eighty-three lithium heparin plasma samples were analysed for PRA by XLC-MS/MS and RIA. Bland–Altman analysis for all samples (a) and for samples with PRA ≤ 1.0 nmol/L/h (c). Solid lines represent the mean negative bias. Dotted lines represent 95% limits of agreement. Passing–Bablok regression analysis between the two methods is shown for all samples (b) and for samples with PRA ≤ 1.0 nmol/L/h (d). The Passing–Bablok fit is depicted by the solid line. XLC-MS/MS, liquid chromatography tandem mass spectrometry; RIA, radioimmunoassay; PRA, plasma renin activity Comparison between XLC-MS/MS and RIA methods for low PRA samples. Twelve lithium heparin plasma samples analysed by XLC-MS/MS and RIA gave PRA results below the LLOQ of either or both methods XLC-MS/MS, liquid chromatography tandem mass spectrometry; RIA, radioimmunoassay; PRA, plasma renin activity; LLOQ, lower limit of quantification.
Reference range determination
PRA was measured in 100 healthy individuals. The median value was 0.68 nmol/L/h (interquartile range: 0.36–1.02 nmol/L/h). A reference range (central 95% of the population) was defined as 0.12–1.75 nmol/L/h.
Renin stability in whole blood
We observed no obvious trend over a 24-h period using either potassium EDTA or lithium heparin as an anticoagulant (Figure 4). This is confirmed by the CVs for each sample which are similar to those obtained in intra-assay precision experiments.
Renin stability in potassium EDTA and lithium heparin whole blood. Seven potassium EDTA (a) and seven lithium heparin (b) whole blood samples were stored at room temperature for 24 h. Aliquots were removed at the indicated time points and the plasma was separated and frozen at −30°C. All plasma aliquots were then thawed and analysed in one analytical run. EDTA, ethylenediaminetetraacetic acid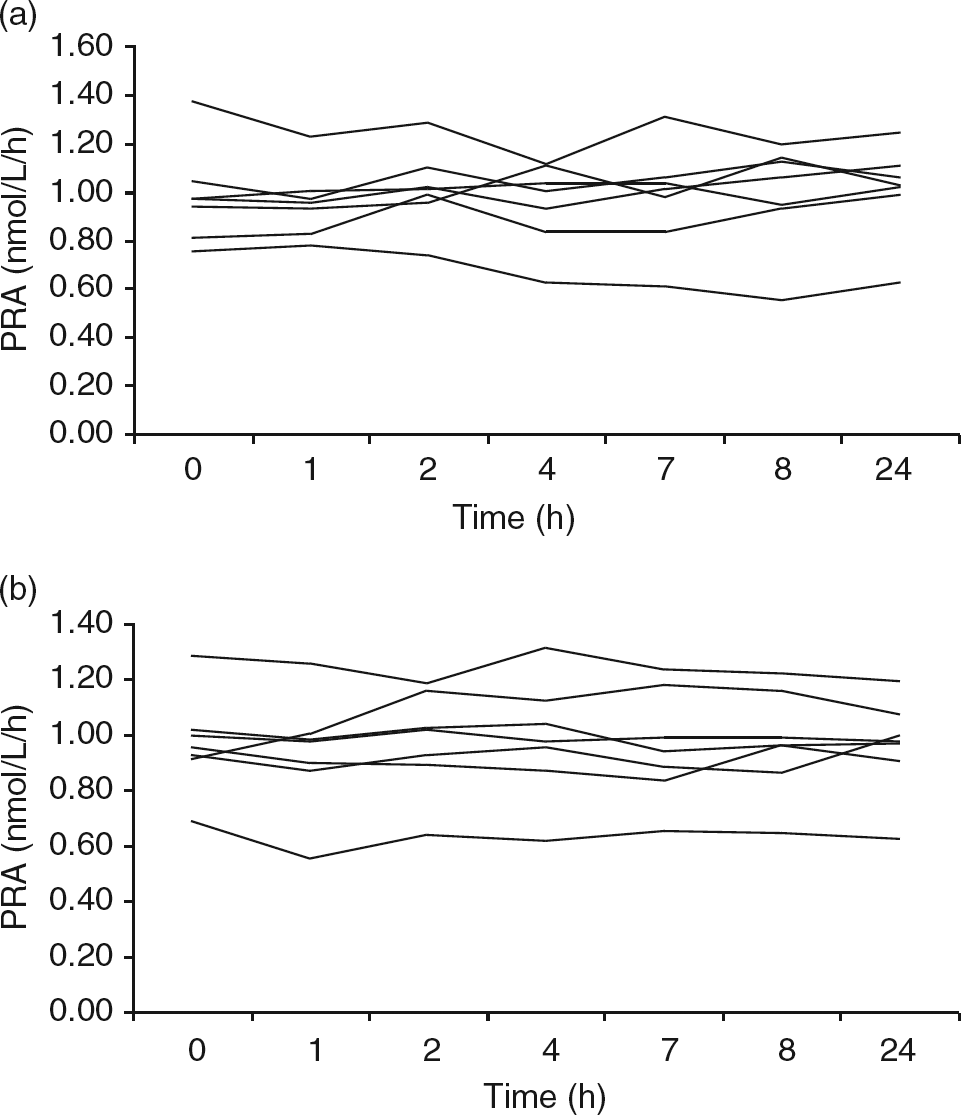
Cryoactivation
We initially obtained 15 anonymized samples (median renin activity = 0.71 nmol/L/h) and examined the effect of storage at 4°C for 6 and 24 h (Figure 5). Most of the samples showed little effect of 4°C storage on renin activity, with just four out of 15 showing more than a 20% increase after 24 h. These tended to be samples with low renin activity and it is likely that these samples contained a high prorenin-to-renin ratio and are therefore more affected by prorenin cryoactivation. We also examined anonymized samples obtained from individuals attending the antenatal clinic (median renin activity = 4.06 nmol/L/h). In five out of the six samples, 6 h at 4°C was sufficient to induce a clear increase in renin activity. After 24 h, renin activity had more than doubled in three out of the six samples.
Effect of storage at 4°C on PRA. Plasma was removed from potassium EDTA samples and stored at 4°C. Aliquots were removed at 0, 6 and 24 h and frozen at −30°C. All plasma aliquots were then thawed and analysed in one analytical run. Percent change in PRA was calculated by dividing the 6- or 24-h result by the 0-h result. Values on the x-axis indicate the PRA for the 0 h sample. PRA, plasma renin activity; EDTA, ethylenediaminetetraacetic acid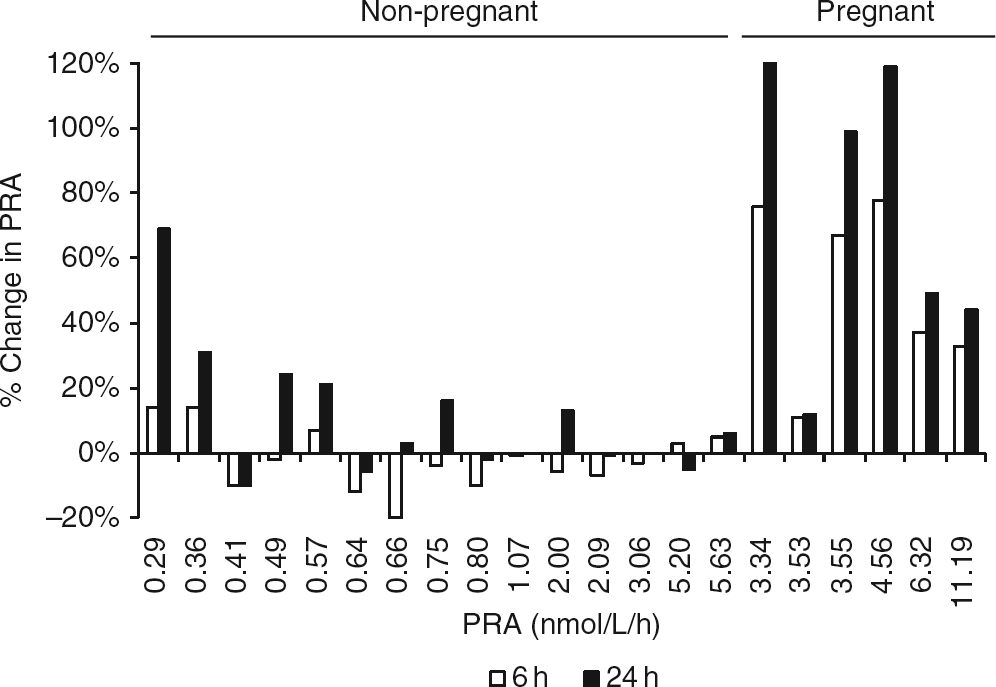
Discussion
We have developed a semi-automated XLC-MS/MS method for the measurement of PRA which uses the Symbiosis™ Pharma HPLC-online SPE system. This method allows us to measure PRA down to 0.08 nmol/L/h using just 50 μL of plasma and requires no manual extraction steps before injection of the incubated plasma samples into the Symbiosis™ system. The method was validated according to FDA guidelines 14 and demonstrated acceptable linearity, recovery, precision and bias.
The PRA assay has previously been shown to have poor inter-laboratory precision and this is likely to be due to the considerable variation in preanalytical and analytical factors which exists between laboratories. In particular, there is significant uncertainty in the literature regarding choice of inhibitors, incubation times, blank subtraction, and sample collection and storage. Consequently, we have evaluated all of these parameters in order to obtain optimal conditions for our assay.
We have carefully optimized the protease inhibitors used during the incubation step to ensure that AngI will be stable in plasma for up to 24 h. Similar to Sealey, 17 we found that a combination of EDTA, PMSF and neomycin were required to stabilize AngI throughout longer, overnight incubations.
During this study, we found that the preincubation AngI was below the LLOQ (1.9 nmol/L) in the majority of samples and therefore could not be measured accurately. Consequently, we decided not to perform blank subtraction and instead extended the length of the incubation to 6.5 h as this significantly reduced any differences between the results obtained with and without blank subtraction for all samples analysed.
The incubation times described for published PRA assays vary significantly from 1 to 18 h. However, the optimum incubation time will be different for each sample and will depend on both renin activity and the amount of AngI present before incubation. Samples with low activity require longer incubation times in order to generate sufficient AngI for quantification. In contrast, long incubation times should be avoided for high-activity samples in order to prevent non-linear AngI production as a result of substrate exhaustion. Ideally, performing a time course for each sample would ensure that the most appropriate incubation time was chosen. However, an assay involving multiple time points would be impractical for a routine service analysing large numbers of samples. Instead, we decided to use two incubation times. For all samples, AngI is quantified after a 6.5-h incubation. Subsequently, any samples with AngI concentration less than 1.9 nmol/L are analysed after a 24-h incubation. Bystrom et al. 10 have suggested that there may be a subset of patients for whom extended incubation times are not suitable, as AngI is rapidly degraded in the plasma of these patients despite the presence of protease inhibitors. In particular, they note that in 2% of patients, almost no AngI remains after a 3-h incubation time. However, in agreement with others, 11,12 we found that for low-activity samples, there is excellent correlation between the results obtained after the two different incubation times, suggesting that AngI production remains linear for 24 h and confirming that in our assay, the proteases remain inhibited for this extended incubation time. We do observe a significant proportional negative bias for higher-activity samples. However, this has been observed before 11 and is likely to be due to substrate exhaustion.
To fit the assay into a working day, we start both the 6.5- and 24-h incubations in the morning. The 6.5-h incubation is then stopped near the end of the day and stored at 4°C overnight. The 24-h plate is stopped the following morning. The 6.5-h plate is analysed first and any samples with AngI concentrations less than 1.9 nmol/L are identified. The low-activity QC and any required 24-h incubations are then analysed immediately after the 6.5 h plate. This assay involves very little manual preparation and 80 samples plus controls can easily be processed in one and a half working days.
Comparison with an established RIA revealed a significant proportional negative bias, with the XLC-MS/MS method measuring 37% lower than the RIA method. The same calibration material was used in both methods and therefore the bias is unlikely to be due to differences in calibration. Similarly, the XLC-MS/MS method also gave results 20–45% lower than the targets given for the lyphochek hypertension markers (generated using the commercial RENCTK RIA). A previously published PRA assay using LC-MS/MS also identified a significant proportional negative bias when comparing their results to an RIA. 11 This type of negative bias is not uncommon when comparing mass spectrometry assays to immunoassays and may be due to a lack of specificity in the antibodies used for the immunoassay.
As a result of the significant negative bias observed, we have defined a reference range which is specific to our assay. This was determined using 100 healthy normotensive individuals. 16 The median value obtained was 0.68 nmol/L/h, which is 25% lower than the median value of 0.9 nmol/L/h obtained for the same population using a RIA (REN-CT2®; Cisbio, Codolet, France). This is consistent with the bias we observed when comparing our assay to other RIAs.
Many studies have suggested that renin is unstable at room temperature and, consequently, patients with suspected PA currently attend the outpatient department in order that blood samples can be received into the laboratory shortly after they are taken. However, in this study, renin was shown to be stable at room temperature for up to 24 h in either potassium EDTA or lithium heparin whole blood. This will enable this assay to be extended to samples taken in primary care, potentially increasing the number of hypertensive patients who can be screened for PA.
It is well established that the renin precursor prorenin can be activated by storage as a liquid at temperatures less than 5°C. This is of great importance for PRA assays as the circulating prorenin concentration is usually much higher than the circulating renin concentration. Also, the PRA assay cannot discriminate between renin which has been generated in vivo and renin which has been produced by the in vitro cryoactivation of prorenin. Since the physiological significance of prorenin is unclear, it is important that PRA assays only measure renin which has been generated in vivo. Consequently, most laboratories use a sample handling protocol which avoids any exposure of PRA samples to 4°C. However, other assays, including the commercial RENCTK assay, recommend collecting samples into prechilled tubes and storing plasma at 4°C. In addition, there remains uncertainty in the literature as to whether short-term storage at 4°C will induce sufficient prorenin cryoactivation to affect the PRA result. We examined this and found that most samples showed little effect of 4°C storage on the PRA result, with just four out of 15 showing more than a 20% increase after 24 h. These tended to be samples with low PRA and it is likely that these samples contain a very high prorenin-to-renin ratio and are therefore more affected by prorenin cryoactivation. Six anonymized samples were also obtained from the antenatal clinic as it is known that prorenin concentrations are markedly increased during pregnancy. In these samples, the effect of 4°C storage was striking, with five out of the six showing a clear increase in PRA after just 6 h at 4°C. This is in agreement with results obtained from a previous study examining prorenin cryoactivation in samples obtained from pregnant women. 23 In conclusion, many samples appear to be unaffected by short-term 4°C storage. However, for specific subsets of samples, cryoactivation of prorenin may be sufficient to significantly change the PRA result. These include samples taken from individuals with low PRA and samples taken from patient groups who are likely to have high circulating prorenin concentrations, e.g. pregnant women and microalbuminuric diabetics. As a result, for this assay, all samples were treated as potentially being sensitive to prorenin cryoactivation and storage/handling at 4°C was avoided.
In conclusion, we have developed a sensitive semi-automated method for PRA, which offers a viable non-isotopic method for the analysis of PRA which negates the need for an isotopic facility in the laboratory. This method has now been in routine use with no problems for over six months. We have also observed no change in the chromatography despite having used the same column for both method development and all patient samples (more than 2000 injections). In addition, our assay improves upon a recently published LC-MS/MS PRA assay 10 as it requires a significantly smaller sample volume, does not require additional filtration steps and, using our optimized incubation conditions, appears to be unaffected by AngI degradation.
DECLARATIONS