
Abstract
Background
Critical care glycaemic control protocols commonly have treatment adjustment (target) ranges spanning ≤2 mmol/L. These require precise point-of-care glucose measurement, unaffected by other variables, to avoid measurement errors increasing glycaemic variability and hypoglycaemic episodes (both strongly associated with mortality in critically ill patients).
Methods
A prospective 206 intensive care patient study was carried out. Arterial glucose concentrations were measured in duplicate using three point-of-care instruments (MediSense Precision PCχ, HemoCue DM and Radiometer 700), a central laboratory instrument (Siemens ADVIA), and in whole blood and plasma using the Yellow Springs Instruments 2300 instrument.
Results
Coefficients of variation for the MediSense, HemoCue, Radiometer and Siemens instruments were 5.1%, 2.5%, 2.1% and 2.3%, respectively. Compared with the Siemens instrument, the bias (95% limits of agreement) for the MediSense, HemoCue and Radiometer instruments were 0.0 (−1.4 to 1.4), 0.0 (−1.2 to 1.1) and −0.2 (−0.9 to 0.6) mmol/L, respectively. The whole blood–plasma glucose concentration difference was significantly affected by the haematocrit. MediSense and HemoCue instrument performances were substantially affected by haematocrit. MediSense instrument performance was also affected by pH and PaO2. Radiometer instrument performance was not affected by haematocrit, pH or PaO2.
Conclusions
The MediSense instrument was too imprecise for use in critically ill patients. The haematocrit range seen is too great to allow fixed-factor conversion between whole blood and plasma values, substantially affecting the accuracy of both glucose meters. However, the Radiometer instrument was unaffected by the haematocrit, pH or pO2, resulting in a performance equivalent to the laboratory method. Instrument performance differences may therefore partially explain the differing results of tight glycaemic control therapy trials.
Introduction
Tight glycaemic control therapy has become part of modern intensive care practice, though results from major randomized trials have been conflicting. 1–4 It has been suggested that these differing outcomes may, in part, result from unreliable glucose measurement by bedside devices. 5–8 Recent work correlating increased glycaemic instability with mortality in intensive care patients, 9–11 has re-enforced the need for reliable glucose measurement, as unreliable measurement may cause unnecessary treatment alterations. 12 The ability of a point-of-care device to represent a patient's blood glucose concentration depends on both its accuracy and its precision, across the range of glucose values of interest in an intensive care population. 13 We therefore undertook a prospective trial of glucose measurement methodologies in intensive care patients, designed to meet published guidelines for the assessment of point-of-care instrument performance. 14 We tested three point-of-care methods: the MediSense Precision PCχ glucose meter as an example of the glucose dehydrogenase amperometric test strip method previously reported to be suitable for blood glucose analysis in intensive care; 15 the HemoCue 201 DM glucose meter as this method had been used in major randomized controlled trials of tight glycaemic control therapy; 1,3 and the Radiometer 700 blood gas analyser, the near-patient blood gas analyser with an amperometric glucose electrode used in two randomized controlled trials of tight glycaemic control therapy which reported mortality improvements. 4,16 The trial was designed to account for differences resulting from comparison of whole blood measurements with plasma measurements, to assess instrument precision and to explore the effects of variables likely to affect glucose meter accuracy in intensive care patients.
Materials and methods
Patients
Following approval from the local ethics committee (REC 06/Q1604/146), 206 patients were recruited from the separate mixed medico-surgical and neurosurgical Intensive Care Units (ICUs) in the John Radcliffe Hospital, May 2007–January 2009. The need for consent was waived by the Ethics Committee to allow recruitment into specific glucose ranges. The hospital has separate paediatric and cardiothoracic ICUs, which were not included in the study.
Selection criteria
Patients above 16 years of age were eligible for inclusion in the trial. To ensure a study population containing patients with the full range of glucose concentrations and clinical conditions present within a critically ill population, we aimed to recruit 60 patients in each of the following categories: receiving ≥30 mL/h enteral feed for ≥3 h but no vasoactive drugs; receiving ≥0.075 μg/kg/min norepinephrine but no enteral feed or other vasoactive drug; receiving neither enteral feed nor vasoactive drugs. In each category, we aimed to recruit half the patients in the range 4–7 mmol/L (the target range on our ICU), and half in the range >7 mmol/L. Recruitment continued until at least 30 patients had been recruited into each of these six subcategories, using the mean plasma glucose concentration measured using the Yellow Springs Instruments (YSI 2300 STAT plus) method to allocate a patient to a category. Where possible, patients with blood glucose concentrations less than 4 mmol/L were recruited. Patients with a known blood glucose concentration ≤2.6 mmol/L were not recruited, as the ICU's management protocol for hypoglycaemia had to be instigated immediately. For patients with a blood glucose of 2.7–3.9 mmol/L, any insulin therapy was immediately stopped, and study samples were taken within 10 min of hypoglycaemia being recognized. The ICU's management protocol for hypoglycaemia was then instigated.
Instruments
Five glucose measurement instruments were used: two bedside glucose meter techniques, Precision PCχ (MediSense, glucose dehydrogenase, whole blood measurement; Abbott Laboratories, Maidenhead, UK,
Samples
Arterial blood was withdrawn from an indwelling line, the first 5 mL discarded and the subsequent sample was divided. Two specimens taken into sodium fluoride:potassium oxalate Vacutainers (BD Diagnostics, Oxford, UK,
The Siemens ADVIA 2400 laboratory analyser (which measures glucose concentration using a glucose hexokinase methodology, widely accepted as the reference method 18 ) was used as the comparator for the point-of-care glucose instruments. The ADVIA 2400 analyser was assessed using a four-hourly quality control regimen using both low- and high-glucose controls. All other instruments were calibrated according to the manufacturers' recommended procedures prior to use on each day in which patients were recruited into the study.
Statistics
Mean coefficients of variation (CVs), CV profile plots (using a constant variance model) 19 and 95% limits of agreement were calculated to assess the repeatability of each instrument, using duplicate analyses of each arterial sample. Bland–Altman plots were used to compare each point-of-care instrument with the laboratory reference (glucose hexokinase) method and agreement between arterial whole blood and arterial plasma samples analysed on the YSI 2300 instrument. To assess agreement with the reference method, the first of the duplicate measures from the point-of-care instrument was compared with the mean of the duplicate reference measures. 14 Agreement between the YSI 2300 method uncorrected arterial whole blood and arterial plasma samples was compared using the means of both duplicates. The corrected standard deviation of the differences was calculated (to correct for the effect of using the mean of two repeated values on measurement error). 20
The number of discordant results between point-of-care and reference methods was calculated using the first of the duplicate measures from the point-of-care instrument in comparison to the mean of the reference duplicates according to the current Clinical and Laboratory Standards Institute (CLSI)/International Organization for Standardization (ISO-15197) criteria. (For glucose concentrations <4.2 mmol/L, the instrument result is taken as concordant if within ±0.83 mmol of the mean laboratory result. For glucose concentrations ≥4.2 mmol/L, the instrument result is taken as concordant if within ±20% of the mean laboratory result.) 14 The numbers of discordant results between point-of-care and reference methods were also calculated in the same manner according to recent joint Evidence-based Laboratory Medicine Committee of the American Association for Clinical Chemistry (AACC) and the National Academy of Clinical Biochemistry guidelines. (For glucose concentrations <5.6 mmol/L, the instrument result is taken as concordant if the total error is <0.8 mmol/L. For glucose concentrations ≥5.6 mmol/L, the instrument result is taken as concordant if the total error is ≤15%). 21
The difference between whole blood and plasma glucose concentrations was compared using a paired t-test.
The relationship between whole blood glucose concentration and plasma blood glucose concentration was estimated using multiple regression allowing for haematocrit, pH and oxygen tension. Non-significant variables were removed one by one, removing the largest P value first until all remaining variables in the model were significant.
The relationship between glucose meter blood glucose concentration and plasma blood glucose concentration (Siemens laboratory reference method) was estimated using multiple regression allowing for the same variables.
Results
Patient characteristics (n = 206)
*Data are mean (SD)
Nine patients had a difference of greater than 4% between the repeated laboratory (Siemens ADVIA 2400) arterial samples (2 receiving epinephrine but no enteral feed, 3 receiving feed but no vasoactive drug and 4 receiving neither enteral feed nor vasoactive drugs; 2 of the patients had a glucose concentration >7 mmol/L, the remaining 7 had glucose concentrations 4–7 mmol/L). These patients were therefore excluded from comparisons with the laboratory reference method (leaving 197 patients included), but included in analyses of instrument precision. 14
Blood glucose concentrations were measured across wide ranges of arterial blood pH (mean 7.38, range 7.01–7.56, 112 samples outside the range 7.35–7.45), haematocrit (mean 0.30, range 0.16–0.49), oxygen tension (mean 13.8, range 4.9–56.5 kPa) and plasma glucose concentration (mean 7.7, range 3–14.5 mmol/L).
The mean percentage CVs for each method are shown (Table 2). The Radiometer method had a mean CV equivalent to the laboratory reference method and had a superior CV profile to all other methods, across the measured range (Figure 1).
Arterial glucose concentration imprecision profiles for MediSense PCχ, Siemens ADVIA, HemoCue DM and Radiometer 700 instruments. Shaded areas represent approximate 95% confidence intervals Measures of instrument performance CLSI, Clinical and Laboratory Standards Institute; AACC, American Association for Clinical Chemistry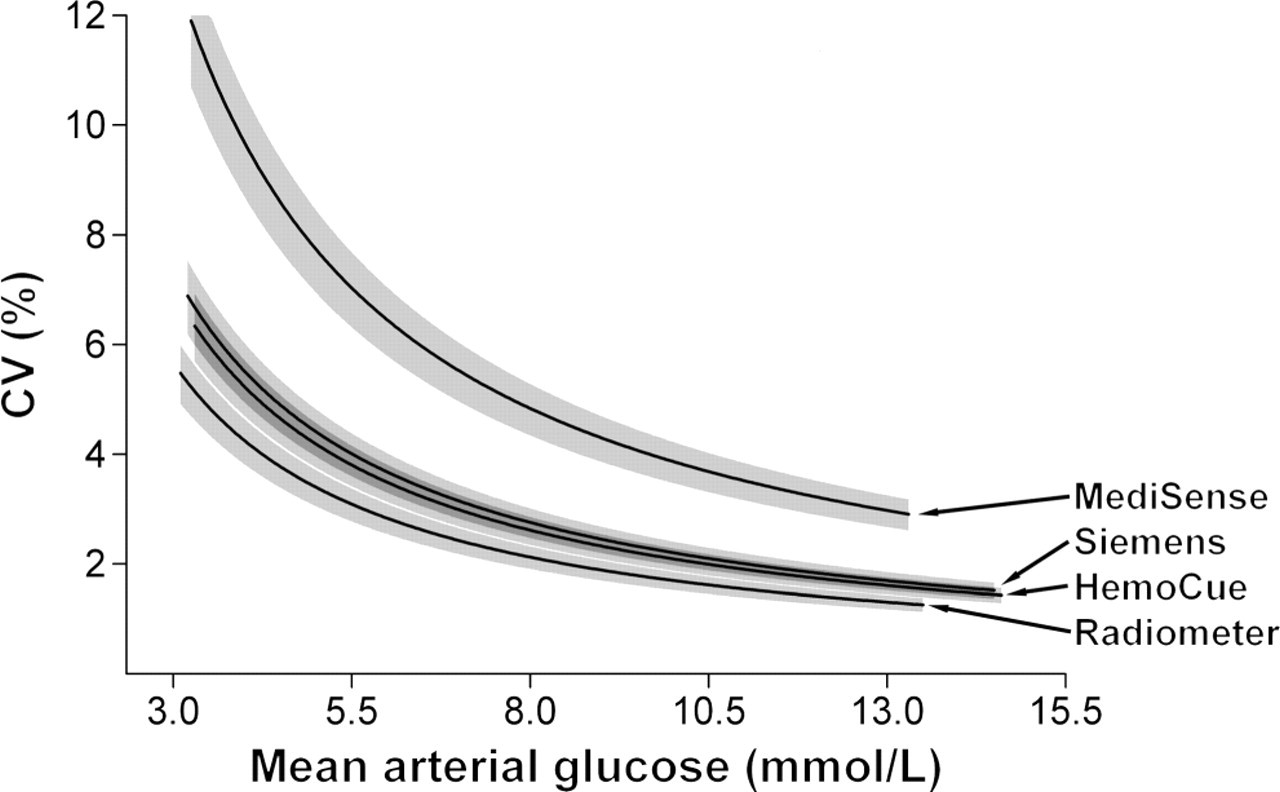
The 95% limits of agreement for the differences between duplicate analyses of the same arterial blood sample for each instrument were 2.1 mmol/L (MediSense), 1.0 mmol/L (HemoCue), 0.8 mmol/L (Radiometer) and 1.1 mmol/L (Siemens) (see Table 2).
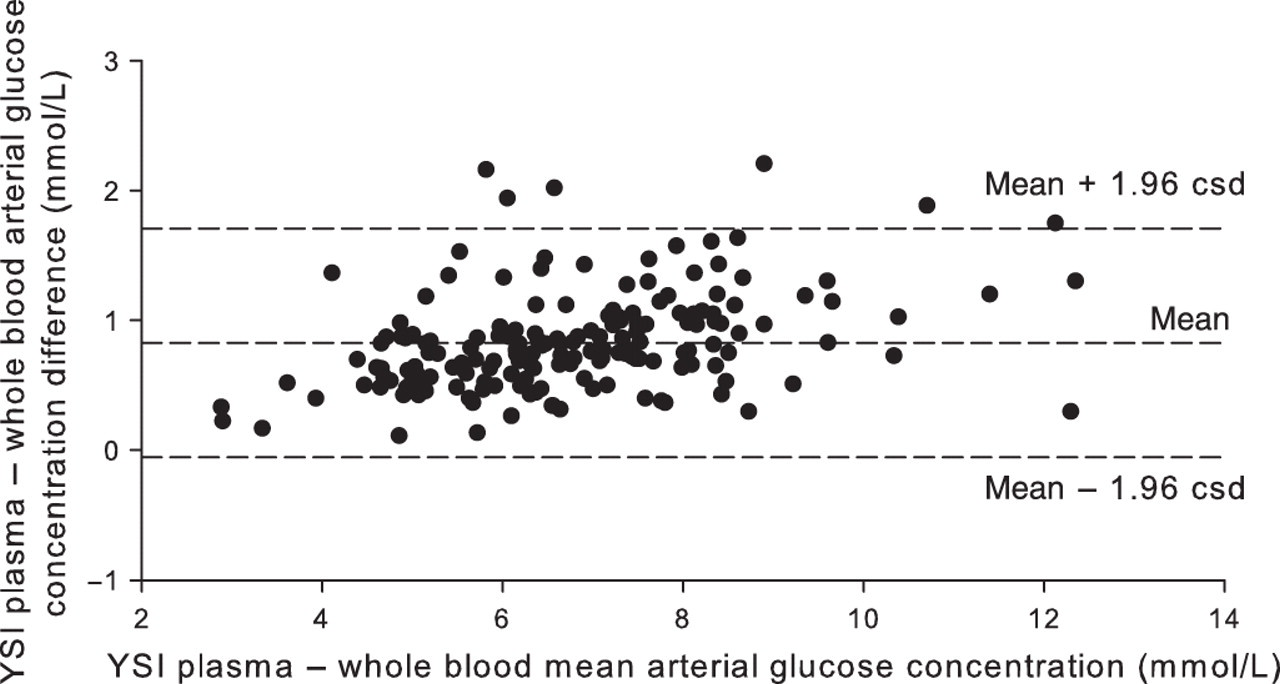
When measured with the same instrument (YSI 2300 STAT plus), uncorrected whole blood glucose concentrations were lower than plasma glucose concentrations (mean difference 0.8, 95% confidence interval [CI] for the mean difference 0.77–0.82 mmol/L, P < 0.0001, 95% limits of agreement −0.1 to 1.7 mmol/L, equivalent to an average conversion factor of 1.12) (see Figure 2). When four variables likely to affect prediction of plasma glucose concentration from whole blood glucose concentration (whole blood glucose concentration, haematocrit, pH and oxygen tension) were modelled together, there was no significant effect of pH (regression coefficient −1.34, [95% CI −0.69 to 0.42], P = 0.69) or oxygen tension (regression coefficient 0.007, [95% CI −0.003 to 0.17] P = 0.18). When pH was removed from the model, oxygen tension remained non-significant. Haematocrit (regression coefficient 2.5, [95% CI 1.5–3.5], P < 0.001, equivalent to a change between whole blood and plasma glucose of 0.25 mmol/L per 0.1 change in haematocrit) and whole blood glucose (WBG) concentration (regression coefficient 1.057, [95% CI 1.024–1.089], P < 0.001) remained significant when oxygen tension was removed (R
2 = 0.96). With both significant variables available, plasma glucose (PG) concentration can be estimated using the equation:
Bland–Altman plot of the agreement between plasma and whole blood arterial glucose concentrations (mmol/L) (Yellow Springs Instrument 2300). Csd, corrected standard deviation
Multiple regression of the effects of haematocrit, pH and oxygen tension on the difference between glucose concentrations as measured in whole blood by point-of-care devices versus plasma (Laboratory, Siemens ADVIA 2400)
When the four variables were modelled together to assess their effect on the difference between glucose concentrations as measured by the HemoCue instrument and by the Siemens laboratory reference method, haematocrit had a highly significant effect and pH had an effect of borderline significance (Table 3). Oxygen tension did not have a significant effect. Removal of oxygen tension from the model had little effect on the significance of the other variables, both of which remained of similar significance. Calculated from the regression equation, the measured glucose concentration varied by 1.7 mmol/L across the observed haematocrit range.
When the four variables were modelled together to assess their effect on the difference between glucose concentrations as measured by the Radiometer instrument and by the Siemens laboratory reference method, there was no significant effect of haematocrit, pH or oxygen tension (Table 3). All variables remained non-significant after stepwise removal, removing the least significant variable first.
The bias (95% limits of agreement) are presented for the three ‘point-of-care’ methods in comparison with the Siemens laboratory reference method (Table 2), with Bland–Altman plots (Figure 3). Neither the MediSense nor HemoCue glucose meters had a bias in comparison with the laboratory method. The Radiometer method had the smallest limits of agreement (±0.8 mmol/L) but had a small bias (−0.2 mmol/L, 2.1%, see Figure 3c).
Bland–Altman plots of the agreement between: (a) MediSense PCχ and Siemens ADVIA (laboratory hexokinase); (b) HemoCue DM and Siemens ADVIA (laboratory hexokinase); and (c) Radiometer 700 and Siemens ADVIA (laboratory hexokinase) arterial glucose measurements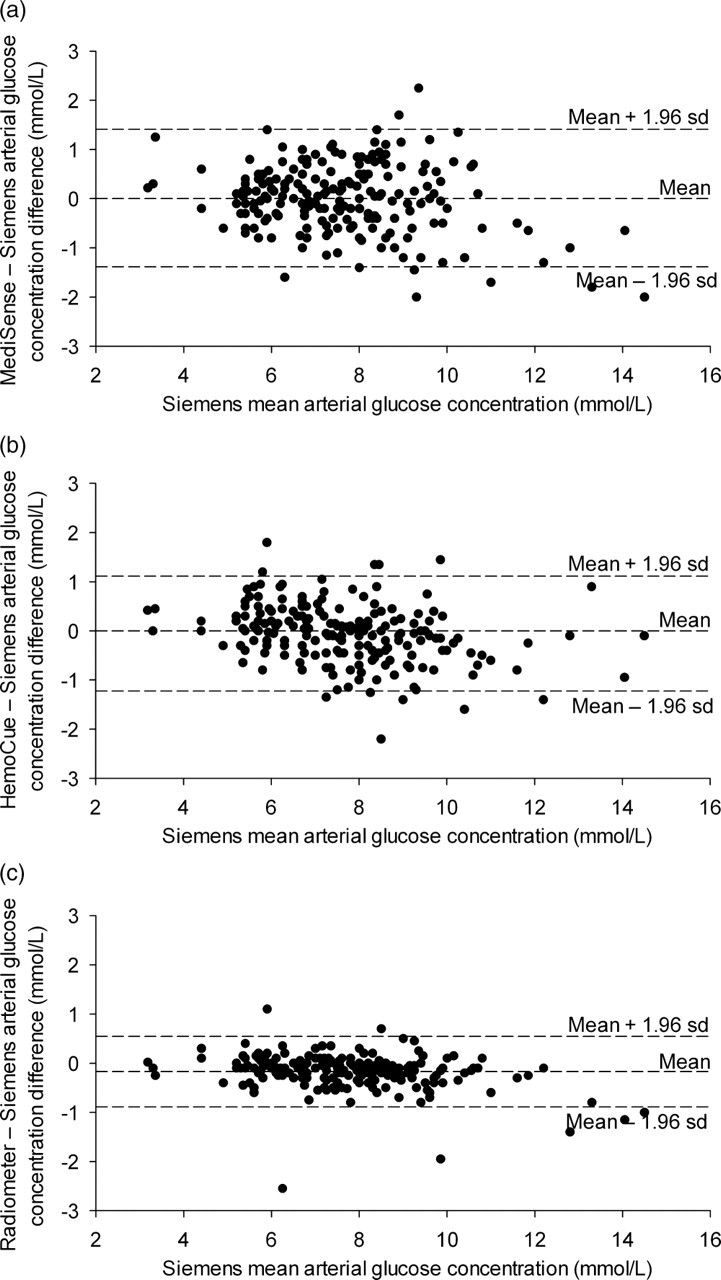
The number of patients' samples for whom CLSI criteria in comparison with the Siemens laboratory reference method were not met is shown by instrument in Table 2. One patient with hypoglycaemia as measured using the Siemens method (blood glucose 3.4 mmol/L) had a glucose concentration of 4.6 mmol/L as measured using the MediSense instrument (outside the 0.83 mmol/L tolerance criteria for this range). All other cases where CLSI criteria were not met occurred with sample sets with a reference method glucose concentration >4.2 mmol/L (outside the 20% tolerance criteria for this range).
The number of patients' samples for whom the Evidence-based Laboratory Medicine Committee of the AACC and the National Academy of Clinical Biochemistry criteria were not met is also shown by instrument in Table 2. Eight (MediSense instrument), six (HemoCue instrument) and two (Radiometer instrument) of 19 patients' sample sets with glucose concentrations <5.6 mmol/L measured with the reference method had a total error ≥0.8 mmol/L. All other cases where AACC criteria were not met occurred where the glucose concentration measured by the reference method was ≥5.6 mmol/L (and the total error seen with the point-of-care instruments was above the 15% accepted tolerance criteria for this range). Of the three instruments assessed, only the Radiometer instrument performed to this standard.
Discussion
Apart from a slightly larger excess of men than normally seen, the study population is broadly representative of mixed intensive care unit populations. 22,23 By recruiting to different glucose ranges, as opposed to taking a convenience sample, as in many previous studies, 15,24–38 a population sample representing the range of ‘normal’ and ‘elevated’ blood glucose concentrations of interest in intensive care patients was achieved.
Previous studies in critically ill patients have not taken replicate measurements using the same instrument, and have therefore been unable to comment on the precision (or repeatability) of these instruments in this patient population. 15,25–38 Simulation modelling studies of the effects of instrument inaccuracy and imprecision, using treatment ranges similar to those suggested in published intensive care protocols, suggest that to provide 95% correct insulin-dosing, both the bias and CV of the instrument need to be <2%. 12
The MediSense glucose meter had a mean CV determined using duplicate analyses of each arterial sample substantially above 2% (5.1%). The corresponding 95% limits of agreement span a 2.1 mmol/L range, greater than the treatment adjustment ranges of many intensive care glycaemic control protocols, outside which alterations in insulin infusion rates will occur. 2,4,39
The HemoCue instrument had a mean CV of 2.5% determined using duplicate analyses of the same arterial sample, but no bias from the laboratory reference method (Table 2). Our study design allowed the construction of CV profile plots across the range of glucose concentrations of interest in a critically ill patient population. The CV profile was non-linear, with higher coefficients in the 4–9 mmol/L range, where most patients' glucose concentration would be expected to be once treatment had commenced (Figure 1).
Although the Radiometer instrument had a bias (2.1%) slightly above that recommended, it had the best repeatability of the point-of-care methods (2.1% – again marginally above that recommended, and also non-linear). In fact, the CV profile for the Radiometer instrument was superior to our laboratory reference method (Siemens ADVIA; see Figure 1).
Our study fills a known gap in the literature 40 by confirming that, measured with the same instrument, the expected linear relationship between arterial whole blood and arterial plasma glucose concentration remains in an intensive care population. The observed mean factor (1.12) required for conversion of whole blood glucose concentration into equivalent plasma glucose concentration in this study of intensive care patients is very similar to that recommended by the International Federation of Clinical Chemistry (1.11). 41 This mean offset of whole blood values from plasma values was not seen with any of the other whole blood measurement methods used, implying that the manufacturers have incorporated an appropriate mean conversion factor, as recommended. 41 However, the recommended conversion assumes a normal haematocrit. 41 In critically ill patients, recommended restrictive transfusion practice results in low haematocrit values. 42 In our model, the arterial–plasma difference was observed to be linearly related to the haematocrit. At the extreme of the observed values (whole blood glucose = 2.6 mmol/L, haematocrit = 0.49), use of the regression equation to calculate a plasma-equivalent value produces a result different from that calculated using the recommended conversion factor (1.11) by 0.8 mmol/L (2.9 versus 3.7 mmol/L). This difference is nearly half the target range (4.4–6.1 mmol/L) required when undertaking ‘tight glycaemic control’ therapy. 4
In critically ill patients, the haematocrit must therefore be taken into account when presenting plasma-equivalent values calculated from whole blood measurements. Regression equations for the two glucose meters suggest that the measured glucose concentration would vary by 1.7 mmol/L (HemoCue instrument) or 2.2 mmol/L (MediSense instrument) across the observed haematocrit range, both near to the target range for ‘tight glycaemic control’ therapy. This haematocrit-dependent effect in critically ill patients in the era of restrictive transfusion practice is likely to explain why haematocrit-related adjustments are suggested to improve glucose meter performance in these patients. 43,44
For the MediSense instrument, the regression equation suggests that the measured glucose concentration would also vary by 0.8 mmol/L over the observed pH range in the study, confirming previous in vitro work suggesting that point-of-care meters may be unreliable in patients with significant pH derangements. 45 Previous in vitro work had also suggested that oxygen tension might significantly affect glucose oxidase-based point-of-care measurements in patients receiving oxygen therapy. 46 Our study results demonstrate that sensitivity to oxygen tension may be a real problem in the special circumstances of ICU practice, as, with the MediSense instrument, the measured glucose concentration would have varied by 1.4 mmol/L over the range of oxygen tensions present (despite it being a glucose dehydrogenase-based test). In contrast, for the Radiometer instrument, measured glucose concentrations were not significantly affected by the haematocrit, pH or oxygen tension.
Unlike other studies, 15,25,28,29,43,44 we did not find that the point-of-care methods overestimated blood glucose concentrations in comparison with the laboratory plasma reference method. As two of these studies assessed the MediSense instrument 15,43 which in our study showed no offset from the laboratory method, this disagreement seems likely to result from study methodology rather than the instruments assessed. Our procedure for minimizing the glucose consumption within the laboratory sample (by using ice and rapid transfer to the laboratory for immediate separation 17 ) was not reported in these studies of critically ill patients, and is likely to provide the explanation for our differing results. Following the recent recommendation that glucose concentrations measured using glucose meters should be corrected downward to account for the difference between glucose meter and laboratory concentrations 43,44 may therefore lead to serious underestimation of a patient's actual glucose concentration. In consequence, implementing this recommendation may increase the risks of ‘tight glycaemic control’ therapy to the patient.
We have not presented correlation coefficients or consensus error grid results to compare the results from the point-of-care instruments with those from the reference method. As the two instruments under comparison are measuring the same variable, the correlation is likely to be very high, but does not provide a suitable measure of agreement. 20 The consensus error grid was designed to evaluate errors in glucose measurement for patients with diabetes mellitus, and the disagreement between results required before the error is classified as altering clinical action is much greater than would be the case with most intensive care glycaemic control protocols. 47 For similar reasons, CLSI criteria (which all the instruments fulfilled) may be of limited use in this field. Simulation modelling studies, 12,48 and recent joint Evidence-based Laboratory Medicine Committee of the AACC and the National Academy of Clinical Biochemistry guidelines 21 have focused on total analytical error as a measure of instrument performance. Developed partly in recognition of the challenges created by glycaemic control therapy in critically ill patients, the guidelines suggest an intermediate target for total analytical error for portable glucose meters of ≤15% for 95% of patients. The Radiometer instrument alone met these criteria.
The study is limited as it contains only three patients with arterial plasma blood glucose concentrations less than 4 mmol/L, and the abilities of the instruments assessed in these ranges must be interpreted with caution, particularly as the CV profiles suggest a progressive worsening in repeatability in this range. As plasma glucose concentrations of <4 mmol/L are considered harmful and treated immediately, it seems unlikely that a clinical study of this type will deliver better information. As many glycaemic control protocols would actively treat any plasma glucose concentration <4 mmol/L in a similar manner, the performance of an instrument within this range may not be as important as performance in the higher ranges.
Our study was designed to assess the repeatability of glucose measurements over the range of glucose concentrations relevant in critically ill patients, to minimize glucose consumption within the laboratory reference sample and to allow the effects of haematocrit, pH and oxygen tension on glucose measurement in a critically ill population to be quantified. This design made it possible to demonstrate, in contrast to previous studies, 15,25,28,29,43,44 that the glucose meters we assessed perform inadequately in critically ill patients not because they overestimate glucose concentrations, but because their repeatability (or precision) is poor across the range of glucose concentrations of interest and they are also substantially affected by other variables which have a wide range within the intensive care population. Neither glucose meter met recent AACC performance criteria. Although the Radiometer 700 instrument marginally underestimated blood glucose concentrations in comparison with the reference method, it had superior repeatability in comparison with all other methods across the range of glucose concentrations of interest (as judged by the 95% CIs of the imprecision profiles, see Figure 1) and was not affected by other variables. These properties resulted in a substantially higher level of agreement with the laboratory reference method (Table 2), with overall performance exceeding AACC criteria. This dependence of the performance of a glucose measurement instrument in critically ill patients on both the precision across the range of glucose concentrations of interest and the influence of other variables has not been previously demonstrated.
The largest trial of tight glycaemic control therapy in critically ill patients recently reported harm from the therapy. 2 However, this trial (as with other trials of tight glycaemic control therapy with negative results 1,3,49–51 ) allowed the use of both point-of-care meters and blood gas analysers. Only two major trials of tight glycaemic control therapy in critically ill patients have shown a mortality benefit; 4,16 both restricted blood glucose analysis to a Radiometer 700 blood gas analyser, minimizing the risks of measurement-related glycaemic variability and hypoglycaemic episodes.
Conclusion
The ability of point-of-care glucose meters to reliably estimate glucose concentrations in critically ill patients depends both on their precision and on the effects of other variables which may affect glucose measurement, with wide ranges in this patient population. These factors should be considered in any subsequent assessment of the suitability of glucose measurement instruments for use in this population. The Radiometer 700 instrument had precision at least equivalent to our reference method and was unaffected by haematocrit, oxygen tension or pH. These properties resulted in the Radiometer 700 having a substantially higher level of agreement than the glucose meters with the laboratory reference method. In consequence, it was the only instrument tested to meet recently suggested AACC performance criteria.
The two major trials of tight glycaemic control therapy in critically ill patients which have shown mortality benefits restricted blood glucose analysis to the Radiometer instrument. The choice of this method of glucose analysis minimized the risks of measurement-related glycaemic variability and hypoglycaemic episodes, both highly associated with mortality in critically ill patients. This may, in part, explain why the mortality benefits seen in these trials have not been repeated in trials using less reliable glucose measurement instruments.
DECLARATIONS