
Abstract
Background
Glycated haemoglobin (HbA1c) concentration is lower relative to glyacemic control in diabetic patients on haemodialysis. However, it is unknown as to whether this is also true for diabetic patients with end-stage renal disease but not on haemodialysis.
Methods
Correlations between HbA1c or glycated albumin (GA) and estimated glomerular filtration rate (eGFR) (determined by serum creatinine concentration, sex and age) were investigated in 86 diabetic patients with renal dysfunction not on dialysis. The mean values of HbA1c and of red blood cell (RBC) lifespan were compared among four groups of patients: Group 1 (n = 30, eGFR ≥ 60 mL/min/1.73 m2), Group 2 (n = 30, eGFR < 60 mL/min/1.73 m2 but ≥30 mL/min/1.73 m2), Group 3 (n = 13, eGFR < 30 mL/min/1.73 m2 but ≥15 mL/min/1.73 m2) and Group 4 (n = 13, eGFR < 15 mL/min/1.73 m2 without haemodialysis). RBC lifespan was determined in each subject from the difference between alveolar carbon monoxide (CO) concentration and atmospheric CO concentration.
Results
HbA1c was significantly correlated with eGFR (r = 0.37, P = 0.0004), but GA was not. The HbA1c values in Group 3 (6.8 ± 0.6%) and Group 4 (6.3 ± 0.5%) were significantly lower than that in Group 1 (7.4 ± 0.8%), but there was no difference between Group 2 (7.2 ± 0.7%) and Group 1. There was a significant correlation between RBC lifespan and eGFR, and the mean RBC lifespan in Group 3 (96 ± 35 d) and Group 4 (94 ± 30 d) were significantly shorter than that in Group 1 (127 ± 30 d).
Conclusions
Diabetic patients with stage 4 or 5 chronic kidney disease not on haemodialysis had significantly lower values of HbA1c and shorter RBC lifespan compared with diabetic patients without renal dysfunction.
Introduction
Glycated haemoglobin (HbA1c) is considered the gold standard for evaluating not only glyacemic control but also the risk of diabetic complications. 1,2 It provides a history of plasma glucose concentrations during the preceding 120 d, corresponding to the average red blood cell (RBC) lifespan. Recently, the accuracy of HbA1c measurements has become more important because HbA1c is now recommended for the diagnosis of diabetes mellitus. 3 However, any conditions that change RBC turnover, such as haemolytic anaemia, chronic malaria, major blood loss or blood transfusion, may lead to spurious HbA1c results. 4,5 Recently, end-stage renal disease (ESRD) with haemodialysis was added to the list of conditions that might cause spurious HbA1c values. 6–8 However, few studies have been performed to determine whether this also applies to ESRD patients not on haemodialysis. 9
The goal of the present study was to clarify the validity of HbA1c values in patients with diabetes mellitus and ESRD who were not on haemodialysis. Furthermore, we attempted to relate changes in HbA1c values to the stage of chronic kidney disease (CKD). An additional objective was to elucidate the mechanisms responsible for changes in HbA1c values in diabetic patients with renal dysfunction.
Methods
Subjects
Clinical characteristics of the study groups
Hb, haemoglobin; BMI, body mass index; OHA, oral hypoglycaemic agent; GA, glycated albumin; PPG, postprandial glucose; eGFR, glomerular filtration rate estimated by serum creatinine concentration, sex and age 10
*Kruskal–Wallis test
†Fisher's exact test
Measurements
Postprandial plasma glucose value was obtained around two hours after a meal and shown as a mean of the values measured on three separate occasions approximately one month apart. HbA1c was measured by high-performance liquid chromatography using a Tosoh G7 Analyzer (Tosoh, Tokyo, Japan). The HbA1c values thus obtained (Japan Diabetes Society; JDS) were converted to National Glycohemoglobin Standardization Program (NGSP) values by adding 0.4% to JDS.
11
Serum GA was determined with a Siemens Dimension Xpand Plus (Siemens, Deerfield, IL, USA) by an enzymatic method using albumin-specific proteinase, ketoamine oxidase and albumin assay reagent (Lucica GA-L; Asahi Kasei Pharma Co, Tokyo, Japan).
12
RBC lifespan was calculated with the following formula proposed by Stocchi et al:
13
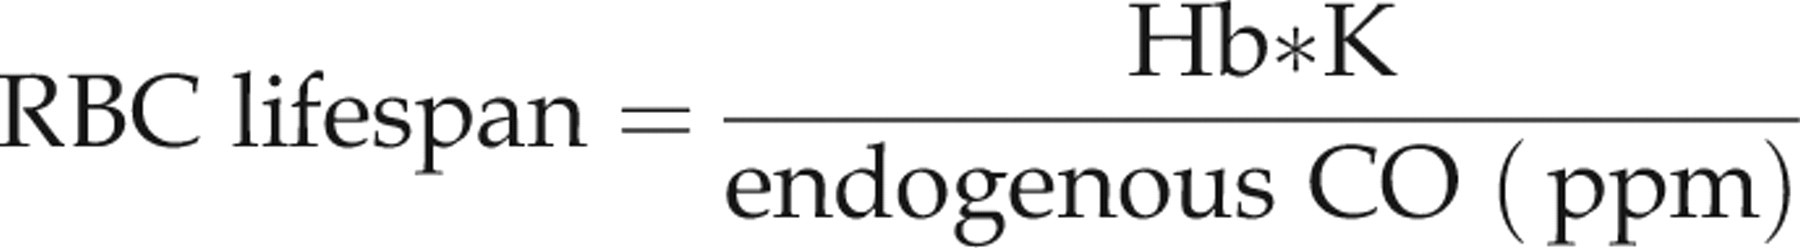
Endogenous CO was estimated by measuring exhaled carbon monoxide concentration determined with a Carbolyzer mBA-2000 (Taiyo, Osaka, Japan).
RBC lifespan in 18 healthy non-smoking volunteers was 128 ± 28 d.
Other laboratory measurements were performed on a standard autoanalyser (Biomajesty JCA-BM2250; Japan Electron Optics Laboratory, Tokyo, Japan).
Statistical analyses
Multiple regression analysis of HbA1c value
COAv, average CO concentration in exhaled breath (ppm); UP, urinary protein (g/g creatinine); ESA, erythropoietin-stimulating agents; eGFR, glomerular filtration rate estimated by serum creatinine concentration, sex and age; CKD, chronic kidney disease; GA, glycated albumin; HbA1c, glycated haemoglobin; Hb, haemoglobin; BMI, body mass index; OHA, oral hypoglycaemic agent; PPG, postprandial glucose
Variable significantly (P < 0.05) associated with HbA1c in the simple linear regression analysis are included in the iniitial model of multiple regression analysis
Variable selected from the initial model of multiple regression analysis by backward elimination procedure with elimination criteria of P > 0.05 are included in the final model
Values are expressed as mean ± SD unless otherwise indicated. All the statistical analyses were performed with the use of SAS Version 9.1.3 (SAS Institute, Inc., Cary, NC, USA), and a P value < 0.05 was considered statistically significant.
Results
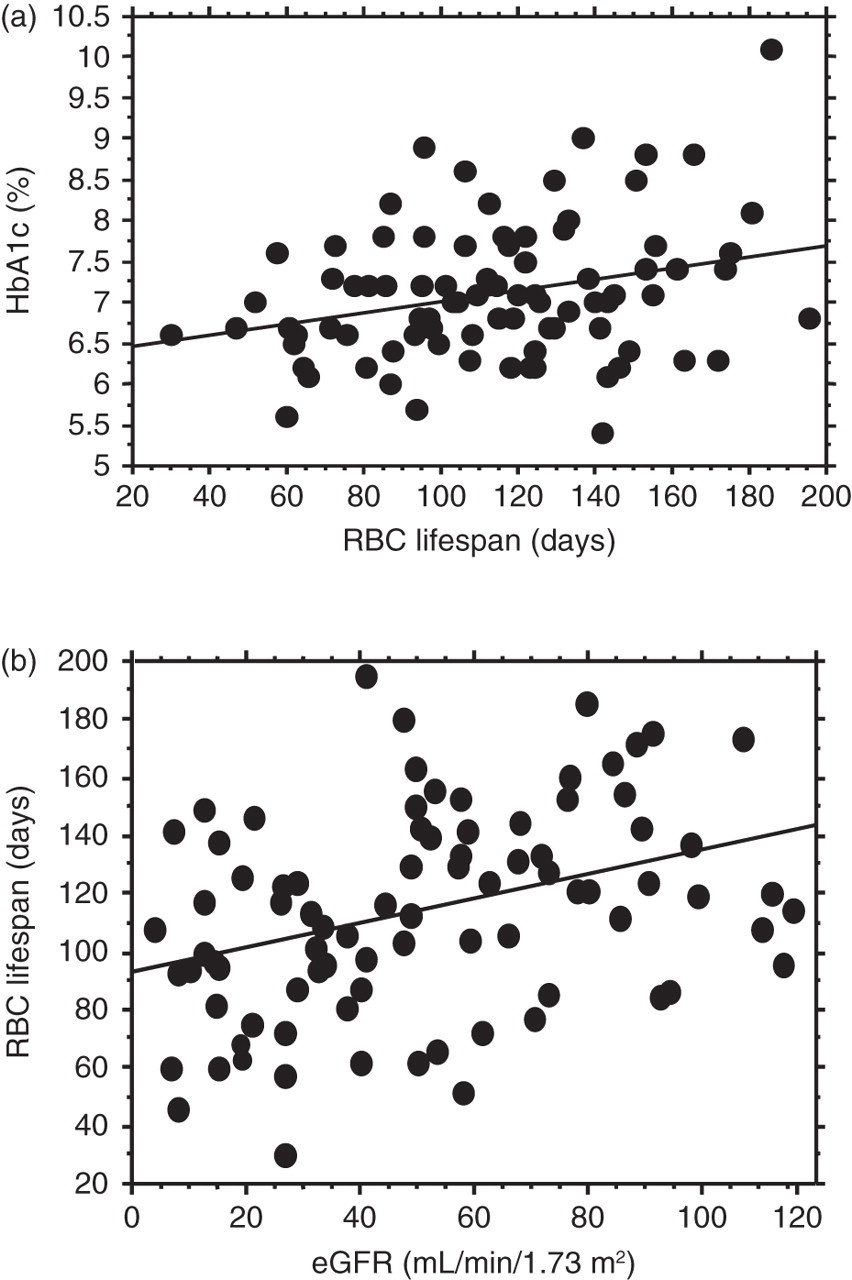
A significant correlation (r = 0.37, P = 0.0004) between HbA1c and eGFR was found, as shown in Figure 1. No significant differences in the mean postprandial plasma glucose concentrations or GA concentrations were found among the four groups as shown in Table 1. However, HbA1c values in Group 3 (6.8 ± 0.6%) and Group 4 (6.3 ± 0.5%) were significantly lower than that in Group 1 (7.4 ± 0.8%), but there was no difference between Group 2 (7.2 ± 0.7%) and Group 1, as shown in Figure 2a. Net differences in HbA1c concentrations between Group 1 and Group 3, and between Group 1 and Group 4 were 0.6% and 1.1%, respectively, and these corresponded to percent differences of 8.4% and 15.5%. There was no significant difference in HbA1c values between the patients treated with ESA (n = 10, 6.6 ± 0.6%), and without ESA (n = 16, 6.5 ± 0.5%). Furthermore, there was no significant difference in RBC lifespan between the patients treated with ESA (83.2 ± 22.2 d) and without ESA (102.6 ± 36.6 d); however, there was a significant difference (P < 0.01) in haemoglobin (Hb) concentration between the patients treated with ESA (8.8 ± 1.2 g/dL) and without ESA (10.7 ± 0.9 g/dL). Figure 3 depicts the HbA1c values plotted against the erythrocyte lifespan (a), and the erythrocyte lifespan plotted against eGFR (b) in the 86 subjects. As shown in this figure, a significant correlation existed between HbA1c and RBC lifespan (r = 0.29, P < 0.0068). There was also a significant correlation between RBC lifespan and eGFR (r = 0.36, P = 0.0005). Furthermore, mean RBC lifespan in Group 3 (96 ± 31 d) and Group 4 (94 ± 30 d) were significantly shorter than that in Group 1 (127 ± 30 d), as shown in Figure 2b.
Scatterplot showing the association between HbA1c and eGFR in 86 diabetic patients with various levels of renal dysfunction. HbA1c, glycated haemoglobin; eGFR, glomerular filtration rate estimated with serum creatinine concentration, sex and age.
9
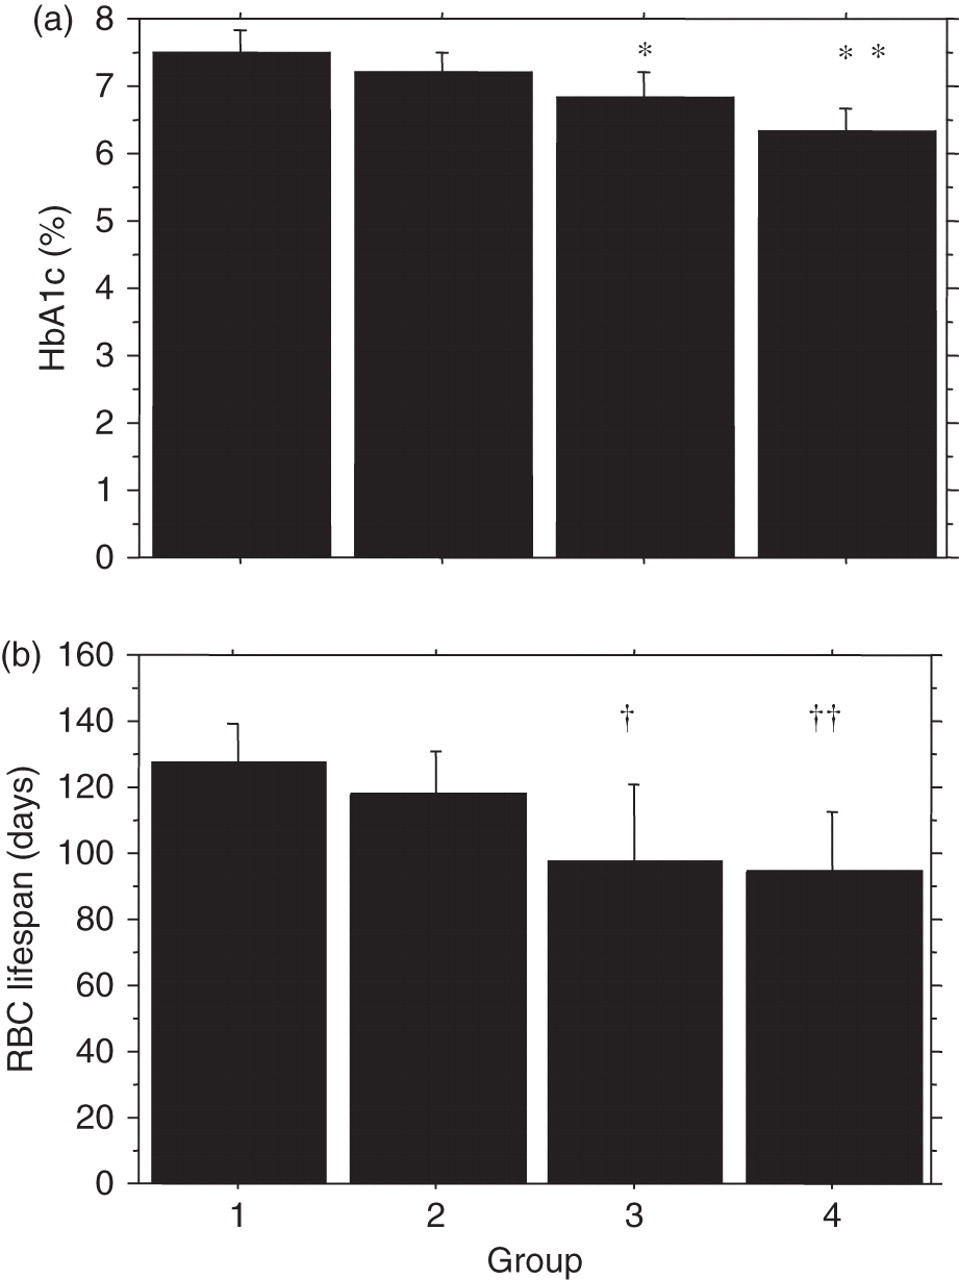
r = 0.37, P = 0.0004 Mean values of HbA1c (a) and of erythrocyte lifespan (b) in the study groups. The subjects were divided into four groups according to their eGFR: Group 1 (n = 30, eGFR ≥ 60 mL/min/1.73 m2), Group 2 (n = 30, eGFR < 60 mL/min/1.73 m2 but ≥30 mL/min/1.73 m2), Group 3 (n = 13, eGFR < 30 mL/min/1.73 m2 but ≥ 15 mL/min/1.73 m2) and Group 4 (n = 13, eGFR < 15 mL/min/1.73 m2 without haemodialysis). Data are presented as the mean ± SD. Different from Group 1; *P = 0.035, **P < 0.001, †
P = 0.016, ††
P = 0.009. HbA1c, glycated haemoglobin; eGFR, glomerular filtration rate estimated with serum creatinine concentration, sex and age; RBC, red blood cell Scatterplot showing the association between HbA1c and erythrocyte lifespan (a), and erythrocyte lifespan and eGFR (b) in 86 diabetic patients with various levels of renal dysfunction. (a) r = 0.29, P < 0.0068 and (b) r = 0.36, P = 0.0005. HbA1c, glycated haemoglobin; RBC, red blood cell; eGFR, glomerular filtration rate estimated with serum creatinine concentration, sex and age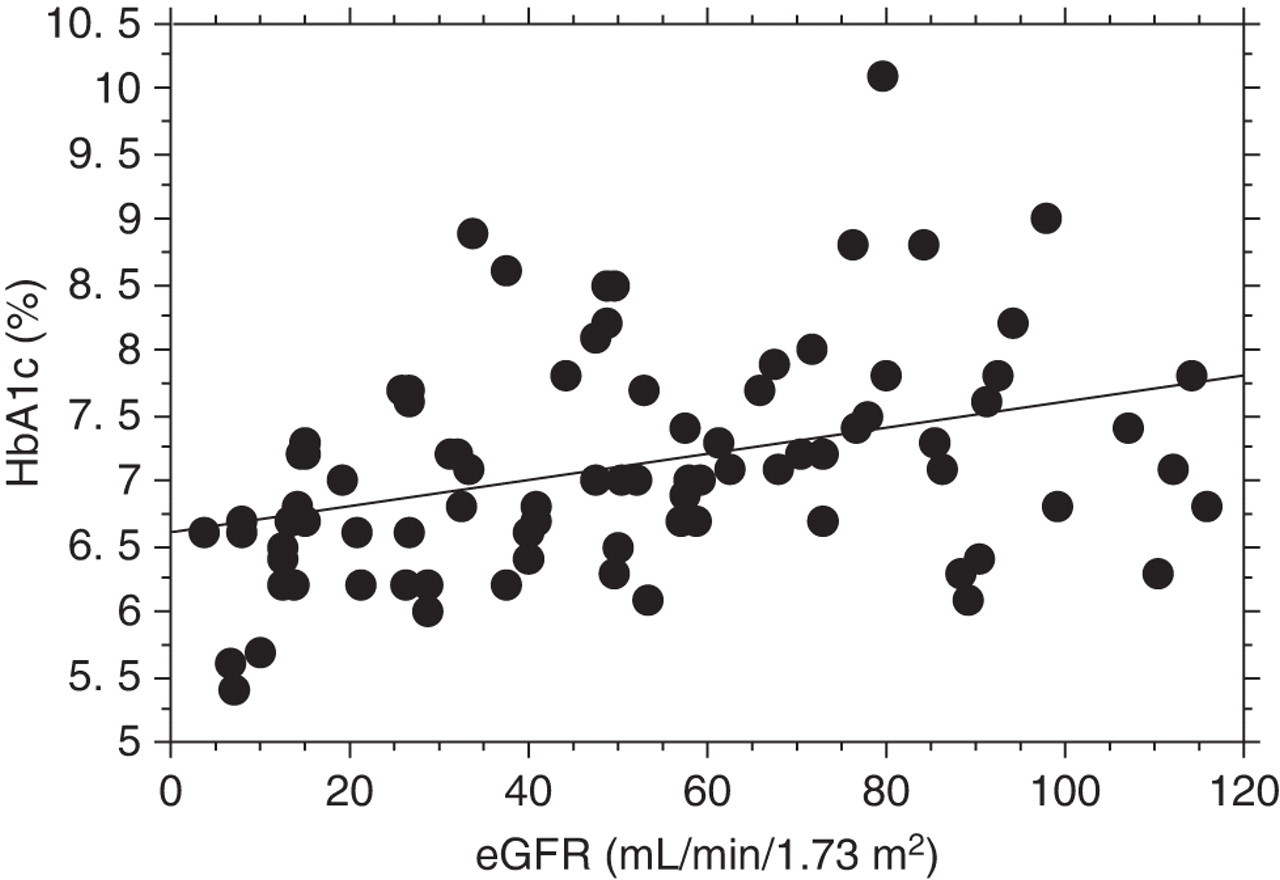
The final multiple regression model contained nine independent variables (eGFR, CKD stage, GA, postprandial glucose, RBC lifespan, urinary protein, diabetes duration, type of treatment for diabetes and cholinesterase) that were significantly associated with HbA1c, but Hb concentration or ESA treatment were not included, as shown in Table 2.
Discussion
This study showed that HbA1c values were significantly reduced relative to glycaemic control in diabetic patients with stage 4 or 5 CKD compared with diabetic patients without renal dysfunction. However, patients with stage 3 CKD did not show reduced HbA1c values relative to glycaemic control. Glycaemic control was assessed in all four patient groups by the mean postprandial glucose and GA values. Furthermore, to eliminate the influence of differences in glycaemic control among the four groups on HbA1c values, we selected patients with similar postprandial glucose and GA values so that the four groups were matched for glycaemic control. GA values in our Groups 3 and 4 (CKD stage 4 and 5, respectively) were apparently lower than those in Group 1, although the difference was not statistically significant. Okada et al. 14 reported that nephrotic-range proteinuria (≥3.5 g/d) decreased GA values probably due to rapid albumin turnover; however, non-nephrotic range proteinuria ( < 3.5 g/d) did not significantly influence GA values. As shown in Table 1, urinary protein outputs were higher in Groups 3 and 4 compared with that in Group 1, and serum albumin concentrations in Groups 3 and 4 were lower than that in Group 1. This may be responsible for the apparent lower concentrations of GA in Groups 3 and 4, although no significant correlation between GA and serum albumin concentrations in these groups was observed (data not shown). Based on these results, it is reasonable to assume that the slightly but not significantly lower values of GA in Groups 3 and 4 might have been affected by factors associated with albumin turnover independent of glycaemic control.
Since glycaemic control was matched, the lower HbA1c values in diabetic patients with stage 4 or 5 CKD were not due to differences in the severity of diabetes, but rather due to other factors such as renal dysfunction unrelated to glycaemic control. These findings indicate that diabetic patients with ESRD have spuriously low concentrations of HbA1c, which might lead to the underestimation or misdiagnosis of their diabetic condition.
Recently, Koga et al. 9 reported GA/HbA1c ratios in diabetic patients with various nephropathic stages. However, we cannot directly compare our HbA1c values in patients with various CKD stages with theirs, because their classification of nephropathy was different from ours. In addition, our patients were divided according to their eGFR, whereas their patients were divided according to their urinary protein outputs and serum creatinine concentrations. Furthermore, our CKD stage 5 patients were not on haemodialysis, whereas their diabetic nephropathy stage 5 patients all underwent haemodialysis. Finally, there was a difference in the index of glycaemic control between the two studies: we employed HbA1c values but they used the GA/HbA1c ratio without showing any individual HbA1c values.
Nakao et al. 15 reported that ESA treatment decreased HbA1c concentrations without significant changes in blood glucose in patients undergoing maintenance haemodialysis. In contrast to their findings, we could not find any difference in HbA1c values between the patients treated with and without ESA. The mean weekly dose of ESA was 4000 ± 2057 U in our subjects, whereas 8400 ± 1265 U was given to their patients who showed significant changes in HbA1c values. Some of their patients who received a smaller dose of ESA (5100 ± 823 U) showed a negligible change in HbA1c concentrations after the study period. These findings suggest that the dose of ESA in our subjects was not sufficient to cause an increase in haematocrit and thereby changes in HbA1c.
In contrast to Koga et al.'s 9 findings that showed lower HbA1c concentrations in anaemic patients, no difference in HbA1c values was observed between the patients with and without ESA treatment, although Hb concentrations were lower in the ESA-treated group. As shown in Table 2, we could not find any association of HbA1c values with Hb concentration in our subjects. In patients with renal failure treated with an inadequate dose of ESA, a low concentration of Hb might not stimulate haemogenesis sufficiently to increase young erythrocytes, resulting in a decrease in HbA1c concentrations.
HbA1c is the product of the chemical condensation of haemoglobin and glucose. Biosynthetic studies in vivo indicate that HbA1c is formed slowly, continuously and irreversibly throughout the lifespan of the RBC. Thus, the concentration of HbA1c reflects the glucose concentrations in blood due to glycation of both newly formed and older RBCs. The glycation rate of newly formed RBCs has been shown to be lower than that of older RBCs. 16,17 If the RBC lifespan is shortened, HbA1c values will be decreased due to an increased ratio of new to old erythrocytes and to a shortened exposure of erythrocytes to glucose in peripheral blood. This suggests that the lifespan of erythrocytes in peripheral blood could be an important determinant of HbA1c concentrations in addition to blood glucose concentration. 18
It is reasonable to assume, therefore, that a significantly shorter lifespan of erythrocytes occurred in Groups 3 and 4, which accounted for their lower HbA1c concentrations compared with Group 1. The mean RBC lifespan was shorter in patients treated with than without ESA, although the difference in mean RBC lifespan between the two groups was not statistically significant. The mean HbA1c value should have been lower in the ESA group, but this was not observed. At the present time, we do not have an adequate explanation for these results. A further study is needed to address this issue.
A decrease in the lifespan of erythrocytes has been shown to be one of the contributory factors to anaemia in patients with chronic renal failure, probably caused by the toxic uremic milieu. 19 Other factors that are associated with anaemia in uremic patients include inflammation, 20 parathyroid hormone 21 and erythropoietin. 22 A 30–70% reduction in RBC lifespan in renal failure has been reported using radioactive tracers to measure RBC lifespan. 23–25 In contrast, a simple and rapid technique based on the concentration of CO in expired air was used to quantify erythrocyte survival in this study. This method produces results that are comparable to the results obtained with more complicated methods. 26,27 When applied to patients with type 2 diabetes, the CO method has shown a mean erythrocyte survival of 112 ± 25 d. 28
We recognize that our study has several limitations. This was a cross-sectional study, and the sample size was relatively small, particularly in Groups 3 and 4. However, even with this small sample size, a significant difference in HbA1c and RBC lifespan was observed between diabetic patients with and without ESRD. To our knowledge, there is no previous information on RBC survival in patients with chronic renal failure using this simple method. Thus, further research will be necessary to confirm these initial results.
In summary, this study demonstrated that diabetic patients with stage 4 or 5 CKD who were not on haemodialysis showed significantly lower values of HbA1c and shorter RBC lifespan compared with diabetic patients without renal dysfunction. These results suggest that the spuriously lower concentration of HbA1c observed in the patients with ESRD was caused by the shorter RBC lifespan. Based on these results, the HbA1c concentrations should not be used alone to diagnose the presence or severity of diabetes in patients with ESRD.
DECLARATIONS