
Abstract
Flow cytometry has had an impact upon all areas of clinical pathology and now, in the 21st century, it is truly coming of age. This study reviews the application of flow cytometry within clinical pathology with an emphasis upon haematology and immunology. The basic principles of flow cytometry are discussed, including the principles and considerations of the flow-cell and hydrodynamic focusing, detector layout and function, use of fluorochromes and multicolour flow cytometry (spectral overlap and colour compensation), alongside the strategies available for sample preparation, data acquisition and analysis, reporting of results, internal quality control, external quality assessment and flow sorting. The practice of flow cytometry is discussed, including the principles and pitfalls associated with leukocyte immunophenotyping for leukaemia and lymphoma diagnosis, immune deficiency, predicting and monitoring response to monoclonal antibody therapy, rare event detection and screening for genetic disease. Each section is illustrated with a case study. Future directions are also discussed.
Introduction
Flow cytometry, immunophenotyping, cell markers and fluorescence-activated cell sorting, although in truth having subtly different meanings, are often used interchangeably to describe the measurement of particles in a fluid stream with the aim of gathering information of clinical importance.
Peripheral blood cells are a common target for investigation, but flow cytometry is by no means limited to this, and bone marrow, cerebrospinal fluid (CSF), pleural fluid, platelets, microbes, DNA, soluble antigens and even solid tissues when rendered particulate are just some of the many other specimens that are of interest in the clinical setting.
Flow cytometry, as we know it today, was first developed at Stanford University, California, in the late 1960s 1 and found its first true clinical acceptance in the management of patients with the human immunodeficiency virus (HIV) far back in the early 1980s, when its use was primarily to assist in the diagnosis of acquired immunodeficiency syndrome before HIV was discovered to be the causative agent. 2 Today, the use of multiparameter flow cytometry in unravelling the complexities of the immune system in health and in diseases such as HIV is a growing area of research. 3,4
The impact of flow cytometry has been tremendous within clinical pathology, having revolutionized haematology and immunology departments, becoming a well-established part of the modern laboratory repertoire and a frontline component of modern leukaemia diagnosis. 5,6
There are few single disease-specific markers available to flow cytometry, but part of its great success has been through using a range of fluorescently labelled antibodies, allowing the identification of patterns and intensity of antigen expression on cells that are abnormal. These markers are not confined solely to ‘surface’ antigen detection as they can be directed with similar ease towards cytoplasmic and nuclear antigens to derive qualitative, quantitative and functional information.
The growing acceptance of flow cytometry within pathology has, in many ways, been due to its relative ease of use and the sheer number of cells, or ‘events’ that can be measured. Counting tens or hundreds of thousands of cells for multiple parameters at a rate of a thousand or more cells per second leaves it in a unique position unrivalled by any other technology.
Principles of flow cytometry
The flow-cell and hydrodynamic focusing
Flow cytometry relies upon the interrogation of particles of interest, or ‘events’ as they are commonly termed within a fluid stream, by one or more laser beams, and the recording of this information by a series of detectors. A flow-cell is central to this and forms part of the ‘fluidics’ system of a flow cytometer. The flow-cell is a small solid cuvette, usually of quartz of very high optical quality, through which a narrow capillary channel has been created. In order to derive meaningful data, the particles, such as blood cells, need to pass through this channel in single-cell file. The laser light cannot accurately resolve multiple events arriving simultaneously or clumps of cells. A process known as hydrodynamic focusing is used to achieve the desired flow through the flow-cell. The fluidics system of a flow cytometer adopts a process called laminar flow to control the flow rate of an isotonic ‘sheath’ fluid relative to the cell sample, ensuring the accurate delivery of cells or other particles of interest through the flow-cell, in effect ‘focusing’ the cells into a single-file stream prior to analysis.
Detector layout and function
Cells, or any other particles illuminated by laser light, cause the light to scatter. Two scatter parameters are measured: forward scatter (FSC) and side scatter (SSC). FSC is a measure of cell size, e.g. lymphocytes are smaller than monocytes and granulocytes (although, for example, the ‘hairy cells’ found in hairy cell leukaemia appear larger than normal lymphocytes as their villous projections increase the FSC). SSC is measured at an angle of 90° to the FSC, and is a measure of cellular granularity and nuclear complexity/lobularity. For this reason, monocytes and granulocytes have a higher SSC than lymphocytes (Figure 1).
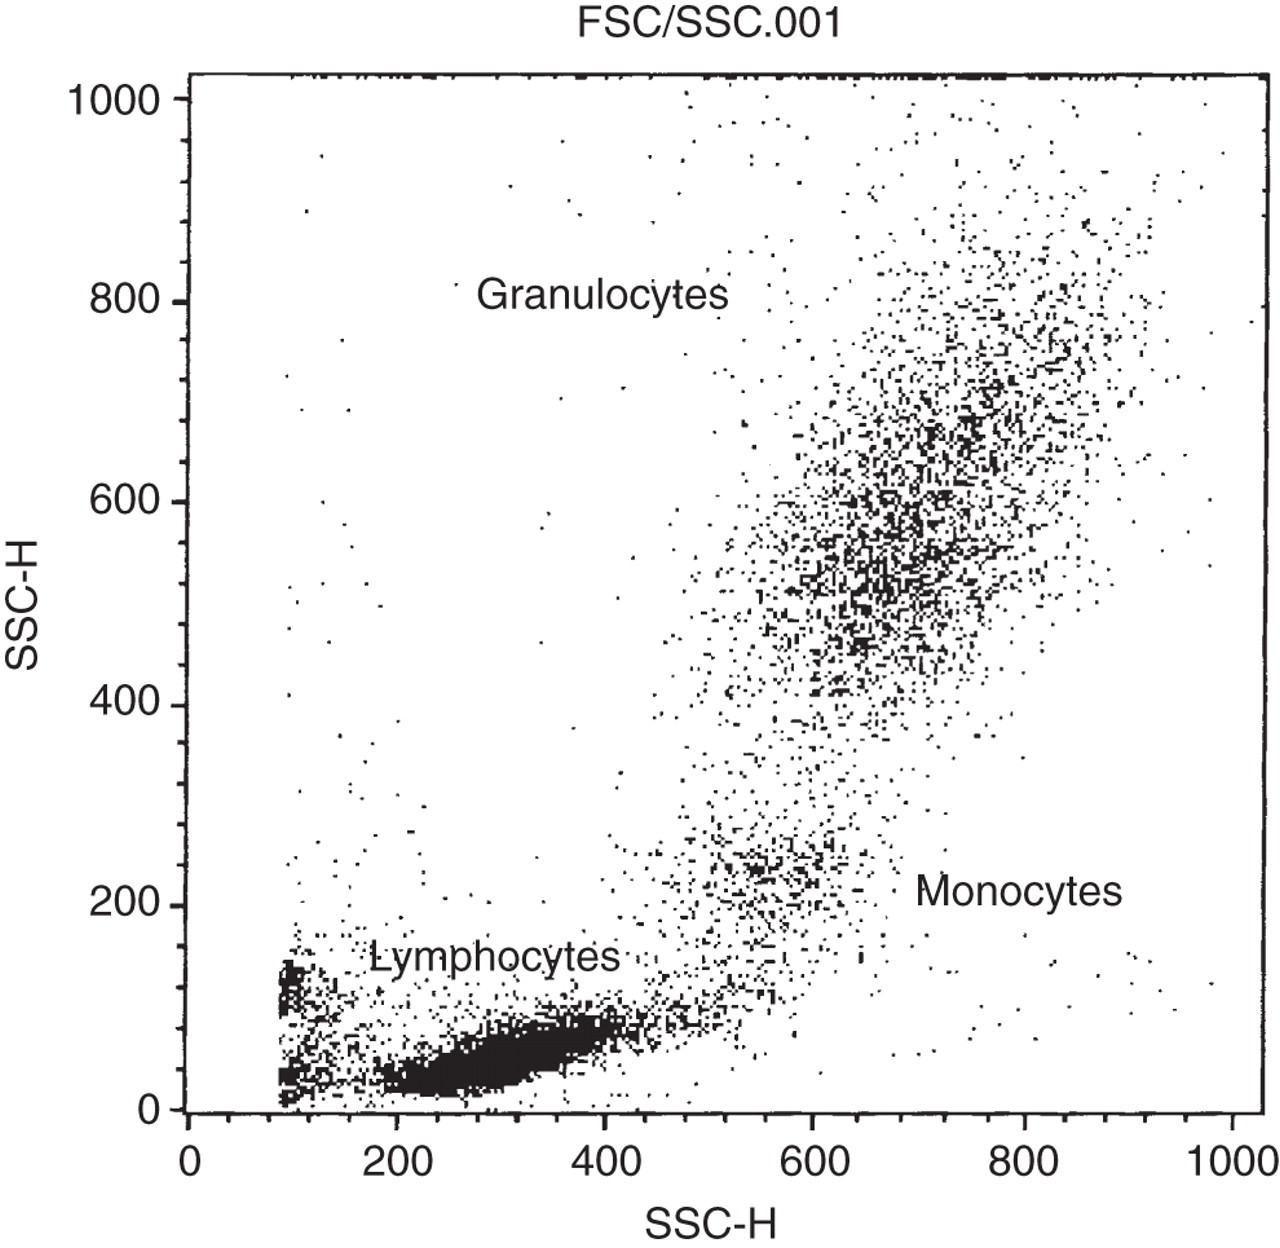
Typical forward scatter/side scatter (FSC/SSC) dot-plot. In this particular case of chronic lymphocytic leukaemia, the lymphocyte cloud is denser than the monocytes and granulocytes. Each are seen as discrete populations allowing easy selection of the cells of interest for acquisition and analysis – a process known as ‘gating’
Antibodies labelled with a fluorochrome will also fluoresce when exposed to laser light (see ‘Use of fluorochromes’ below). A number of fluorescence detectors are utilized to detect the presence of fluorescing antibodies that have bound to antigens of interest on cells passing through the flow-cell. Commonly, four detectors (referred to as FL1, FL2, FL3 and FL4, respectively) are used, but increasingly more are becoming commercially available. 3,4
A series of filters, mirrors, lenses and beam splitters are used to guide both the scattered and fluorescent light to the appropriate detector and, alongside the laser(s), comprise the optical system of a flow cytometer (Figure 2).
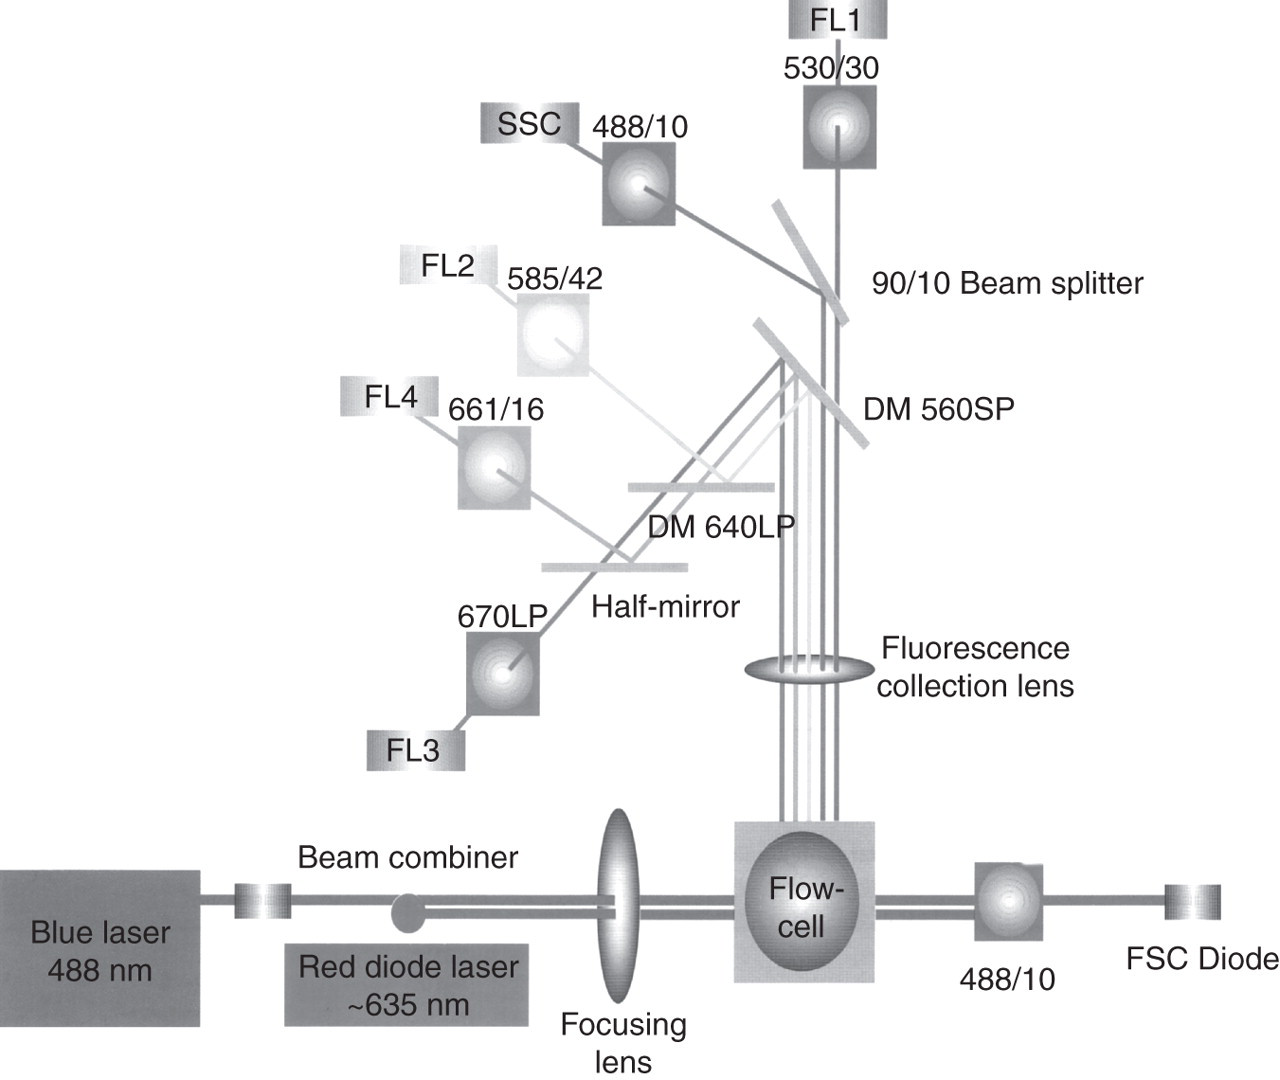
Detector layout of a Becton Dickinson four-colour FACSCalibur™ flow cytometer. Two lasers, a flow-cell and a sophisticated arrangement of lenses, filters, short-pass and long-pass dichroic mirrors, half-mirrors, a beam splitter and scatter and fluorescence detectors are used. Reproduced with permission courtesy and © Becton, Dickinson and Company
Use of fluorochromes
The power of flow cytometry comes from the ability to couple the light scatter information with fluorescence information, i.e. to assay distinct cell populations stained with monoclonal antibodies that have been conjugated to a fluorescent dye molecule.
A number of common fluorescent dye molecules are used such as fluorescein isothiocyanate (FITC), phycoerythrin (PE), peridinin-chlorophyll-protein (PerCP) and allophycocyanin (APC). When laser light excites the dye molecule, the dye in turn emits light at a different (longer) wavelength (Table 1). FITC (FL1), PE (FL2) and PerCP (FL3) all achieve optimal excitation at the same 488 nm wavelength and yet each emit at a different wavelength. This means that for these three fluorochromes only one laser is required, typically an argon 488 nm (blue) laser. APC (FL4) is not excited at 488 nm and so a second laser is required to achieve excitation of this molecule, typically a 635-nm laser diode (red).
Examples of commonly used fluorochromes within clinical pathology
FTIC, fluorescein isothiocyanate; PE, phycoerythrin; PerCP, peridinin-chlorophyll-protein; APC, allophycocyanin
The evolution and success of flow cytometry have progressed hand in hand with the commercial development of monoclonal antibodies. Antibodies directed against a common antigen are assigned a ‘cluster of differentiation’ (CD) number and currently there are well in excess of 300 of these. 7 Not all antibodies used within pathology are assigned to the CD nomenclature; for example, FMC7 is a B-cell marker commonly used in the diagnosis of lymphoproliferative disease, although it has recently been shown to be an epitope of CD20. 8
A vast number of monoclonal antibodies are available that are directed towards surface, cytoplasmic and nuclear antigens, conjugated with a wide variety of fluorochromes, many of which are utilized for diagnostic purposes. Although often measured in isolation, the simultaneous flow cytometric analysis of surface and intracellular antigens is a powerful diagnostic tool.
DNA-binding dyes such as propidium iodide or 7-amino-actinomycin D 9 can be used for cell viability studies and for studying mechanisms of apoptosis (programmed cell death) as both of these dyes are excluded by living cells, while dead or apoptotic cells will take up the dye and fluoresce. Identification and exclusion of dead cells are important considerations if receiving samples from outside laboratories when sample transportation incurs a delay in analysis. 10,11 Loss of membrane integrity will alter the staining characteristics of cells due to changes in antigen expression, and non-specific uptake of antibodies will cause increased background fluorescence. Assessment of cell viability has clinical relevance in certain cases, for example, the assessment of the engraftment potential of CD34-positive haematopoietic stem cell transplants. 12
Multicolour flow cytometry, spectral overlap and colour compensation
Fluorescence detectors are photomultiplier tubes (PMT) which serve to amplify the small light signal from cells being illuminated by a laser, into an electronic signal. The PMTs form part of the electronics system of a flow cytometer which is responsible for communicating the scatter and fluorescence data in a digital format to a computer for analysis.
The emission spectra of different fluorochromes tend to overlap to varying degrees, meaning, for example, that a proportion of FITC (FL1) fluorescence will spill over into the PE (FL2) channel and be detected by the FL2 PMT as ‘PE’ fluorescence, and vice versa. As more fluorescent antibodies are employed upon a single cell, the problem of spectral overlap becomes a significant issue. Fortunately, it is possible to use a process called colour compensation that allows the operator (or software) to electronically subtract the spillover from each fluorescence channel and thus improve the accuracy of any results obtained, although the procedure becomes increasingly complex as more colours are added. 13–15
Most routine flow cytometry carried out within pathology is at least two-coloured (two separate antigens are stained simultaneously on the same cell, for example, CD5/CD19 in chronic lymphocytic leukaemia [CLL]), much is four-coloured (four separate antigens are detectable in a single tube, for example, CD3/4/8/45 in HIV patients), and beyond (e.g. six colours in minimal residual disease [MRD] detection). Spectral overlap, correction for it, and the inevitable trade-offs in sensitivity and specificity that result are an essential consideration for any modern flow cytometric assay (Figure 3).
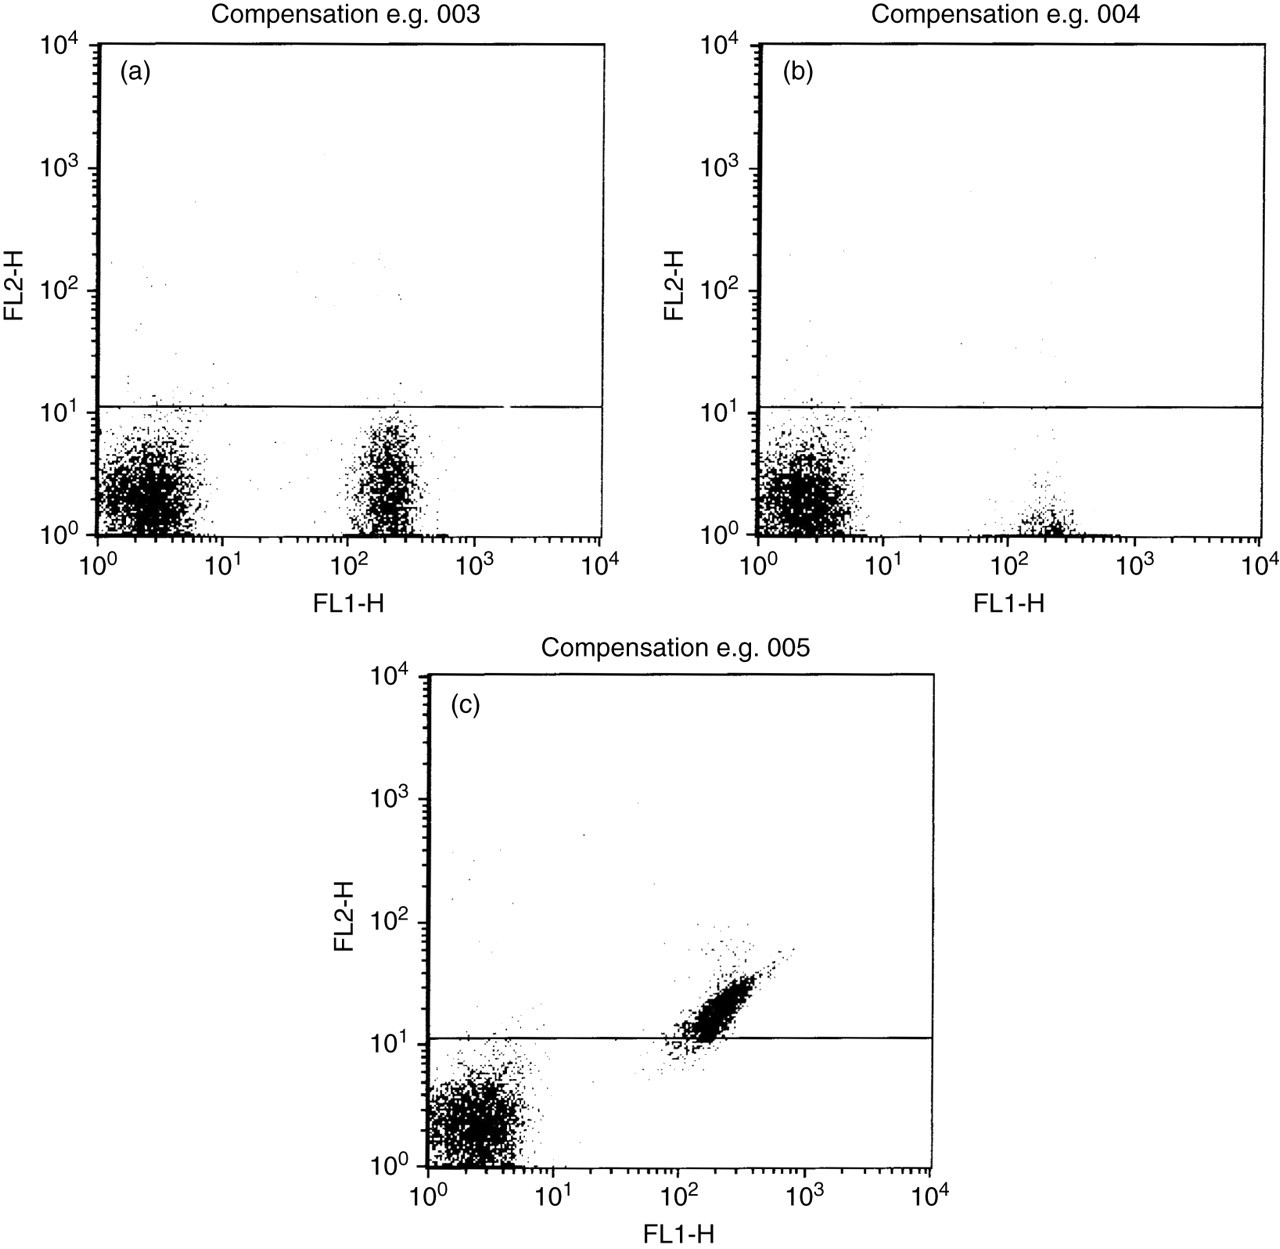
Spectral overlap and fluorescence compensation. (a) Shows correct compensation settings for cells stained with an fluorescein isothiocyanate-conjugated antibody detected via the FL1 detector – the cells on the lower right are at the same intensity as the unstained population on the lower left. (b) Shows overcompensation whereby the cells on the lower right appear ‘squashed’ and are difficult to visualize. (c) Shows undercompensation whereby the FL1 fluorescent cells are spilling up into the FL2 channel
Sample preparation, data acquisition and analysis strategies
Cells of interest can be separated from the patient sample prior to the addition of monoclonal antibodies, and this is especially useful for purifying lymphocytes from blood or bone marrow in cases of suspected leukaemia or lymphoma. Lymphoprep™ (Axis-Shield, Oslo, Norway) is a solution consisting of sodium diatrizoate and polysaccharide with a density of 1.077 g/mL that allows cell separation by a process of density gradient centrifugation. Separation of cells in this manner has given way increasingly to lysed whole blood techniques. Whole blood or bone marrow aliquots are stained with the appropriate monoclonal antibodies and incubated for a predetermined period. The red blood cells are then removed by the addition of a lysing agent to leave the leukocytes intact for acquisition. Use of the latter approach is less labour intensive and reduces the chances of cell loss (especially if no wash steps are included, so-called ‘lyse-no-wash’ assays, essential for quantitative assays such as CD4 and CD34 enumeration).
Strategies for data acquisition include using FSC/SSC plots to allow the initial identification of cells of interest (a process called ‘gating’), then expressing the results on an FL1/FL2 fluorescence plot (or combination of such plots if more colours have been used), and is the commonest approach for gating discrete cell populations (Figure 1). Gating is an important concept within flow cytometry – a ‘gated’ population of cells refers to a specific fraction of the total cells present in the sample chosen by the operator for acquisition and/or analysis. In many instances, the antigen expression being investigated is only relevant to one cell type, for example, lymphocytes, neutrophils or platelets, etc. In these instances, analysis of all of the different cell types present is not required and would render data interpretation difficult. Acquisition of ‘ungated’ data would be appropriate in cases of homogenous cell type, for example, all blasts in a case of acute leukaemia, or for exploratory work in cases where there are multiple cell populations that are of interest.
As FSC and SSC parameters provide an approximation of cellular morphology in terms of size and internal structure, this can be useful in its own right as characteristic FSC/SSC combinations are sometimes seen, for example, in acute promyelocytic leukaemia.
A second gating approach is to use a CD45/SSC plot which makes use of the fact that CD45 (a pan-leukocyte antigen) is expressed to varying intensities on different haematopoietic cells, and often dimly on early precursor cells (blasts). This approach is particularly useful if a small population of mononuclear blasts are suspected to be present, which have the same FSC/SSC characteristics as lymphocytes, and would otherwise be difficult to distinguish by FSC/SSC alone (Figure 4). Similarly, large granular lymphocytes, often seen in HIV-infected patients, may lie outside of the normal ‘lymphocyte’ region and be missed when using FSC/SSC, and yet would fall within the expected area when using CD45/SSC gating. The latter approach is one of those recommended for CD4-positive T-cell enumeration in HIV by the British Committee for Standardization in Haematology. 16
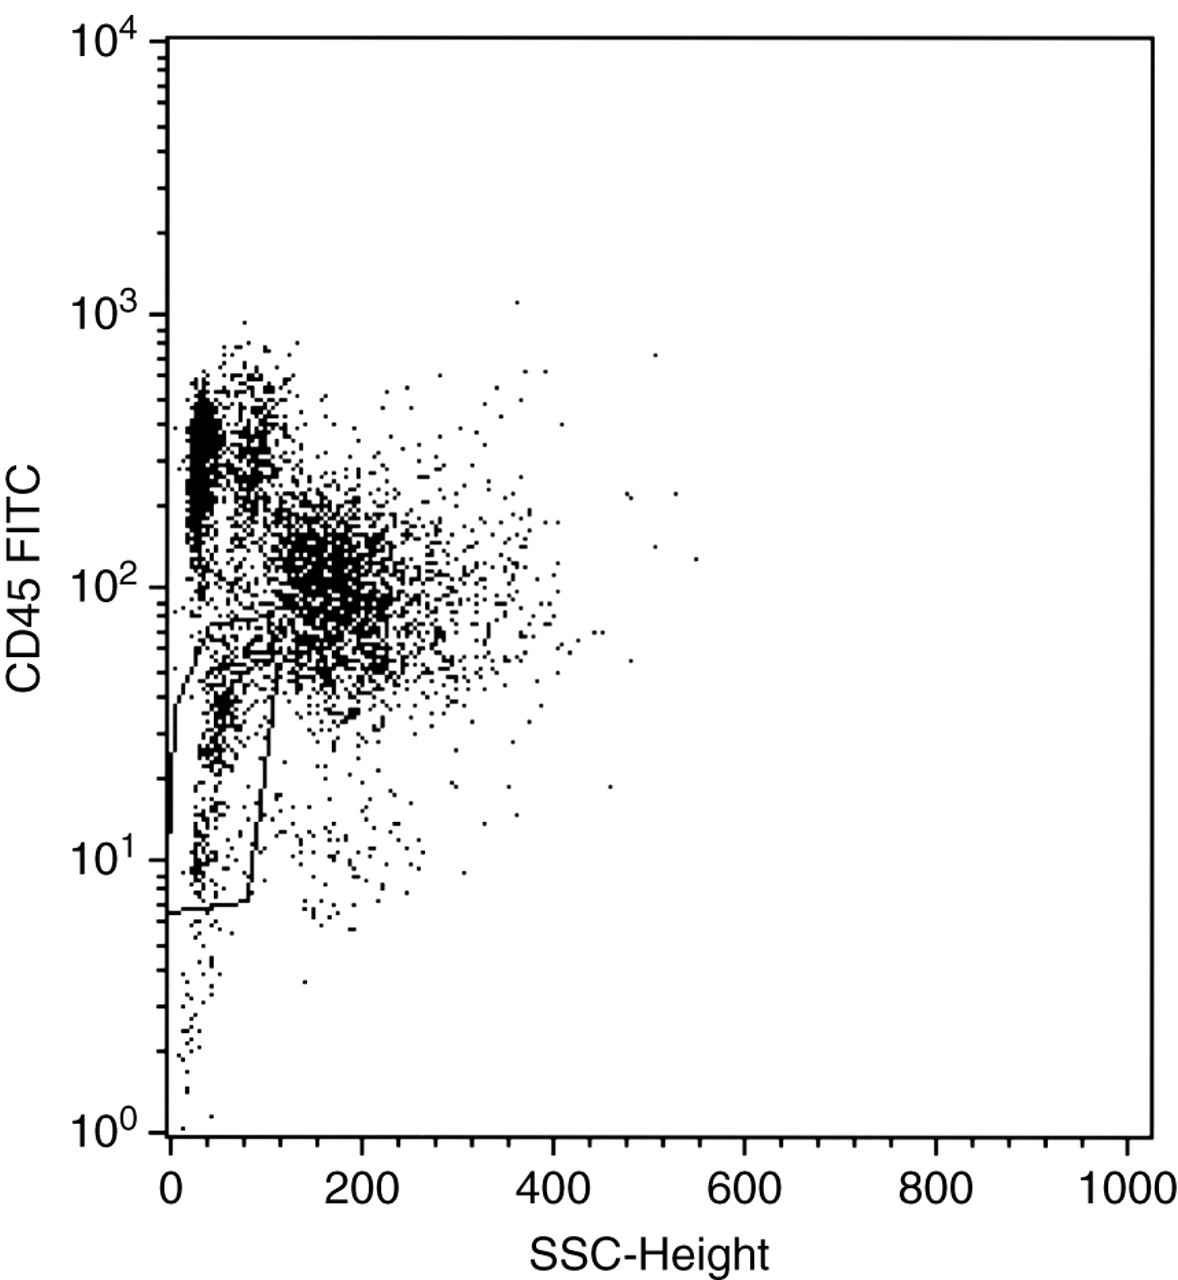
An example of a CD45/SSC dot-plot. A small population of blasts are visible (gated R2) that are CD45dim, in comparison with normal CD45bright lymphocytes above it. The gated cells can be analysed for abnormal patterns of antigen expression commonly seen in acute leukaemias. SSC, side scatter; FITC, fluorescein isothiocyanate
The process of ‘back-gating’ is another valuable approach when it is not known where the cells of interest lie on an FSC/SSC plot. Gating first on the fluorescence parameter for the antigen(s) of interest and then translating this back onto the ungated FSC/SSC plot can be used to identify the population of interest.
Lineage gating allows the collection of cells for analysis by selecting only those that express the antigen of interest. For example, staining lymphocytes for CD19 (a B-cell marker) expression would allow the identification of B-cells from within the total lymphocyte population if these were the only cells required, e.g. in a case of suspected CLL. Relying upon scatter parameters alone would not permit this ability as T, B and natural killer (NK) cells have the same FSC/SSC and CD45/SSC characteristics. Lineage gating can also be combined with a scatter gate to further enhance assay specificity.
Sequential gating systems are also popular in certain applications, especially in quantitative settings where unwanted cell populations and debris would compromise the accuracy of the result. This approach is much more complex, making use of numerous logic rules whereby information from one ‘gate’ is fed into another, and so on. A good example of this approach is the International Society for Hematopoietic and Graft Engineering (ISHAGE) protocol for CD34 (haematopoietic stem cell) enumeration. 17
Reporting results
Flow cytometer data can be expressed graphically in the form of histograms, dot plots, contour plots and density plots on linear and/or logarithmic scales. Each has their advantages and disadvantages, although dot plots are often the method of choice. Results can be expressed in many forms including simple percentage positivity, mean fluorescent intensity, ratios, cells/μL, molecules of equivalent soluble fluorochrome, antibody binding capacity and antibodies bound per cell. 18,19 Each has an analytical role dependent upon whether the required result is qualitative or quantitative.
Percentage positivity and intensity of fluorescence are common approaches often combined for qualitative work to determine values relative to ‘normal’ patterns of antigen expression. Defining a cut-off for positivity varies according to the sensitivity and specificity required from the assay – commonly >20% in acute leukaemias and >30% in chronic lymphoproliferative disorders are used to denote a positive result. 20 In contrast, values of <1% are considered ‘positive’ for paroxysmal nocturnal haemoglobinuria (PNH) clone detection.
Quantitative flow cytometry delivers an accurate and precise numerical value either for the number of cells expressing the antigen(s) of interest, and/or the antigen density upon individual cells. Reporting of quantitative values has found important therapeutic applications in monitoring CD4+ T-cell levels in HIV-positive patients, 16 using CD34+ (note: the superscript ‘+’ denotes that the cell expresses that antigen) cell counts for predicting harvest yield in haematopoietic stem-cell transplantation, 21 evaluating neutrophil CD64 expression in sepsis 22 and foetomaternal haemorrhage quantitation. 23 Although ‘broad-brush’ quantitative leukaemia panels are yet to find a role, quantitation has been shown to be of value in specific prognostic situations such as CD38 and ZAP-70 expression in CLL. 24,25
Internal quality control, external quality assessment
Provision of a clinical flow cytometry service requires rigorous internal quality control (IQC) and participation in external quality assessment (EQA). Specific details vary according to the nature of the assay. General requirements are to ensure that the instrument itself (optics, fluidics and electronics) is set up appropriately and is commonly checked using commercially available, fluorescently labelled beads such as Calibrite™ beads (BD Biosciences, San Jose, CA, USA). Samples known to be positive or negative for antigens of interest can be utilized to ensure that the monoclonal antibodies being used within assays are reacting as expected and commercial cell suspensions are available for some applications such as CD4 and CD34 enumeration. Compensation for spectral overlap and titration of antibodies to determine optimum concentration are required for any new assays introduced into the laboratory and following any changes to the instrument or in the antibody manufacturer.
Cell counts should be performed to ensure that the latter are within the performance specification of the assay and the sample should be diluted to attain this. Antibody excess is required to ensure that a weak or negative result is not due to insufficient antibody concentration.
Manufacturer-recommended protocols for daily, weekly and monthly maintenance should be adhered to, and the instrument should be on a service contract with scheduled preventive maintenance visits.
IQC must be recorded alongside records of staff training. Increasingly, document control systems are used to facilitate the distribution and review of standard operating procedures and allied documentation. 10,11,26,27
Participation in EQA is a requirement of Clinical Pathology Accreditation (UK) Ltd (CPA) for the accreditation of clinical pathology services within the UK. EQA schemes such as the National External Quality Assessment Scheme distribute stabilized samples to laboratories for analysis, sometimes coupled with clinical and morphological data, and other information to mimic the diagnostic process more closely. As per the majority of EQA schemes, performance reports are issued and persistent unsatisfactory performance is notified to departmental directors and support offered to remedy any difficulties.
Flow sorting
A further feature of certain flow cytometers is their capability to physically sort cells that have passed through the flow-cell, thus allowing cells with the desired parameters to be selected from heterogeneous mixtures for further studies rather than simply go to waste, for example, CD34-positive haematopoietic stem cells. Purity of the selected fraction is usually well in excess of 95%. Flow cytometers that can do this are usually purpose-built ‘sorters’ designed for the task, although some modified bench top machines can be supplied with varying degrees of sorting capability, although they tend to be slower. Flow sorters are more complex than standard flow cytometers and different practical considerations are required to achieve success. 28,29 Utilizing the principles of ink-jet technology, a frequency is applied to the fluid/cell stream passing through the flow-cell in order to cause the formation of droplets upon exit. Droplets containing cells that meet prescribed scatter and/or fluorescence selection criteria have an electrical charge applied to them and are then deflected by high-voltage plates into a collection tube or microplate. By changing the polarity of the charge upon the droplets or even by applying differential voltages to the droplets as well, multiple selection criteria can be set up and consequently several different cell fractions can be collected.
For further detailed information on the principles of flow cytometry, readers are referred to several excellent publications. 30–33
Leukaemia diagnosis
Principle
Leukaemia is a malignant proliferation of haematopoietic cells and can be broadly split into chronic and acute leukaemia. These terms relate to the progress of the disease untreated, acute leukaemia having relatively short survival without therapy while chronic leukaemia has a longer survival without therapy. While morphological appearance of the cells may suggest the diagnosis, immunophenotyping and genetic analysis of the cells are required to optimally identify the type of leukaemia. 34 Separate panels of monoclonal antibodies are defined for immunophenotyping chronic and acute leukaemia. 20 The pattern of reactivity of the panel of antibodies will help define cell type and stage of differentiation. Defining the type of leukaemia using the three modalities described allows the optimal treatment regimen to be defined and may indicate the prognosis of the disease. 34
Case study
A four-year-old female presents to her general practitioner. The parents report that she has been lethargic for three weeks without clear cause. On examination she is noted to have petechiae on her arms and legs. A full blood count is requested and shows a low platelet count. Examination of a blood film shows an occasional immature cell (blast). She is referred to a paediatric haematologist and a bone marrow is performed. A bone marrow slide is stained and examined by light microscopy. A large population of small blasts with scanty cytoplasm is identified. Further samples of anticoagulated bone marrow were sent for immunophenotypic and genetic assessment.
Flow cytometry
Flow cytometry panels were performed based on the presumptive diagnosis of acute leukaemia. These were composed of the following antibodies:
CD2 (pan T-cell) and CD7 (pan T-cell); CD10 (precursor B-cells) and CD19 (pan B-cells); CD33 (myeloid cells) and CD45 (pan leukocyte); Cytoplasmic CD3 (pan T-cells), cytoplasmic CD79a (pan B-cells) and cytoplasmic myeloperoxidase (pan myeloid cells).
The graphical displays from the flow cytometer are shown in Figure 5.
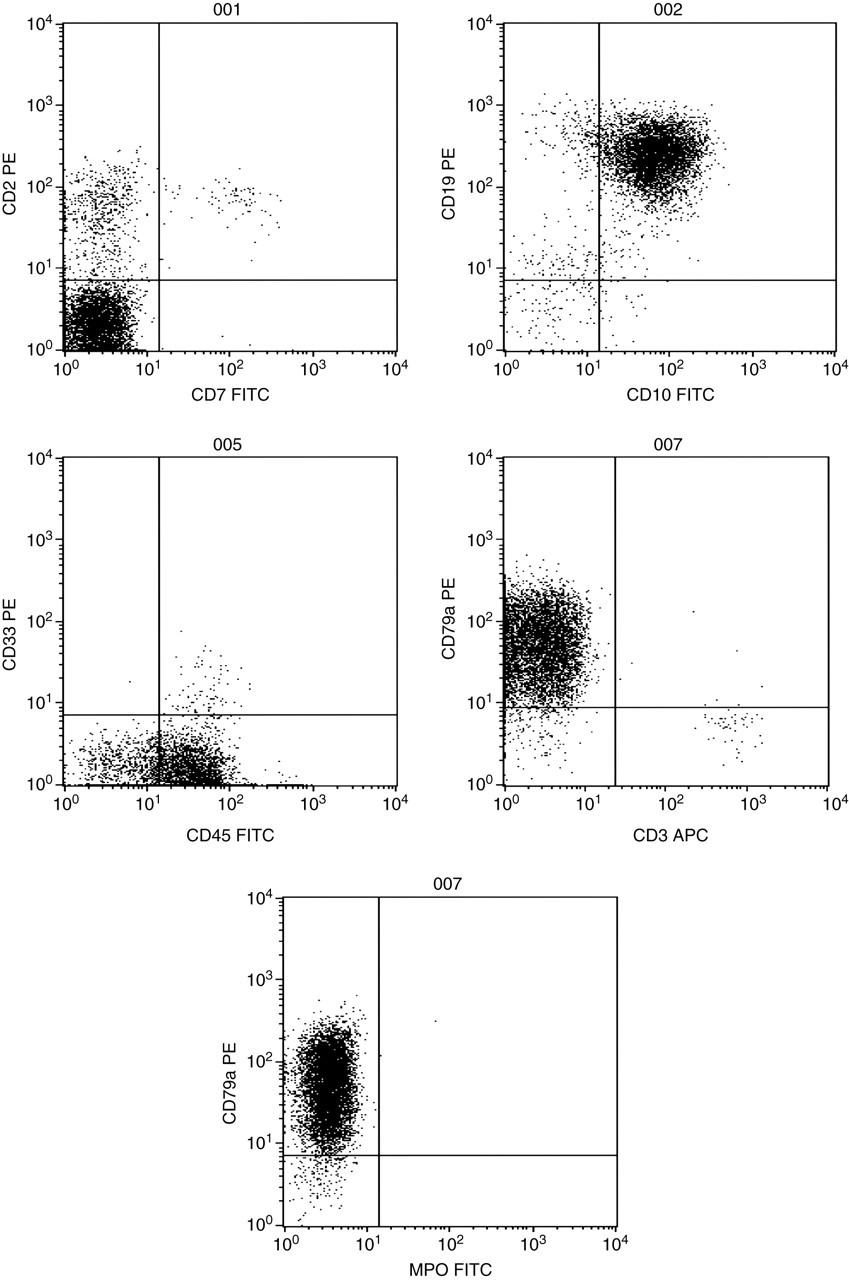
Flow cytometer dot-plots from a case of precursor B-cell acute lymphoblastic leukaemia. FITC, fluorescein isothiocyanate; PE, phycoerythrin; APC, allophycocyanin; MPO, myeloperoxidase
Interpretation
The cells were positive (>20% expression) for CD19, CD10 and cytoplasmic CD79a. All other markers were negative. In conjunction with the morphological assessment, the data support a diagnosis of precursor B-cell acute lymphoblastic leukaemia (ALL). Genetic analysis showed a normal female karyotype. Interpretation of leukaemia immunophenotyping data can be hampered by the expression of non-lineage markers in a proportion of cases of acute leukaemia, e.g. the expression of CD13 in a case of B precursor ALL. This aberrant expression is thought to be part of the malignant process but does not reflect a different disorder from a case without aberrant expression. The specificity of different markers in the assignment of lineage is recognized in a scoring system which allows distinction between leukaemia cases with aberrant expression of a marker from the far rarer cases where two distinct lineages are involved in the leukaemic process (mixed phenotype acute leukaemia). 35
Immune deficiency diagnosis
Principle
Immune deficiency is an impairment of the host's ability to combat infective disease resulting in recurrent infection. These can be bacterial, fungal or viral infections, the infective agent being dependent upon the nature of the deficiency, for example, antibody deficiency resulting in recurrent bacterial infections. The defect may be either primary (i.e. inherited) or secondary to other pathologies. The humoral or the cellular immune system may be affected. Primary immune deficiency is very rare with an estimated overall frequency of one in 10,000 live births. Secondary immune deficiency is more common with causes such as lymphoreticular malignancy, drugs, viruses, nutritional deficiencies or protein loss. 36 The investigation of immune deficiency is directed by clinical presenting features and the infective history.
Defects in the cellular immune system can be either numerical or functional. The main defects described are in lymphocytes and neutrophils. Numbers of neutrophils and lymphocytes are assessed as part of the full blood count and if found to be low may give rise to an immune deficiency. A total lymphocyte count is inadequate to investigate immune deficiency as each of the separate lymphocyte subsets (T-cells, B-cells and NK cells) may contribute to an immune defect. The subsets of lymphocytes are investigated by flow cytometry. It is important that absolute numbers of cells are reported rather than percentages and are compared with appropriate age-matched reference ranges as both the total lymphocyte count and lymphocyte subsets vary considerably with age, particularly in children.
Rare defects are described where the absolute numbers of neutrophils or lymphocytes are normal but the cells are functionally defective. A range of functional assays to investigate the various pathways of immune cells are available (e.g. superoxide pathway for neutrophil killing), some of which can be performed by flow cytometry. 37
Defects in B-cells tend to result in a clinical picture of antibody deficiency. T-cell defects range from a complete absence of T-cells seen in severe combined immune deficiency to numerical deficiencies in a particular T-cell subset, for example, CD4+ T helper cells in HIV infection. In cases of primary immune deficiency where T-cells are absent, low or functionally defective low immunoglobulins may be seen.
Case study
A four-year-old male is referred to the ear, nose and throat department for investigation of recurrent ear infections. As part of the investigation, a full blood count and immunoglobulins are requested. The immunoglobulin results are as follows:
IgG = 0.97 g/L (reference range 5.9–15.5 g/L); IgA = 0.06 g/L (reference range 0.4–2.0 g/L); IgM = 0.08 g/L (reference range 0.5–2.1 g/L).
The immunoglobulins (IgG, IgA and IgM) are all low prompting a referral to an immunologist for investigation of antibody deficiency. The immunoglobulins are repeated and confirmed. Flow cytometry is requested to enumerate T, B and NK cells.
Flow cytometry
Total lymphocyte count = 3.1 × 10⁹/L (normal)
CD3 (total T-cells) = 89%, absolute count 2.76 × 10⁹/L (reference range 1.8–3.0 × 10⁹/L)
CD4 (T helper cells) = 65%, absolute count 2.02 × 10⁹/L (reference range 1.0–1.8 × 10⁹/L)
CD8 (T suppressor/cytotoxic cells) = 24%, absolute count 0.75 × 10⁹/L (reference range 0.8–1.5 × 10⁹/L)
CD19 (B-cells) = <1%, absolute count <0.01 × 10⁹/L (reference range 0.7–1.3 × 10⁹/L)
CD16+CD56+ (NK cells) = 11%, absolute count 0.34 × 10⁹/L (reference range 0.2–0.6 × 10⁹/L)
Interpretation
Hypogammaglobulinaemia and absent B-cells in a male are suggestive of a primary immune deficiency associated with defects in Bruton's tyrosine kinase (Btk). This can be confirmed by Western blotting for Btk protein and genetic analysis. Other causes of absent B-cells with hypogammaglobulinaemia are described. These include thymoma, common variable immune deficiency, related to therapeutic drugs or other rare congenital defects in the B-cell development pathway.
Predicting response to monoclonal antibody therapy
Principle
Humanized monoclonal antibodies have been developed for therapeutic use. These have a range of clinical applications. A proportion of these antibodies are used as part of the treatment protocol for haematological malignancy. 38 These include Rituximab (anti-CD20 present on B-cells; F. Hoffman-La Roche Ltd, Basel, Switzerland), Gemtuzumab (marketed as Mylotarg; Pfizer, New York, NY, USA) (anti-CD33 present on myeloid cells) and Alemtuzumab (also known as Campath; Bayer Pharma AG, Leverkusen, Germany) (anti-CD52 present on lymphoid cells). The antibodies target these proteins on cancer cells, and once bound the cell is removed by the immune system (immunotherapy). Treatment with monoclonal antibodies is costly and, as such, it is common practice to check for presence of the target molecule on the tumour cell prior to commencing treatment.
Case study
A 48 -year-old female with a diagnosis of CLL has had a poor response to first-line chemotherapy. Her clinician has suggested that she would benefit from further treatment with a different chemotherapy regimen including the addition of immunotherapy with Alemtuzumab. Prior to commencing treatment, a peripheral blood sample is sent to the laboratory to assess the expression of CD52 on the patient's tumour cells.
Flow cytometry
The following antibody combination is used:
CD52 (binding site for Alemtuzumab), CD19 (pan B-cells), CD5 (pan T-cells and B CLL cells) and CD3 (pan T-cells).
CLL cells are identified as co-expressing CD5 and CD19. The expression of CD52 is assessed on these cells. The expression of normal T-cells within the sample (CD3-positive) acts as a control confirming the activity of the CD52 antibody. (All normal T-cells highly express CD52).
The graphical display from the flow cytometer is shown in Figure 6.
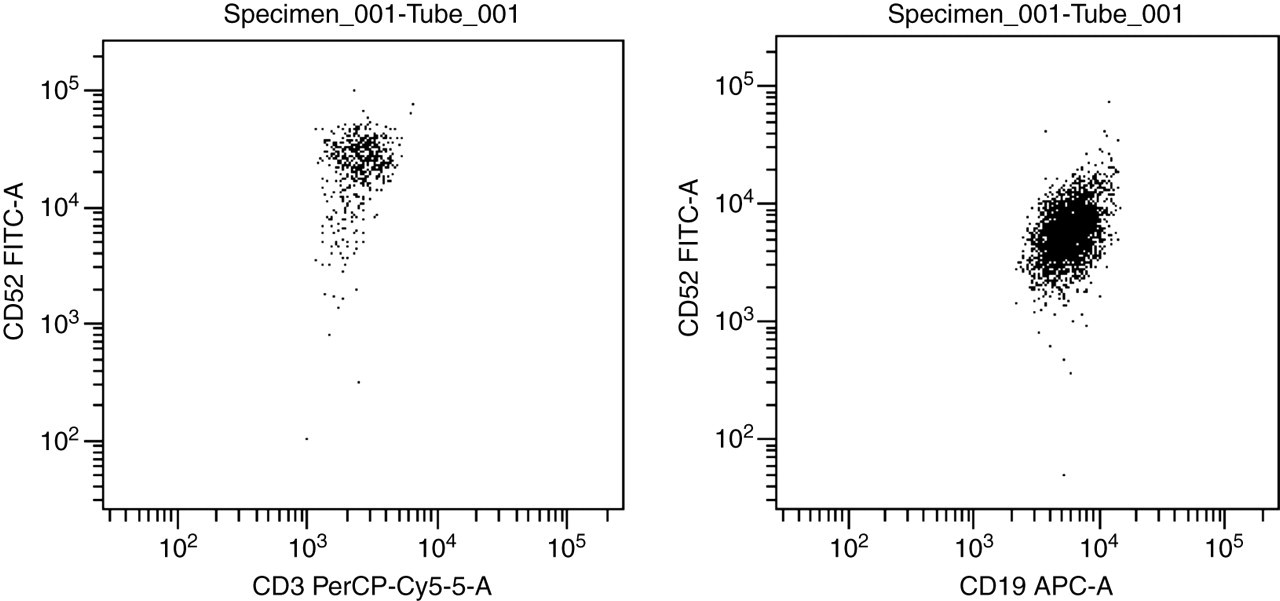
Flow cytometry dot-plots from a case of chronic lymphocytic leukaemia (CLL) showing Campath (CD52) expression on T-cells (CD3+) and CLL cells (CD19+). FITC, fluorescein isothiocyanate; PerCP, peridinin-chlorophyll-protein; APC, allophycocyanin
Interpretation
The malignant cells express CD52. This confirms that it would be reasonable to use Alemtuzumab in this patient.
It should be noted that although the presence of the target molecule on the tumour cells is reassuring, it does not predict response to immunotherapy. 39 Alemtuzumab exhibits a greater cytotoxic effect upon malignant cells than normal T-cells possibly due to altered signaling pathways. 40
Rare event detection
Principle
Modern flow cytometers can analyse cells at speeds of up to 10,000 cells/s. High-speed analysis, when coupled with multicolour staining, can facilitate the detection of cells present at a very low frequency (rare events). Flow cytometric protocols for rare event detection are in routine use to detect residual leukaemic cells after the initiation of therapy (MRD), 41 Rh(D)-positive fetal red cells transferred to an Rh(D)-negative mother across the placenta at birth, 42 estimating the progenitor cell content in bone marrow transplantation, 43 enumeration of contaminating white cells in filtered blood 44 and detection of abnormal red and white blood cells in patients with bone marrow failure disorders (subclinical PNH clone detection). 45
Case study
A 56-year-old male who is being treated for B-cell non-Hodgkin's lymphoma is scheduled to have a peripheral blood stem cell (PBSC) collection following his fourth course of chemotherapy. The stem cells will be stored to allow an autologous PBSC transplant to be performed as part of his future therapy. To allow the collection to be timed to ensure the efficient collection of PBSCs, his peripheral blood progenitor cell count is measured from the first day of neutrophil recovery.
Flow cytometry
Peripheral blood CD34 count (progenitor cells) enumeration is performed using the ISHAGE method. 12
A graphical representation of absolute CD34 count in cells per microlitre is shown for consecutive days (Figure 7).
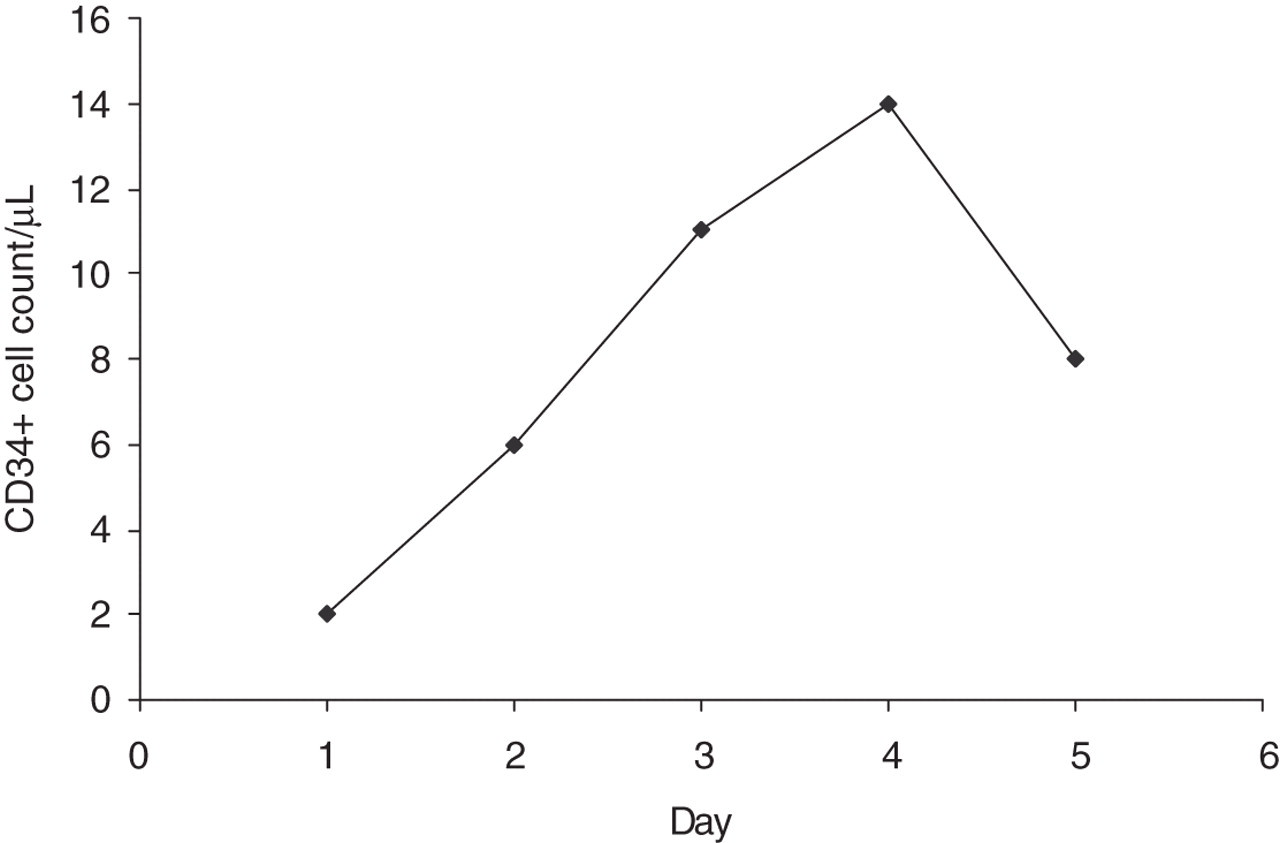
Peripheral blood CD34+ cell counts measured on consecutive days following chemotherapy in a patient with non-Hodgkin's lymphoma
Interpretation
The progenitor cell count rises above 10 cells/µL on the third day of testing. Peripheral blood leucopheresis is commenced on this day to harvest PBSCs. The count on day 4 is 14 cells/µL and a further stem cell collection is made. The day 5 count has fallen to 8 cells/µL and collection ceases. Across the two collections, adequate stem cell numbers are collected to store for future transplantation.
The window where sufficient stem cells are circulating in the peripheral blood is small so timing of collections using peripheral blood CD34 counts is crucial. 21 Reliable counting of rare events needs large numbers of events to be analysed. To achieve an intra-assay coefficient of variation of 10%, 100 positive events need to be collected. 43 In practice, this means that between 500,000 and 1 million cells need to be acquired.
Screening for genetic disease
Principle
Some genetic diseases result in the failure to express a protein on the surface of cells. If the cells affected are present in peripheral blood and a suitable antibody is available, a simple screening test for a genetic disease can be developed. This methodology is employed in the investigation of platelet disorders (Glanzmann's thrombasthaenia and Bernard–Soulier syndrome), 46 leukocyte adhesion deficiency 47 and X-linked hyper IgM syndrome. 47
Case study
A nine-month-old male is admitted to the paediatric intensive care unit in respiratory distress. His chest computed tomography scan shows a ground glass appearance and Pneumocystis jiroveci pneumonia (PCP) is suspected. There is no history of HIV in the family and the child tests negative for HIV. PCP is confirmed by culture. The finding of an opportunistic infection in an HIV-negative individual prompts further investigation for immune deficiency. The lymphocyte count and T- and B-cell subsets are normal. Immunoglobulins show undetectable IgG and IgA with a normal IgM. X-linked hyper IgM syndrome is suspected and samples are sent to check for normal expression of CD40 ligand. CD40 ligand is expressed on activated CD4+ T-cells. Interaction with CD40 present on B-cells triggers class switching of immunoglobulin. An absence of CD40 ligand is a marker for X-linked hyper IgM syndrome.
Flow cytometry
Whole blood from the patient and control are incubated for six hours at 37°C with phorbol myristate acetate and calcium ionophore to activate the cells. Aliquots of activated whole blood are stained with the following combinations:
CD3 (pan T-cells) and CD154 (CD40 ligand); CD3 (pan T-cells) and CD69 (activation marker).
The graphical display for a normal control and patient are shown in Figure 8.
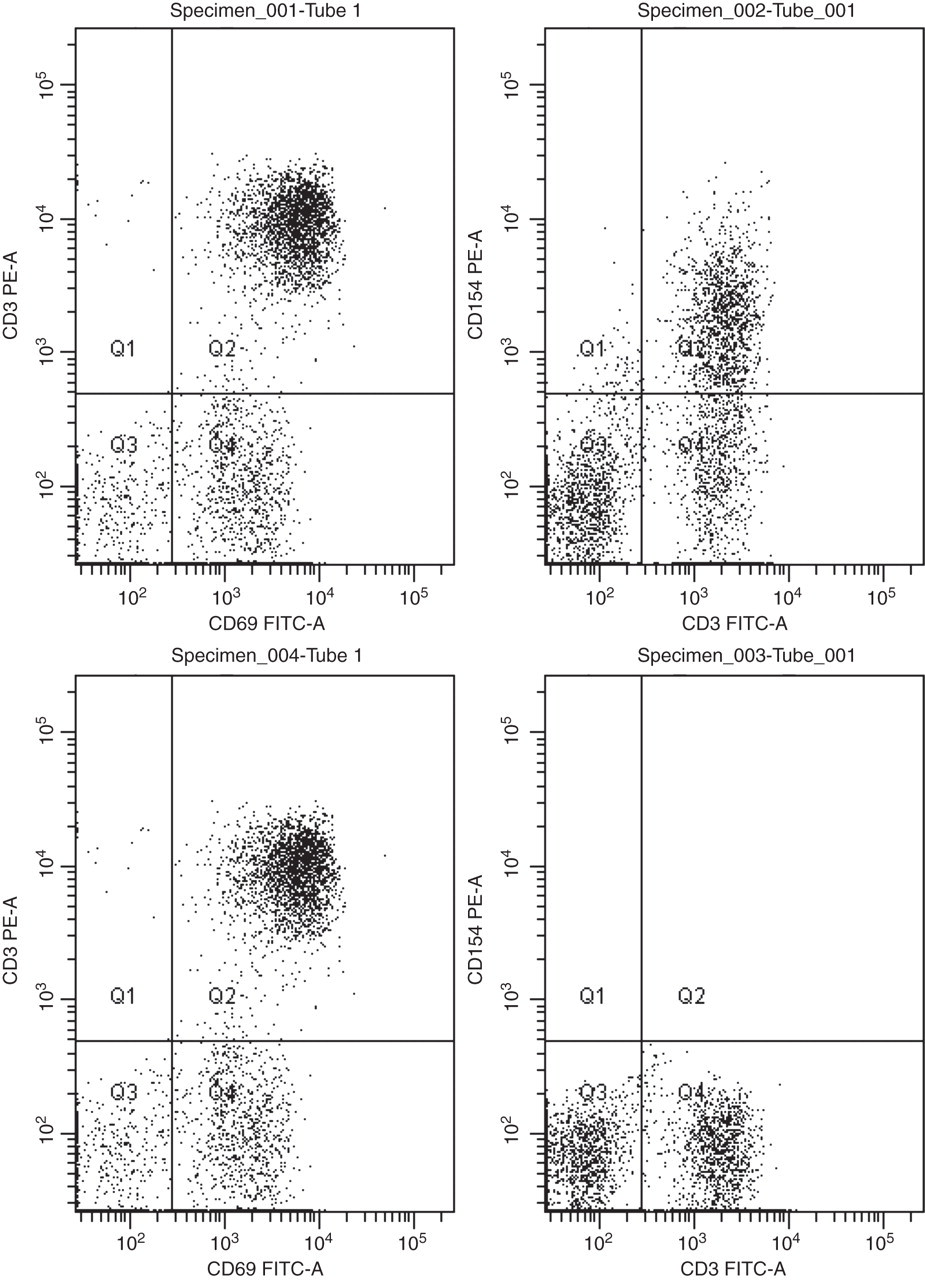
Flow cytometry plots for control (Specimen 001 + 002) and patient (Specimen 003 + 004) illustrating expression of CD69 and CD154 of T-cells (CD3 positive) postactivation. FITC, fluorescein isothiocyanate; PE, phycoerythrin
Interpretation
T-cells (CD3+) from both normal control and patient up-regulate CD69 showing that T-cells present are functional and have been activated. The normal control shows expression of CD154 on a proportion of T-cells. The patient's sample shows no CD154 expression. This would be in keeping with a diagnosis of X-linked hyper IgM syndrome and was subsequently confirmed by genetic analysis.
While flow cytometry provides a rapid method for screening for some genetic diseases, the test does rely upon the antigenic recognition of specific proteins on the cell surface. A proportion of disorders are seen whereby protein expression is antigenitically identifiable but functionally defective. This would lead to a falsely reassuring flow cytometric assay. 48 Genetic analysis is therefore required in all those cases where the diagnosis is suggested by the screening test or in those cases where the clinical index of suspicion is high and the screening test is normal.
Future directions
The trend for improving instrumentation, software and fluorochromes looks set to continue. Current techniques will be further improved by making the set-up of instruments, as well as the staining and analysis of samples more reproducible and easier to perform. These developments will make flow cytometry even more accessible within clinical pathology.
One of the more exciting developments is that of image cytometry. 49 Combining all the features of modern multicolour flow cytometers, image cytometry also provides an image of the cell that has been analysed. There are many research applications for such a system and these will translate into new tests for diagnosing and monitoring conditions within clinical pathology.
Conclusion
Flow cytometry has developed from infancy to become a mainstay of the modern clinical pathology laboratory in a relatively short timeframe, and much more is on the horizon. The underlying science and technology is complex, but the user interface is comparatively simple and this has been the key to bringing a wide variety of assays within easy reach of the routine diagnostic laboratory in which workloads and clinical expectations are rising.
Flow cytometry is a very ‘transferable’ technology in that its basic principles can be applied across a wide range of specialist disciplines and this, coupled with the increasing power of the instrumentation, will ensure its growing contribution towards patient care in the future.
DECLARATIONS