
Abstract
Background
Elevated alphafetoprotein (AFP) concentrations may result from a variety of clinical conditions, but their role as an important tumour marker has been well established. There may be differences in AFP values due to laboratories using different methods, even though most methods have been calibrated with the same international standard (WHO IS 72/225). Therefore it is important to know the analytical performance of the various methods in relation to the analytical requirements for AFP measurement.
Methods
Annually, from January 2005 to July 2010, the results were analysed from the 65–75 laboratories that took part in the AFP survey of the External Quality Assurance programme of the Foundation Quality Control Medical Laboratories (the SKML/Binding Analysis) in the Netherlands.
Results
The Elecsys/Modular (36%) and the Immulite 2000/2500 (29%) are the methods used most. The methods show, on average, up to 15% positive and 12% negative bias, compared with the all-laboratory trimmed mean. Of the laboratories using the Immulite or the Elecsys/Modular analyser, over 70% show sufficient analytical performance to meet the Fraser criterion for method imprecision. Of the laboratories using a different method, over 50% do not meet this criterion.
Conclusions
AFP immunoassays suffer from method bias, even though all methods have been calibrated with the same international standard. Some of the methods used show insufficient performance.
Introduction
The serum protein alphafetoprotein (AFP) was first detected in 1956. 1,2 It is produced in the fetus by the yolk sac and the fetal liver, and to a lesser extent also in the gastrointestinal tract. 3 AFP is a glycoprotein which contains up to 4% carbohydrates with a molecular mass varying from 66 to 70 kDa, depending on the carbohydrate content. 4 The AFP molecule contains 591 amino acids and is organized in a U-shaped structure containing three domains, linked by 15 regularly distributed disulfide bonds. 4,5
Elevated AFP concentrations may result from a variety of clinical conditions, but their role as an important tumour marker has been well established. 6,7 In testicular cancer patients, tumour marker measurements are mandatory, and AFP is recommended for diagnosis/case findings, staging, prognosis determination, recurrence determination and therapy monitoring. 8 In these patients, AFP concentrations can be close to the reference values of AFP, which means that good analytical measurements at low concentrations are critically important. 7
Like many other proteins, AFP has a molecular microheterogeneity. For an overview of this heterogeneity, see the review by Mizejewski. 9
When AFP is used as a tumour marker, the heterogeneity of the molecule may be a problem because AFP can sometimes be missed by the antibodies used in a particular immunoassay. 10 Moreover, the measured AFP values may differ between laboratories due to the use of different methods, even though most methods have been calibrated with the same international standard (WHO IS 72/225; National Institute for Biological Standards and Control or NIBSC).
Therefore, it is important to know the analytical performance of the various methods in relation to the analytical requirements for AFP measurement. For this purpose, the results were used of the External Quality Assurance programme (EQAS) for the period January 2005 to July 2010. In the Netherlands, the EQAS is carried out by the Foundation Quality Control Medical Laboratories (the SKML/Binding Analysis). The present study provides an overview of the AFP methods used in the Netherlands and the variation in results in the Dutch EQAS.
Material and methods
Each year, the Dutch EQAS organisation for binding analysis (the SKML/Binding Analysis) organizes six surveys. In each survey, two bottles with serum (A and B) are analysed, and each bottle contains different levels of AFP. These are human donor, serum-based samples to which concentrates have been added of some pooled patient samples that contain high levels of AFP. In a typical year, all 12 samples are prepared at the same time using the same normal human serum base pool. Pooled patient serum samples containing high AFP concentrations are added to the base pool to obtain final AFP concentrations ranging from 10 to 60 kU/L (1 kU/L = 0.83 μg/L). Prior to 2009, the samples were lyophilized and dispatched at ambient temperature. This was found to adversely affect some other analytes present in the sample. Consequently, specimens have been frozen and sent to all participants on dry ice since 2009.
All Dutch hospital laboratories participate in the SKML EQAS on a regular basis: the numbers of laboratories participating range from 65 (2005) to 75 (2010). At the end of a survey, the hospitals report their results to the SKML, including the method used. If during the period reviewed, a laboratory had switched to another method, this was recorded.
In this study, all individual anonymized results were obtained from the SKML and outliers were removed. For the outlier procedure, Healy's method was used. 11
In each survey, the AFP concentrations are different in each bottle A/B and they differ from survey to survey; therefore, each result was recalculated to a z-value, i.e. the result of a participant minus the ALTM (all-laboratory trimmed mean of AFP results from bottle A or B) and this difference was divided by the SD (standard deviation of AFP results obtained for bottle A or B) of each survey. In this way, it is possible to compare the results of all surveys, despite the differences in levels. The SD of these z-values divided by the ALTM (×100%) will give the within-laboratory coefficient of variation (CVwlab). This was calculated for each laboratory.
From the individual AFP results of the participants of the EQAS programme, the CVwlab was calculated for the five consecutive years.
According to the Fraser criterion, a desirable analytical imprecision (I) can be calculated from the within-subject variation (CVw): I < 0.5CVw. 12,13 The average CVw of AFP is estimated to be 12%, which means that the desirable specification for imprecision of AFP is ≤6%. 14
The reference change value (RCV) is another important criterion relevant to markers, such as AFP, which are used for serial monitoring. The RCV provides an indication of statistically significant differences between two consecutive measurements. 15 The RCV is calculated from the CVw and CVwlab: RCV = 21/2 z(CVw2 + CVwlab2)1/2. A z-score of 1.96 for 95% probability is used to identify a significant RCV, while a z-score of 2.58 is used for a 99% probability.
Results
In 2010, almost all the laboratories made use of one of the following eight analysers (relative market share): Abbott Architect (15%) and Abbott Axsym (2.7%) (Abbott Diagnostics, Hoofddorp, The Netherlands), Siemens (previously Bayer) Advia/Centaur (5.1%) and Siemens (previously DPC) Immulite 1/1000 (2.2%) and Immulite 2000/2500 (29%) (Siemens Healthcare, The Hague, The Netherlands), PerkinElmer AutoDelphia (1.3%) (PerkinElmer, Groningen, The Netherlands), Roche Elecsys/Modular (36%) (Roche Diagnostics, Almere, The Netherlands) and Beckman Coulter Access/Dxi (9.2%) (Beckman Coulter, Woerden, The Netherlands). Since 2005, the Elecsys/Modular and the Immulite 2000/2500 have been the most frequently used methods. The Access/Dxi, the Architect and the Elecsys/Modular have gained an increasing number of users throughout the years. For the Elecsys, the relative contribution increased from 24% in 2005 to 36% in 2010; for the Access/Dxi, the increase was from 2% to 9%; and for the Architect, from 10% to 15%. In addition, the number of Immulite 2000/2500 users remained stable at about 30%.
Although all the methods had been calibrated against WHO IS 72/225, on average, the methods showed up to 15% positive and 12% negative bias, when compared with the ALTM as shown in Figure 1. The Advia/Centaur and the Architect were above the ALTM by an average of 14% and 11%, respectively, and the Immulite 1/1000 and the Immulite 2000/2500 were below the ALTM by 7% and 8%, respectively. The differences observed may reflect differences in the specificities of the antibodies used and of the method design.
9
From Figure 1, it becomes clear that for the samples used in 2010, the bias ranged from −5% to +7%; however, in 2006, it ranged from −12% to +16%.
Average deviation (%) of the method mean from the all-laboratory trimmed mean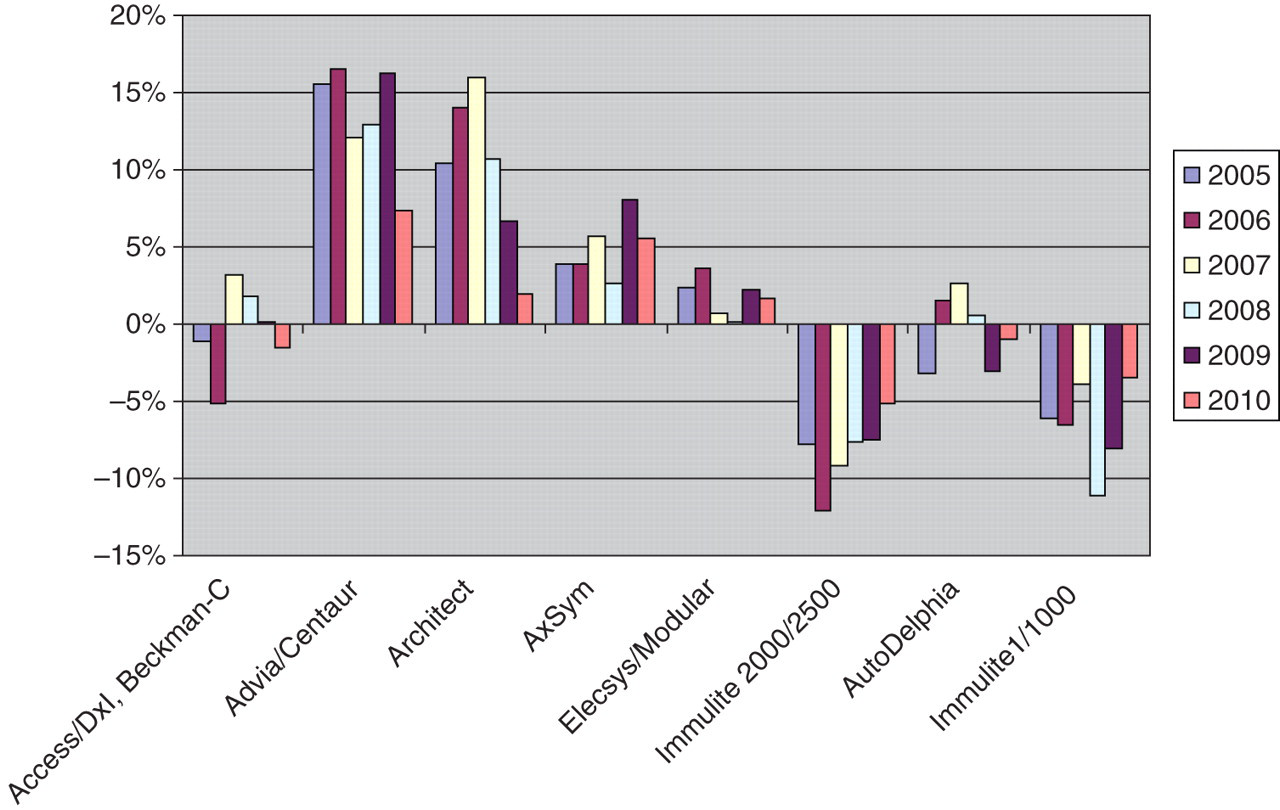
Percentage of times when the within-laboratory analytical imprecision (CVwlab) for a particular method meets the desirable imprecision criterion of ≤6%
Calculations were made on the data from five years of survey results (2005–2010)
*Total number of times an annual CVwlab could be calculated for a particular method
The CVwlab could not be calculated for the AutoDeplhia as too few results had been obtained
Discussion
All hospital laboratories are eager to perform well. As a result, they make use of internal and external assessments to monitor day-to-day performance of the assay, and they all make use of sophisticated fully automated random access analysers. However, these activities do not always lead to good results; there are several reasons for this.
Firstly, variation between methods leads to discrepancies. Although all these methods are calibrated with the same WHO 72/225 standard, an average of up to 30% discrepant results was found in the surveys of 2005–2010, and individual results differed by a factor of 1.5–2.0. This between-method variation is sample-dependent, as shown in Figure 1, and is probably related to the mix of AFP isoforms. It may be expected that less heterogeneity in AFP isoform composition in a sample leads to less variability. It is not surprising that methods differ, because the IS 72/225 is a pool of cord blood AFP with its characteristic isoform pattern which differs from that in normal human serum. 16 It is important to keep using the same method for a patient who is in the follow-up procedure after treatment for a tumour.
A second cause of the variation in results is the laboratory performance. It is not difficult to buy an excellent analyser, but this in itself is no guarantee for excellent results and good performance in the EQAS. Good maintenance of the analyser, a proper calibration and inspection procedure, and minimal lot-to-lot variability (of reagents and calibrators or adjustors) are some of the factors that increase precision. On the other hand, some analysers generally perform better than others, as is shown in Table 1. It is easier for laboratories using these analysers to meet the criterion of an analytical variation of less than 6%. However, there are still also laboratories that perform poorly with one of these ‘good’ analysers. Consequently, the treatment of some patients may not be optimal, i.e. it is either delayed or unnecessarily induced.
The results presented in this paper were based on the results of EQAS surveys rather than on a direct comparison of individual patient samples. The logistics of these samples is somewhat different compared with patient samples; however, the performance in the EQAS should reflect the performance of a laboratory in daily practice. This is especially poignant when it is considered that nearly all these laboratories were accredited. It is clear that there is still room for improvement.
Conclusion
In conclusion, the results of the Dutch EQAS show that AFP immunoassays suffer from method bias even though all methods have been calibrated with the same international standard. The quality of the analyser is only part of the answer to the question of how to obtain maximal quality; the way of dealing with the analyser and the procedures used for measuring AFP also significantly contribute to the overall performance. It is necessary to further attempt to eliminate this method bias. In other words, there is still room for improvement.
DECLARATIONS