
Abstract
Background
The recently developed, highly sensitive cardiac troponin T (hs-cTnT) immunoassay improves the detection of acute myocardial infarction (AMI). However, this assay requires further analytical and clinical evaluation.
Methods
Imprecision, linearity, limits of quantification and interferences were evaluated; hs-cTnT was compared with a conventional cardiac troponin I assay (cTnI), performed on an X-pand®HM, in a population of patients with suspected AMI. Finally, the 99th percentile cut-off point for a reference population was explored in 213 healthy control subjects.
Results
Imprecision analysis demonstrated coefficients of variation (CVs) below 4%, linearity showed a 0.999 coefficient of correlation, with excellent recovery (99.9%) and a limit of quantification (10%CV) was found at 9.2 ng/L. A negative interference (>20%) with haemolysis was observed when supplemental haemoglobin was above 0.25 g/dL. Patients with suspected AMI more frequently displayed an increased hs-cTnT (83%) than an increased cTnI (55%, P < 0.01). Unstable angina was present in 63% of patients with an increased hs-cTnT associated with no increase in cTnI. The 99th percentile value for our reference population was 16.9 ng/L. In 213 healthy blood donors, hs-cTnT levels were significantly correlated with age (P < 0.0001), and were higher in men than in women (P < 0.0001).
Conclusions
The analytical performance of hs-cTnT complied with the international guidelines for AMI detection. Determining the degree of haemolysis in a sample is of paramount importance to the interpretation of hs-cTnT results. The 99th percentile value of our reference population was established.
Introduction
Commercial cardiac troponin (cTn) assays enable both the specific detection and quantification of cardiac troponin I (cTnI) or T (cTnT) isoforms in blood. In cardiomyocytes, troponins are present in small quantities (about 10%) in the cytosol, and in large quantities within the contractile apparatus, with a higher proportion of cTnT than of cTnI. 1 In patients with acute coronary syndrome (ACS), myocardial damage leads to a release of cTn into blood as early as the ischaemic phase. cTn plasma levels are directly related to the release of both the cytosolic and apparatus pools after activated enzymatic cytolysis during necrosis. 2
Since the 2000 and 2007 international guidelines were published, 3,4 the role of cTn in the diagnosis and prognosis of ACS has been fundamental. Moreover, the Joint ESC-ACCF-AHA-WHF Task Force on the redefinition of myocardial infarction recommended the use of cTnT or cTnI with a cut-off point (i.e. the 99th percentile) associated with minimized imprecision. 4 The imprecision goal (given as a coefficient of variation [CV]) is 10% (10%CV). 4 Conventional methods to detect cTn are not analytically adapted to this target, because all assays present either an undetectable 99th percentile value, or one that is detectable with an imprecision of more than 10%. 5 The main objective of the recently developed, highly or ultra-sensitive cTn methods was to quantify low troponin concentrations with greater accuracy to achieve a precision of ≤10% at the 99th percentile value so that they would fully comply with the recent guidelines. 4 A new, highly sensitive cTnT (hs-cTnT) assay has been developed, as a modification of the Roche Diagnostics fourth-generation cTnT electrochemiluminescent immunoassay (Roche Diagnostics, Mannheim, Germany). Briefly, analytical sensitivity was improved by increasing the sample volume and ruthenium concentration of the detection antibody. 6 Furthermore, to reduce the influence of human anti-mouse antibodies, a modified immunoglobulin was selected as the capture antibody.
The analytical and clinical performance of this new hs-cTnT assay has not been fully elucidated. We present here an evaluation of this hs-cTnT assay, achieved more specifically in terms of its analytical performances on an Elecsys®2010 analyser (Roche Diagnostics, Mannheim, Germany). Importantly, we also compared hs-cTnT values with those of the conventional cTnI assay used locally in patients with suspected acute myocardial infarction (AMI), and established the 99th percentile cut-off point for a healthy reference population.
Materials and methods
Analytical performance
Quality controls (PreciControl TN1 and TN2, reference 05095107 190) and reagents (Troponin T hs CalSet, reference 05092752 190; Troponin T hs kit for 200 tests, reference 05092744 190) were supplied by Roche Diagnostics (Meylan, France). Two plasma pools with different hs-cTnT concentrations (PP1, PP2) were prepared using fresh plasma from informed patients. Imprecision, linearity, assay precision and interference tests were performed as recommended by the French Society of Clinical Biology. 7
The hs-cTnT Elecsys®2010 immunoassay is based on a one-step sandwich principle, with electrochemiluminescent revelation. The total duration of the assay is 18 min. Fifty microlitres of the sample is incubated with an anti-cTnT monoclonal antibody labelled with ruthenium and with a biotinylated monoclonal anti-cTnT antibody. According to the manufacturer, the measurement range of the assay is 3–10,000 ng/L; the limit of detection (LoD) is 5 ng/L, the 99th percentile value is 14 ng/L and the 10%CV value is 13 ng/L. 8
Erythrocyte haemolysates were prepared according to the procedure, 7 and filtered on a 0.45 μm filter before being added to two unhaemolysed pools of heparinized plasma with hs-cTnT concentrations of 26 and 184 ng/L, as measured by the Elecsys, to produce a range of haemolysed plasma samples. The haemoglobin concentration was measured on a Uvikon spectrophotometer (NorthStar Scientific, Bedfordshire, UK).
An alkaline solution of bilirubin (Sigma-Aldrich, St Louis, MO, USA) was also prepared, and protected from light until use. A control alkaline solution without bilirubin was used to identify the actual effect of the alkaline solution on hs-cTnT concentrations. Plasma concentrations of bilirubin (from 11 to 400 μmol/L) were measured on the Modular®Analytics® analyser (Roche Diagnostics, Meylan, France). Finally, aliquots of Intralipide® 20% (Fresenius Kabi France, Sèvres, France) were prepared. Turbidity was measured rather than the lipid concentration because the composition of added lipids (emulsion of essential fatty acids) is not equivalent to endogenous lipid concentrations (represented by lipoproteins).
The conventional cTnI immunoassay, performed on an X-pand®HM (Siemens Healthcare Diagnostics Inc, Newark, NJ, USA), was chosen to compare the assays as it is the method used locally with which we have the most experience. This assay is based on a one-step sandwich principle, with enzymatic revelation. The manufacturer gives a 99th percentile value of 0.07 μg/L, and this value is associated with a CV of around 20%. 9 The announced 10%CV value of 0.14 μg/L was confirmed in our laboratory (data not shown).
Patients with suspected AMI
Hs-cTnT values obtained on the Elecsys®2010 analyser were compared with the cTnI values obtained using the X-pand®HM analyser. Measurements were performed using plasma because most of the parameters tested in our laboratory are measured on plasma. In addition, the manufacturer indicates that plasma and serum can equally be used. Two hundred and twenty-three plasma samples obtained from 81 patients (at their admission to Hôpital Cochin – 0 h, then at 3 and 6 h) with suspected AMI were compared. cTnI measurements were performed on fresh heparinized plasma prior to their storage at −40°C. Hs-cTnT measurements were then performed within an interval of six months.
Reference values
Blood samples from 213 healthy donors were collected into lithium heparin tubes. The donors were defined as healthy after history, clinical examination and routine blood analysis. Electrocardiograms were not performed. The exclusion criteria were personal history of coronary disease, abnormal blood pressure values or plasma creatinine values above the normal range (100 μmol/L for women and 110 μmol/L for men). The plasma samples were stored for a maximum of 18 months at −40°C. The samples were thawed and then centrifuged for 15 min at 3000 rpm before hs-cTnT analysis. Hs-cTnT measurements were performed on a Cobas® e601 analyser (Roche Diagnostics, Meylan, France) using the same reagents and methodology as the Elecsys®2010. For each of the 213 samples, analytical data (concentration and electrochemiluminescent signal) were recorded. Hs-cTnT population values were calculated after selecting the samples according to Dixon's criteria. 10 For these calculations, hs-cTnT values below 5 ng/L (LoD) were considered as 0 ng/L. A histogram reflecting the breakdown of patients as a function of their hs-cTnT concentrations was constructed.
Statistical analysis
The results were analysed using Microsoft Excel software (version 2003, Microsoft Office; Microsoft France, Issy les Moulineaux, France) and MedCalc 3.4.2.0 for Windows (MedCalc Software, Mariakerke, Belgium). They were expressed as means (SD) for continuous variables, and numbers (percentage) for discrete variables. Data were compared using Student's t-test or the Mann-Whitney U test for continuous variables, and the Chi-squared or Fisher's exact test for differences in frequencies, as appropriate. A P value <0.05 was considered to be statistically significant. In order to perform calculations on reference values, hs-cTnT values below 5 ng/L have been considered as 0 ng/L.
Results
Imprecision
PreciControl TN1 and TN2 values were analysed repeatedly: 20 times on the same day (within-run imprecision) and then once a day for 20 consecutive working days (between-run imprecision). Mean (SD) values, calculated CVs and bias are shown in Table 1. All CVs were less than 4%, and bias was less than 6% in absolute values for both low and high hs-cTnT concentrations.
Within- and between-run imprecision
*Mean of deviations (deviation n = [(value n − target value) × 100]/value n )
Linearity
The linear relationship between the upper and lower limits of the measurement range was tested. Ten dilutions of a plasma containing 7982 ng/L cTnT were prepared in a plasma free of hs-cTnT (<3 ng/L) and tested in triplicate. The maximum dilution tested was 1:640. The linear regression curve is presented in Figure 1a.
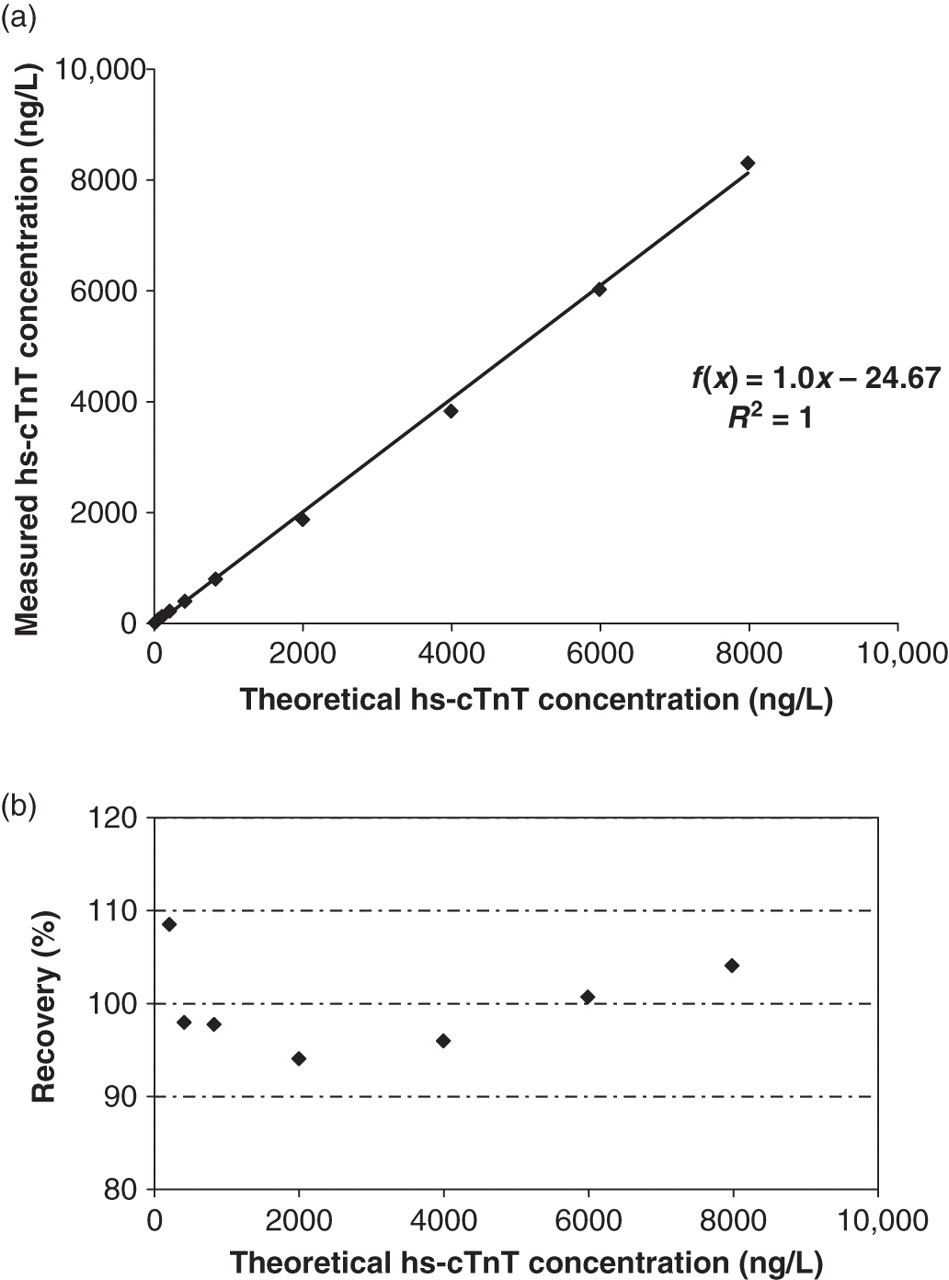
Linearity of the method. (a) linear regression; (b) recovery. Ten dilutions of a plasma containing 7982 ng/L of cTnT were prepared in a plasma free of hs-cTnT (<3 ng/L) and tested in triplicate. The maximal dilution tested was 1:640. hs-cTnT, highly sensitive cardiac troponin T
The mean (SD) recovery percentage was 99.9 (5.0)% between 206 and 7982 ng/L (minimum 94.1%, maximum 108.5%; see Figure 1b).
Precision of the Hs-cTnT assay
Precision of the assay was tested by analysing eight dilutions of a plasma containing 190 ng/L hs-cTnT in a plasma free of hs-cTnT (<3 ng/L). The assays were repeated on 10 consecutive working days. The mean (SD) concentration of hs-cTnT and the CV were calculated for each dilution. Functional sensitivity (i.e. limit of quantification [LoQ]), defined as the smallest cTnT concentration that could be measured with a CV of 10% (or 10%CV), was 9.2 ng/L, as calculated from the logarithmic equation of the curve (Figure 2).
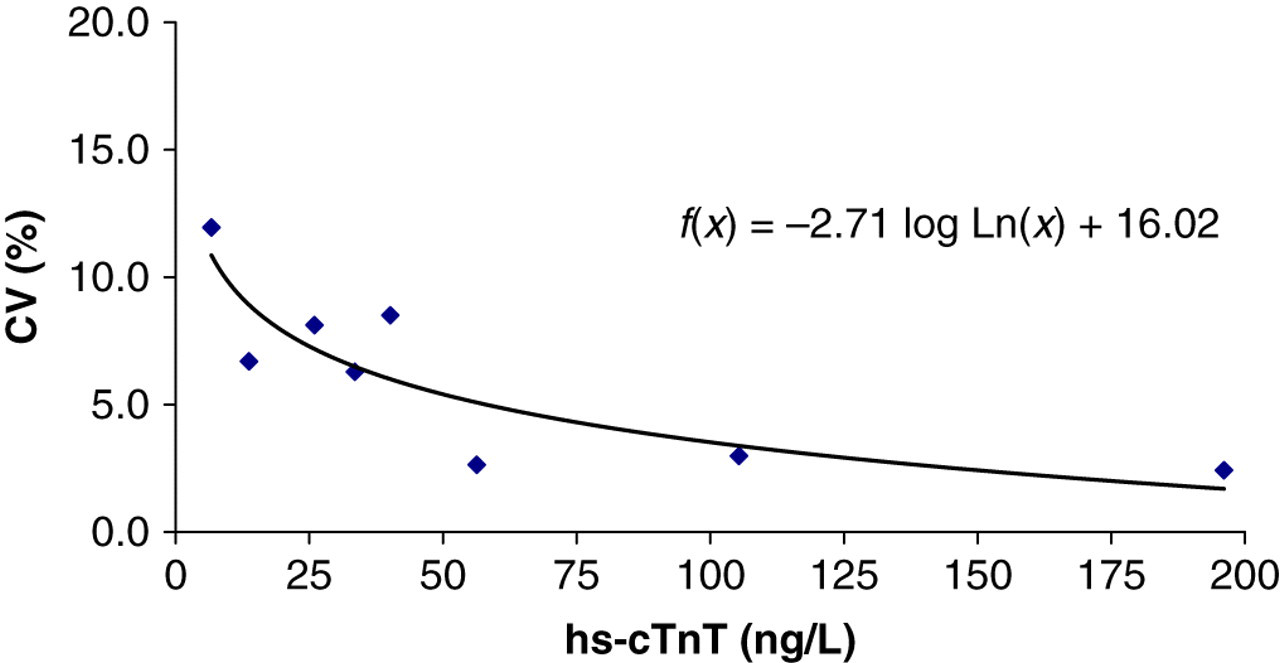
Precision profile of the hs-cTnT assay. The coefficient of variation (CV) at decreasing concentrations of cTnT is plotted. Each plot represents the mean of 10 determinations. The hs-cTnT concentration corresponding to a 10%CV is the limit of quantification. hs-cTnT, highly sensitive cardiac troponin T
Interference testing
Aliquots of human erythrocyte haemolysate were added to two series of plasma pools (PP1 and PP2), containing, respectively, 26 and 184 ng/L of cTnT. The samples were analysed in triplicate. Changes to hs-cTnT concentrations (expressed as a percentage of a control free of haemolysis) as a function of the plasma-haemoglobin concentration (from 0.03 g/dL to 0.4 g/dL) are presented in Figure 3a. A negative interference of haemolysis (>−20% of the initial concentration) was observed as from 0.25 g/dL of haemoglobinaemia on PP1. At this haemoglobin concentration, the effect was less marked (−15%) with PP2. Bilirubin (or the alkaline solution alone) was added to PP1 and PP2. The samples were analysed in duplicate. The changes observed to hs-cTnT concentrations are presented in Figure 3b.
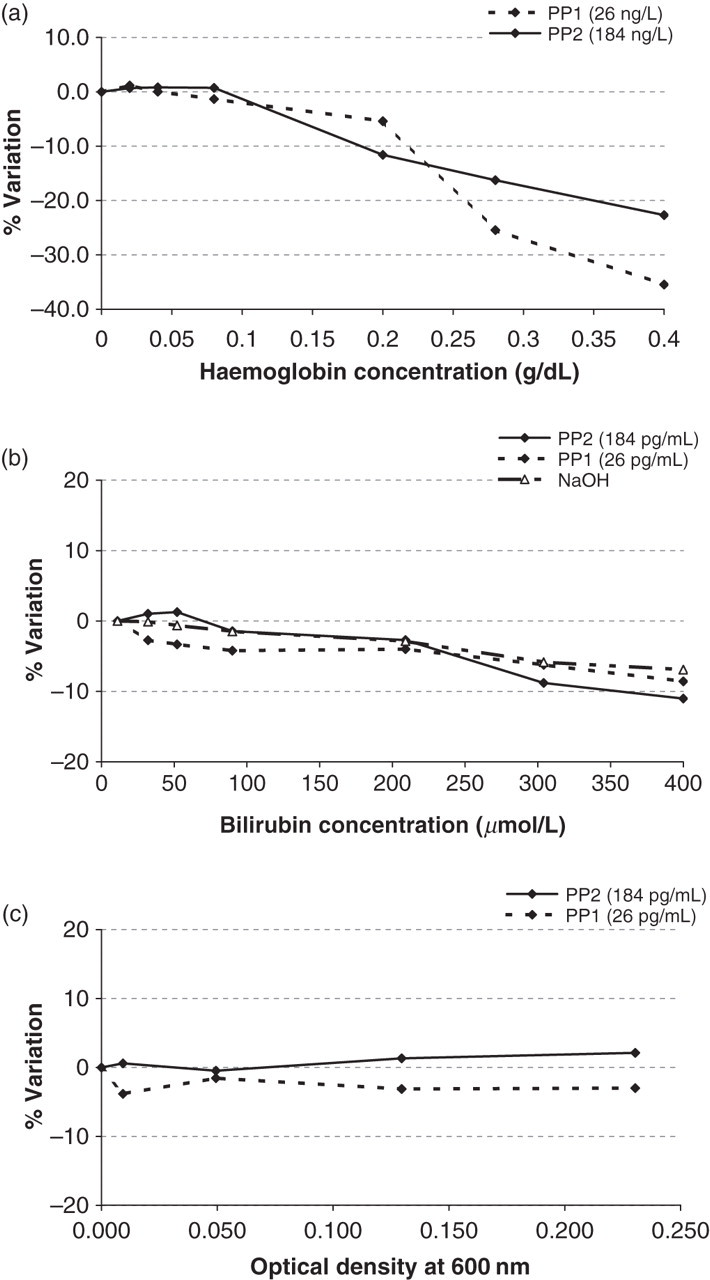
Influence of haemolysis (a), bilirubin (b) and turbidity (c) on plasma hs-cTnT concentrations. PP1, plasma pool containing low concentrations of hs-cTnT (26 ng/L); PP2, plasma pool containing high concentrations of hs-cTnT (184 ng/L). Relative variations of troponin T are expressed as a percentage (relative variation). hs-cTnT, highly sensitive cardiac troponin T
Aliquots of Intralipide® 20% were added to PP1 and PP2, and the samples were analysed in duplicate. Pools were supplemented with four dilutions of Intralipide® to reach a turbidity of between 0 and 0.230 units of absorbance (at 600 nm) when the supplemented sample was diluted (1:20) in 0.9% NaCl. Changes to hs-cTnT concentrations are presented in Figure 3c.
Our results indicated that neither bilirubin (up to 400 μmol/L) nor turbidity (up to 0.230 units of absorbance at 600 nm) induced significant interference regarding the hs-cTnT assay.
Hs-cTnT versus conventional cTnI: a comparison in patients with suspected AMI
Hs-cTnT and cTnI were measured in patients as described in the Materials and Methods section. The results are presented in Figure 4. Roche's highly sensitive method enabled the detection of cTnT in 211 samples (87%) (hs-cTnT values >5 ng/L); this proportion was significantly higher than that detected using the Siemens conventional cTnI method (139 samples [55%] with cTnI values >0.04 μg/L; P < 0.01). Our results also indicated 82% of concordance between the two methods: 101 samples with positive values (cTnI values ≥0.14 μg/L and hs-cTnT values ≥14 ng/L), and 99 samples with negative values (cTnI values <0.14 μg/L and hs-cTnT values < 14 ng/L). As for the discrepant 43 samples (collected from 19 patients), they all presented cTnI values below 0.14 μg/L associated with hs-cTnT values higher than 14 ng/L. The final adjudicated clinical diagnoses were established by a consensus of two cardiologists, based on the medical documents available (including cTnI results obtained using the local Siemens method), but not on the investigational hs-cTnT assay: unstable angina in 12 (63%) patients, cardiac (but non-coronary) pain in four (21%) patients, heart failure in two (11%) patients and syncope in one (5%) patient.
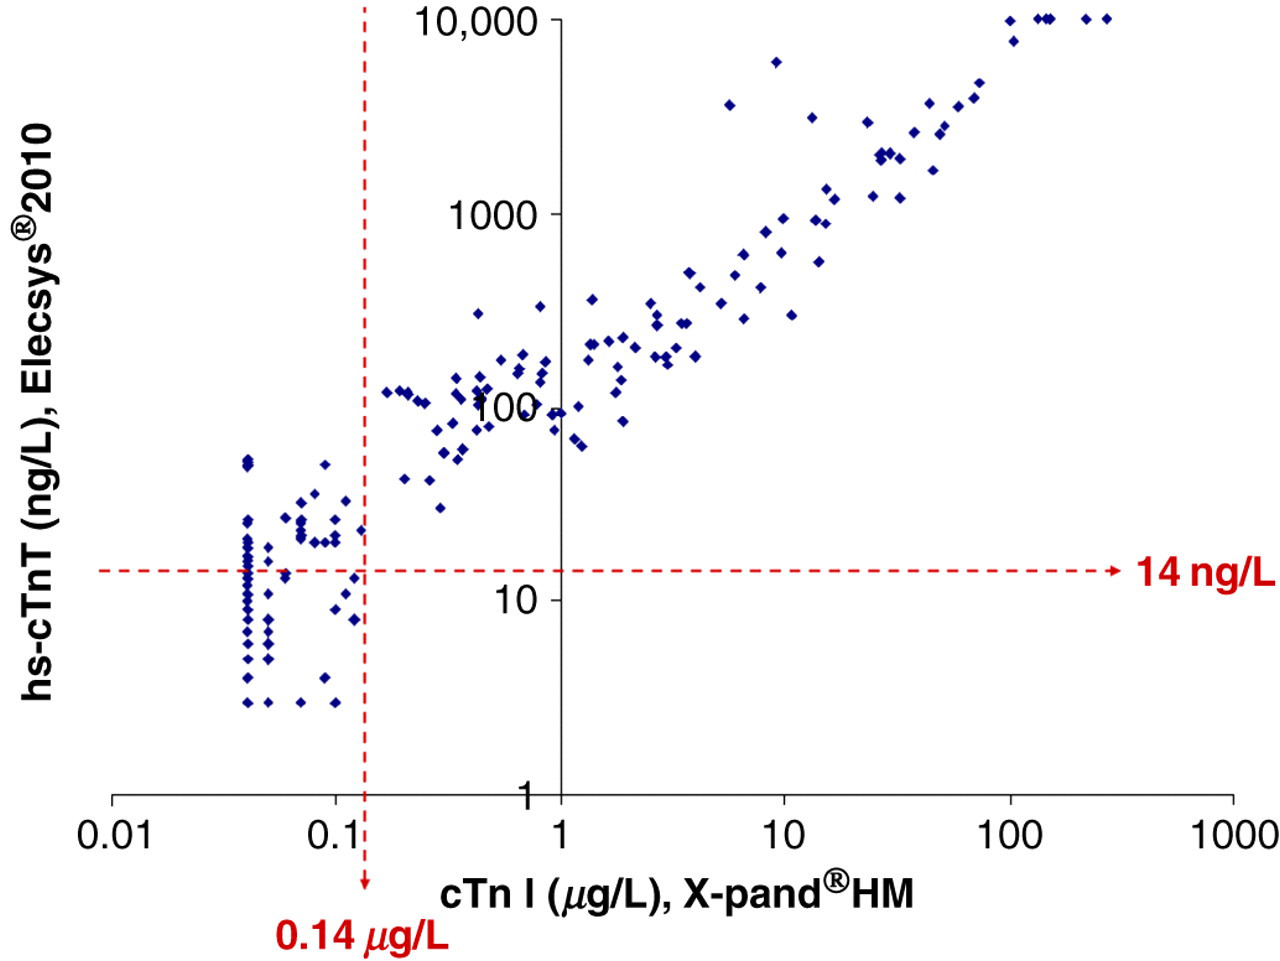
Comparison of hs-cTnT concentrations with cTnI concentrations in 243 plasma samples from patients suspected of non-ST segment elevation acute myocardial infarction. Dotted lines indicate the positive cut-off point of the method for the diagnosis of ACS: 14 ng/L (hs-cTnT on Elecsy®2010) and 0.14 µg/L (cTnI on X-pand®HM). hs-cTnT, highly sensitive cardiac troponin T; ACS, acute coronary syndrome
Reference values (99th percentile value)
Hs-cTnT levels were measured in 213 healthy blood donors, as described in the Materials and Methods section. The principal characteristics of this reference population were: a mean age of 52 (15) years (range: 21–90 y), with 77 men (36%). The distribution of this population as a function of hs-cTnT values was not normal (Kolmogorov–Smirnov test: P < 0.001) (Figure 5a). The 99th percentile value was 16.9 ng/L. Using the manufacturer's data, 154 patients (62%) presented with hs-cTnT values lower than the limit of the blank (LoB = 3 ng/L), while 176 patients (83%) were beyond the LoD (LoD = 5 ng/L); based on our data, 203 patients (95%) were beyond the LoQ (LoQ = 10%CV = 9.2 ng/L). It should be noted that three donors presented with hs-cTnT values >14 ng/L: a 78-year-old man (hs-cTnT = 16.3 ng/L) and two women (78 and 90 years old; hs-cTnT = 17.9 and 17.8 ng/L, respectively). Moreover, when analysing the data according to age and gender, hs-cTnT plasma concentrations were partially but significantly correlated to age (men: R 2 = 0.266, P < 0.0001; women: R 2 = 0.197, P < 0.0001). Lastly, hs-cTnT plasma concentrations were higher in men than in women (P < 0.0001).
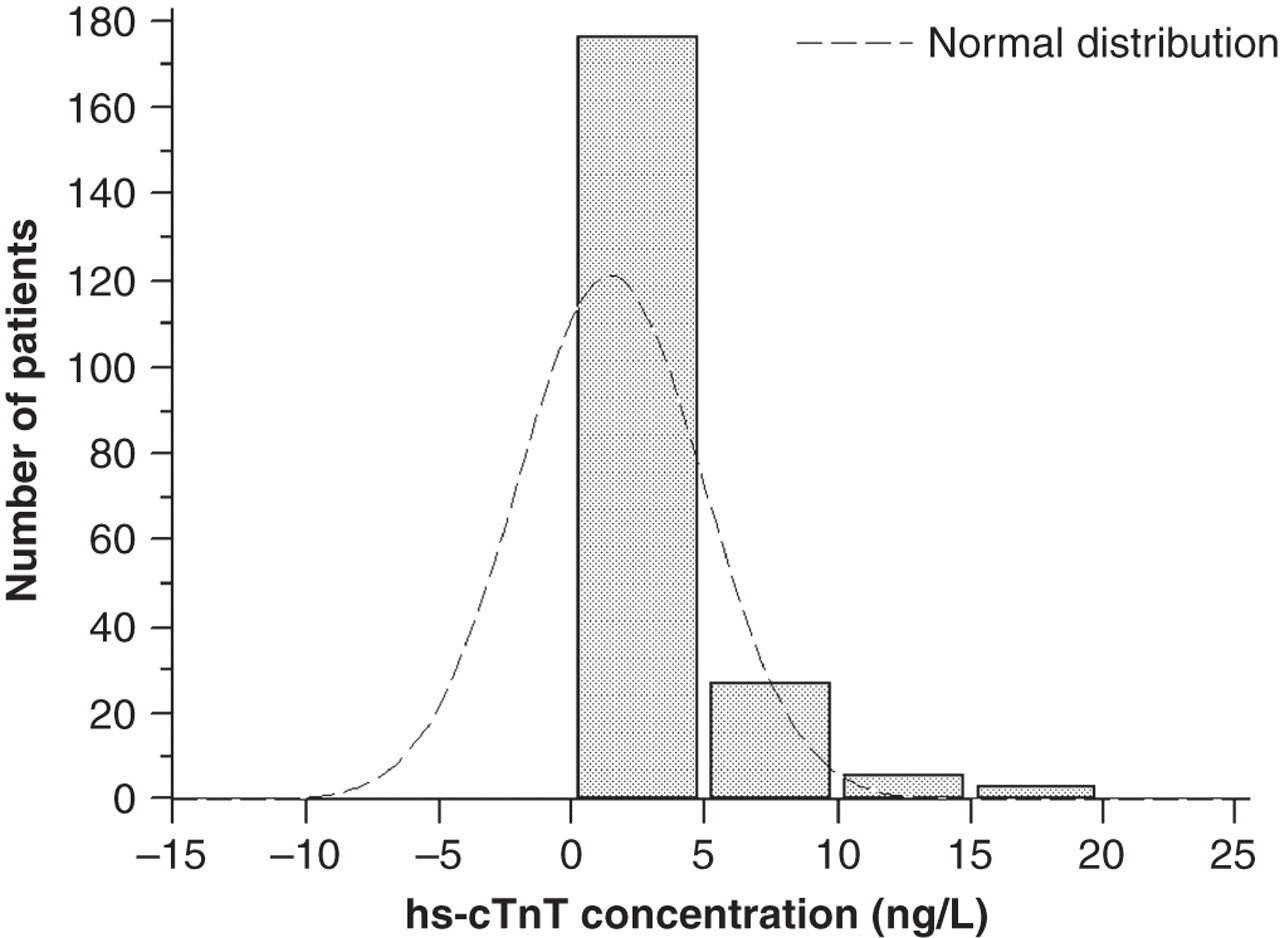
Hs-cTnT values in a healthy population (n = 213): histogram of the breakdown of patients as a function of hs-cTnT concentrations. Values <5 ng/L are considered as 0 ng/L. hs-cTnT, highly sensitive cardiac troponin T
Discussion
Our results demonstrate that the imprecision of the hs-cTnT assay was less than 4%, at any level of hs-cTnT values. Moreover, the bias observed was acceptable, indicating that the expected values were found. The linearity of the method was confirmed on a broad range of measurements: these findings thus confirmed the manufacturer's data. 8 The precision profile made it possible to determine the functional sensitivity (i.e. LoQ, defined as the smallest cTnT concentration that could be measured with a CV of 10%), at 9.2 ng/L. Considering 14 ng/L as the 99th percentile, 4,6 precision was thus sufficiently good to comply with international guidelines. 4
Our results also evidenced a negative influence of haemolysis on the hs-cTnT method. This was in line with findings in the literature. 8,11,12 Above a value of 0.25 g/dL for plasma haemoglobin, a >20% negative interference on hs-cTnT results was observed with the plasma pool containing low concentrations of hs-cTnT. According to the Westgard guidelines, this 20% threshold represents the double of a 10%CV. 10 Florkowski et al., 11 using similar haemoglobin concentrations and a pool of 19.3 ng/L hs-cTnT, demonstrated that the results could be falsely negative (and lie beyond the 99th percentile value at 11.5 ng/L, so with a negative variation of more than 40%). This immediate negative effect could worsen if the sample is not analysed rapidly, as it has been suggested that the negative effect of haemolysis is time dependent. 12 The manufacturer's package insert warns users that when haemolysis is >0.1 g/dL, this may signal the possibility of falsely decreased results. 8 As a consequence, we recommend associating the haemolysis index with each hs-cTnT measurement to optimize interpretation of the results, even in the case of haemolysis. Furthermore, this analytical variation should be added to the percentage change proposed by the literature to detect pathological variations. 4
In parallel, our results indicated that the hs-cTnT assay is robust as no significant effect was observed with either bilirubin up to a level of 400 μmol/L, or turbidity up to 0.230 units of absorbance at 600 nm. This confirms the data available from the manufacturer. 8
Comparing hs-cTnT values with conventional cTnI values made it possible to draw several conclusions. Firstly, the hs-cTnT method could detect small circulating quantities of cTn in more samples than could the cTnI method. Secondly, even if methods were not directly comparable because they do not recognize the same antigens, the Tn concentrations measured using these two methods were mainly in agreement. This may help to reassure clinicians as to the ability of the different methods to diagnose AMI. Circulating cTnI is mainly represented by the cTnI–cTnC complex, and inconsistently by the cTnC–cTnI–cTnT complex. 13 Several circulating cTnT forms may be observed. However, after necrosis, circulating cTnT is mainly represented by the free form (even if a binary complex may be detected in some patients). 13 The 43 discrepant samples all displayed cTnI values <0.14 μg/L associated with hs-cTnT values ≥14 ng/L, which was consistent with the increased sensitivity offered by the hs-cTnT assay. 14,15 Although the mechanism for cTn release in a setting of unstable angina is not fully understood, the proportion of unstable angina cases among these discrepant samples contributed to the increased potential of the highly sensitive cTn method to detect ACS. Although the re-classification of patients subsequent to this observation remains a matter of debate, it is important to recall that unstable angina is largely represented among patients with symptoms related to chest pain, and both acute non-ST segment elevation acute myocardial infarction and unstable angina have a poor prognosis in the absence of prompt diagnosis and treatment. 15,16
Lastly, we studied a healthy reference population to establish its 99th percentile cut-off value. The 99th percentile value, although associated with a low level of imprecision (≤10%CV), is the cut-off value for the diagnosis of AMI according to the international guidelines. 4 It is thus very important for laboratories to confirm the data from manufacturers or the literature. However, it is difficult to ascertain the general health of individuals, and our reference population may have presented some drawbacks when compared with those used in recent published works. Indeed, the literature indicates that hs-cTnT is detectable at levels above the 99th percentile in individuals with stable or occult coronary artery disease or higher estimated glomerular filtration rate. 17 Some experts now advocate that a reference population should also undergo a more detailed, specialist investigation of their coronary arteries, for example, using angiography. However, these recommendations are not practicable for most hospital laboratories. Roche Diagnostics indicates a 99th percentile value of 13 ng/L, 8 and Giannitsis et al. 6 evaluated this cut-off point at 13.5 ng/L (considering an overall population of 616 healthy donors aged 20–71 y): this value was lower (10.0 ng/L) if only the 307 women were considered, and higher (14.5 ng/L) in men. By comparison, our results (99th percentile = 16.9 ng/L, with CV = 8.3%) were established in a smaller population but with a broader age range. The distribution of our reference population was similar, but with a higher 99th percentile value. Subanalysis of our results confirmed the previously described influence of gender, 6 and highlighted a partial but significant influence of age, already suggested for other highly sensitive cTn methods. 18 It has been suggested that the release of cTnI from cardiomyocytes in healthy adult subjects may result from a process related to ‘physiological remodelling’ of the human myocardium. 18 Furthermore, age-dependent increases in cTnI and cTnT in apparently healthy subjects may suggest additional pathophysiological mechanisms. Several histological changes to myocardial tissue, characterized by a loss of myocytes with subsequent hypertrophy of the remaining cells and the calcification of several cardiac structures, can be found in most individuals as they age. 19 Using a highly sensitive immunoassay, Eggers et al. 20 investigated the prevalence of elevated cTnI values in an elderly population that included 1005 individuals aged 70 years. They found that elevated cTnI levels were relatively common in elderly subjects and were associated with cardiovascular risk factors and/or impaired cardiac performance. Thus, in line with the literature, 18 we believe that calculation of the 99th percentile is dependent on the demographic and clinical characteristics of the reference population evaluated. The use of analytical definitions (e.g. CV) and distribution characteristics (i.e. percentiles) should be considered to establish clinical cut-off points for highly sensitive cTn assays.
A scorecard designation of cTn assays has recently been proposed. 9 This classifies cTn methods according to two main criteria: total imprecision at the 99th percentile and the percentage of ‘measurable’ normal values below the 99th percentile. Although the first criterion is well established, the second still remains a matter of debate. Indeed, this percentage is subject to change, and the term ‘measurable’ remains unclear as its definition could be based on the limit of the blank, the LoD or the LoQ. 5
Our study had certain limitations. Firstly, we were not able to test the stability of the assay at different temperatures and durations of sample storage. Alongside an evaluation of the correlation between plasma and serum concentrations, these aspects need to be addressed in a separate study. Secondly, the assays of hs-cTnT were performed using two different analysers (Elecsys and Cobas), even if both came from the same manufacturer and used the same reagents. Thirdly, the assay that we used as a reference (i.e. conventional cTnI assay) for reasons explained above is not an ideal comparator assay; it would be of interest to compare hs-cTnT assay performance with another highly sensitive cTnI assay. Finally, the influence of several non-coronary causes (such as renal dysfunction), that have been shown to influence cTn values, 6 will be investigated in further studies.
Conclusion
Our results indicate the satisfactory analytical performances of hs-cTnT; these comply with the international guidelines for use in patients with suspected AMI. Knowledge of the degree of haemolysis of a sample is of major importance to interpretation of the results. However, this sensitive method offers a more frequent detection of elevated cTn values than the conventional cTnI method, and most of the patients who were newly detected suffered from unstable angina or other acute medical conditions (e.g. heart failure or cardiac syncope). The 99th percentile value for our reference population was established at 16.9 ng/L with a <10%CV; however, calculation of the 99th percentile is dependent on the demographic and clinical characteristics of the reference population being used for a study.
DECLARATIONS