
Abstract
Background
We evaluated the recently released chemiluminescence assay for 25-hydroxy vitamin D (25-OHD) on the Immunodiagnostic Systems iSYS (IDS-iSYS) automated analyser.
Methods
The IDS-iSYS comparison was performed using patient samples previously measured for 25-OHD by a validated liquid chromatography-tandem mass spectrometry (LC-MS/MS) method (n = 119) and an IDS enzyme immunoassy (IDS-EIA) method (n = 64). Limit of detection and limit of quantification were determined from a precision profile. Imprecision was assessed using quality control material and pooled serum. External QAP material (Vitamin D External Quality Assessment Scheme, UK) was analysed to establish inaccuracy. Linearity was assessed by two dilution studies. Cross-reactivity was determined by three serial dilution studies of patient samples with known 25-OHD2 concentrations.
Results
The IDS-iSYS correlated well with both established methods (iSYS = 1.03LC-MS/MS − 6.53, R 2 = 0.82 and iSYS = 1.07IDS-EIA − 1.61, R 2 = 0.86). Imprecision of the iSYS assay for IDS control material was 13.4% at 32 nmol/L, 10% at 78 nmol/L, 9.4% at 161 nmol/L, and for the pooled material 9.3% at 72 nmol/L and 5.6% at 158 nmol/L. The evaluation found the assay to be highly accurate (IDS-iSYS = 0.93ALTM + 3.79, R 2 = 0.94) and linear (obs1 = 0.93exp1 − 5.05, R 2 = 0.99 (P = 0.256); and obs2 = 0.97exp2 + 6.07, R 2 = 0.97 (P = 0.654); ALTM, all-laboratory trimmed mean). Cross-reactivity studies demonstrated no significant difference to the calculated total 25-OHD as measured by LC-MS/MS.
Conclusions
Even though the imprecision of the iSYS was found to be greater than that of the LC-MS/MS and EIA methods, the performance characteristics of the IDS-iSYS 25-OHD assay are suitable for routine diagnostic purposes on a high throughput automated analyser.
Introduction
Vitamin D sufficiency has long been associated with protection from rickets, osteomalacia and the prevention of osteoporosis. 1 Despite remaining the most important driver for vitamin D clinical evaluation, musculoskeletal disease is no longer the ‘be all and end all’ of vitamin D clinical relevance. The last two decades have seen escalating interest in the close association of vitamin D with a range of multifactorial diseases outside the skeleton. Vitamin D insufficiency has been linked to the increased risk of many types of cancer, cardiovascular disease, diabetes, chronic and acute infections, autoimmune diseases, dementia, congestive heart failure and adverse pregnancy outcomes. 2,3 This rising concern of the significance of vitamin D, along with the recognition of higher than expected incidence of deficiency in developed countries, has led to unprecedented demand for 25-hydroxy vitamin D (25-OHD) testing. 4 Issues adding to this exigency, particularly in Australia, include a rapidly ageing population with an associated rise in medical health-care demands and, in recent history, a very successful ‘sun smart’ campaign for prevention of cutaneous melanoma, non-melanoma skin cancers and some cataracts that have been attributed to overexposure to ultraviolet (UV) radiation. 5,6
Serum 25-OHD is the metabolite of choice for clinical assessment of long-term dietary and UV-induced vitamin D status. 7 25-OHD is formed by hydroxylation of cholecalciferol in the liver and circulates in complexes with vitamin D binding protein (VDBP) and albumin. Further hydroxylation of 25-OHD in the kidney is required to form the bioactive circulating hormone 1,25-dihydroxyvitamin D (1,25-OHD). Unlike 1,25-OHD, 25-OHD is not tightly regulated by the body and is more stable, with a half-life of approximately three weeks. 8 The two physiologically relevant forms of 25-OHD are 25-hydroxycholecalciferol (25-OHD3), naturally occurring in the skin, and 25-hydroxyergocalciferol (25-OHD2), a plant derived form of vitamin D often used for supplementation. 9
25-OHD is currently measured by a range of techniques, including various immunoassays including radioimmunoassay (RIA), enzyme-linked immunosorbent assay (ELISA) and chemiluminescence immunoassay (CLIA). It is also measured by high-performance liquid chromatography (HPLC) and liquid chromatography-tandem mass spectrometry (LC-MS/MS). As is usually the case in the modern diagnostic laboratory setting, there is no one standout methodology that excels in all aspects of a laboratory's requirements for an accurate, precise, quick, low-cost automated assay that does not require a high degree of expertise of laboratory personnel. In choosing a platform of measurement for the laboratory, it is often a balancing act in selecting a platform that has as many of these attributes as possible, while compromising in some areas, as long as it performs sufficiently for the laboratory's needs. In order to prepare for the increasing volume of 25-OHD requests, we sought a high throughput automated analyser assay to enhance efficiency within the laboratory, without relinquishing acceptable levels of precision and accuracy.
In the present study, we evaluated the immunodiagnostic systems (IDS) automated competitive binding chemiluminescence 25-OHD method on the IDS-iSYS analyser (IDS-iSYS) and compared it with an established liquid chromatography tandem mass spectrometry (LC-MS/MS) method, as well as an IDS enzyme immunoassay (IDS-EIA).
Materials and methods
Method correlation
A total of 183 patient serum samples were analysed using the IDS-iSYS 25-OHD assay (IDS Ltd, Boldon, UK). These samples were randomly selected from requests received by two vitamin D testing laboratories, one using a published LC-MS/MS method and the other using the IDS-EIA method (IDS Ltd). 10 The patient samples originated from various non-specific requesters located in the South Australian region and covered a range of clinical histories. One hundred and fifteen of these samples had 25-OHD measurements performed by LC-MS/MS before re-analysis by the IDS-iSYS (concentration range 8–154 nmol/L), and a further 64 of the samples were previously measured by the IDS-EIA assay before re-analysis (concentration range 15–203 nmol/L). The measurements from the patient samples were analysed by Passing–Bablok fit and a Bland–Altman difference plot. Statistical analysis was performed using Microsoft Office Excel® 2003, with Analyse-it® Method Evaluation Edition add-in software (Analyse-it Software Ltd, Leeds, UK) and PASW Statistics (SPSS Inc, Chicago, IL, USA).
IDS-iSYS 25-OHD assays were performed as per the manufacturer's instructions and were quality controlled using the manufacturer's three-level control set (IDS Ltd), as well as an in-house normal pool established from the local population. As stated by the manufacturer, the IDS-iSYS 25-OHD assay is traceable to UV quantification, and the calibrator was verified by the manufacturer by comparison to a published isotope-dilution LC-MS/MS method. 11 This method measures both 25-OHD3 and 25-OHD2 independently, and reports the combined total 25-OHD in nmol/L.
The IDS-EIA method was performed on a Biokit Best 2000 ELISA system (Biokit, Barcelona, Spain). Testing was performed according to an IDS-approved protocol using an IDS-EIA reagent kit (IDS Ltd). IDS human serum/buffer matrix calibrators and a two-level control set (IDS Ltd) were used, in conjunction with the in-house normal pool. This method measured both 25-OHD3 and 25-OHD2 together and reports total 25-OHD in nmol/L.
Measurement of 25-OHD by LC-MS/MS was carried out essentially as described by Maunsell et al. 10 Serum samples were mixed with hexa-deuterated 25-OHD3 as internal standard and extracted with hexane prior to analysis of 25-OHD3 and 25-OHD2 on an Agilent 1200 HPLC coupled to an AB SCIEX 3200 Q-Trap tandem mass spectrometer (Applied Biosystems, Ontario, Canada). Pure solutions of 25-OHD3 and 25-OHD2 in ethanol were used as calibrators with concentrations assigned by UV spectrophotometry. 10 25-OHD3 and 25-OHD2 were measured separately and reported as a combined total 25-OHD.
Functional sensitivity
The assay limit of detection (LoD) was determined as outlined by CSLI document EP-17A. 12 A patient sample with a low measured 25-OHD concentration (10.1 nmol/L) was run 20 times on the IDS-iSYS to find the standard deviation (SD) at low concentration. The LoD was then extrapolated from the equation LoD = LoB + 1.645 (SDlow conc. sample), where limit of blank (LoB) was that as determined by the manufacturer. 11,12
Functional sensitivity, or the limit of quantification (LoQ), was determined using a technique compliant with CLSI document EP-17A. 12 A precision profile was plotted after analysing 30 patient serum samples with mean concentrations ranging from 10.1 to 44.5 nmol/L. Samples were run in duplicate once a day for five days and mean concentration plotted against % coefficient of variation (%CV). The LoQ was then determined as being the concentration at CV = 20%.
Imprecision
Within-laboratory imprecision of the IDS-iSYS assay was determined from the analysis of three levels of IDS quality control material at concentrations expected over normal and pathological ranges, as well as an in-house clinically normal pool. The total laboratory precision study protocol encompassed the entire day of routine patient sample analysis, with no less than two hours between runs. The study incorporated at least five different operators, eight separate calibrations and two different reagent lots. The quality control and normal pool samples were run three times daily over eight operational weeks of analysis. A high concentration patient pool was also included to evaluate variation in patient sample matrix at higher 25-OHD concentrations. This sample was run in duplicate, twice a day, for 10 operational days. These precision verifications conform to recommendations outlined in CLSI document EP-5A. 13 The imprecision achieved was compared with the performance of the IDS-EIA and the LC-MS/MS methods, as well as the imprecision claimed by the manufacturer in the kit insert.
Inaccuracy
Inaccuracy of the method in relation to other laboratories and methods was determined by analysing frozen samples from the four cycles prior to analysis (n = 20) of the Vitamin D External Quality Assessment Scheme (DEQAS, UK), with analyte concentrations ranging from 18 to 92 nmol/L, including one plasma sample containing ethylenediaminetetraacetic acid (EDTA) anticoagulant. These data were regressed against the all-laboratory trimmed mean (ALTM) using Passing–Bablok linear fit.
Recovery and non-linearity
Non-linearity and recovery were ascertained by two separate studies of nine serial dilutions from high 25-OHD concentration pooled serum (217 and 144 nmol/L) diluted in low concentration pooled serum (24 and 27 nmol/L, respectively). Each dilution was run in duplicate and the observed (obs) data regressed against expected (exp) value. The data were analysed to determine if there was statistically significant deviation from linearity. Recovery was obtained by finding the observed as a percentage of expected.
Cross-reactivity
Cross-reactivity/25-OHD2 recovery was determined by using three separate patient samples containing known high levels of 25-OHD2 concentrations serially diluted in patient samples containing only 25-OHD3 of known concentration, confirmed by LC-MS/MS. Since vitamin D3 (cholecalciferol) supplements became widely available in Australia, the use of vitamin D2 (ergocalciferol) for supplementation has become relatively rare. Consequently, 25-OHD2 was not detected in the South Australian sample set used for cross-method comparison. The 25-OHD2 cross-reactivity study was conducted in the laboratory of co-author BM located in Queensland, where the 25-OHD2 metabolite is still detected in some samples submitted to the laboratory. Each dilution was run in triplicate on two different days on the IDS-iSYS and the difference assessed for statistical significance.
The Queensland LC-MS/MS method involved mixing serum samples with hexa-deuterated 25-OHD3 as internal standard, and 0.2 mol/L zinc sulphate prior to precipitation with methanol. Samples were extracted using a conditioned Oasis µElution HLB solid-phase extraction plate and a two-step elution protocol. Sample analysis utilized an automated Waters Corporation ACQUITY® auto-sampler, Waters ACQUITY® BEH C8 column (2.1 × 50 mm) and Waters Premier XE mass spectrometer (Milford, MA, USA). The method adopted was carried out as that described by Knox et al. 14 Commercially available serum calibration 25-OHD3/D2 standard (Chromsystems, Munich Germany) and quality controls (UTAK, Los Angeles, CA, USA) were used.
Results
Patient comparison between the IDS-iSYS and the LC-MS/MS methods demonstrated a strong relationship, with a Passing–Bablok fit of iSYS = 1.03LC-MS/MS–6.53, R
2 = 0.82 (Figure 1a). The median 25-OHD concentration for the LC-MS/MS samples as run by the LC-MS/MS was 74 nmol/L, while the IDS-iSYS achieved a median of 72 nmol/L for these samples. The Bland–Altman plot (Figure 1b) demonstrated statistical collinearity with the ideal line of identity with an insignificant systematic bias, where the slope was not significantly different from one (P = 0.18) and with only 5% of samples falling outside the 95% limits of agreement. At our laboratory's established desirable limit for 25-OHD (60 nmol/L), the correlation equation for the LC-MS/MS indicates an IDS-iSYS 25-OHD concentration difference of −5 nmol/L.
15
(a) Scatter plot of IDS-iSYS against LC-MS/MS results with Passing-Bablok fit and (b) Bland–Altman IDS-iSYS–LC-MS/MS scatter plot with 95% limit of agreement. 25-OHD, 25-hydroxy vitamin D; LC-MS/MS, liquid chromatography-tandem mass spectrometry; IDS, Immunodiagnostic Systems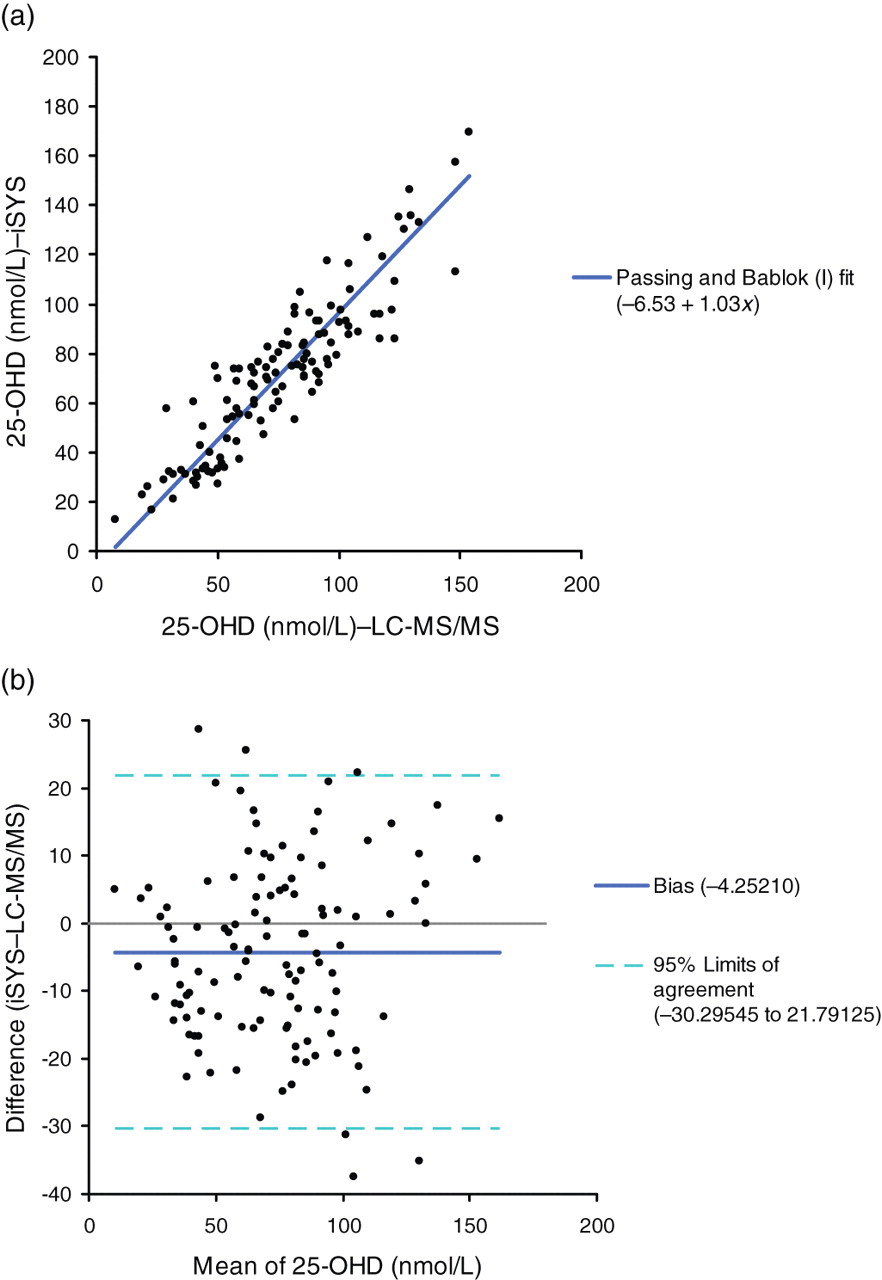
There was also an acceptable agreement between the IDS-iSYS and the IDS-EIA assays, with the IDS-iSYS/IDS-EIA correlation presenting a Passing–Bablok fit of iSYS = 1.07IDS-EIA–1.61, R
2 = 0.86 (Figure 2a). The Bland–Altman plot (Figure 2b) showed there to be <5% of samples falling outside the 95% limit of agreement and confirmed an insignificant bias between methods, with the slope not being significantly different from 1 (P = 0.71), demonstrating that there is statistical collinearity with the ideal line of identity. When using the IDS-EIA correlation equation to assess the theoretical IDS-iSYS 25-OHD concentration, the IDS-iSYS showed a difference of +2.6 nmol/L at IDS-EIA = 60 nmol/L.
15
The median 25-OHD concentration for the IDS-EIA samples was 67 nmol/L as established by the IDS-EIA method, where the IDS-iSYS achieved a median of 73 nmol/L.
(a) Scatter plot of IDS-iSYS against IDS-EIA with Passing–Bablok fit and (b) Bland–Altman IDS-iSYS/IDS-EIA scatter plot with 95% limit of agreement. 25-OHD, 25-hydroxy vitamin D; IDS, Immunodiagnostic Systems; EIA, enzyme immunoassay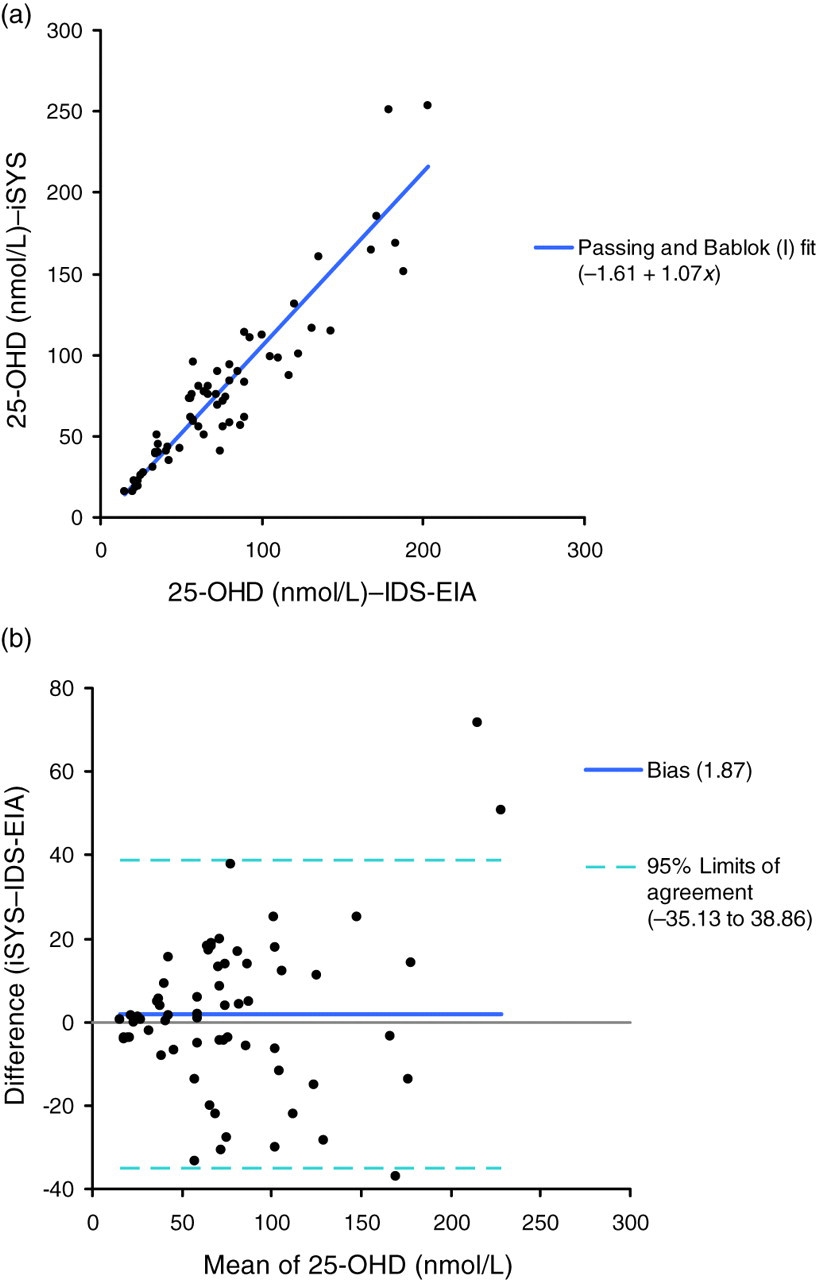
Using the LoB provided by the manufacturer, which according to the IDS-iSYS 25-OHD assay kit insert was 4.5 nmol/L, the LoD was determined to be 9.25 nmol/L (LoD = 4.5 + 1.65(2.89)). The precision profile (Figure 3) is described by the Passing–Bablok fit linear equation: %CV = −9.57Ln (mean conc.) + 44.5. Using this equation to determine the 25-OHD concentration functional sensitivity, where CV≤20%, the LoQ was 13.0 nmol/L.
Precision profile for IDS-iSYS 25-OHD assay, 10 repeats of 30 patient samples, with %CV plotted against mean concentration. 25-OHD, 25-hydroxy vitamin D; IDS, Immunodiagnostic Systems; %CV, % coefficient of variation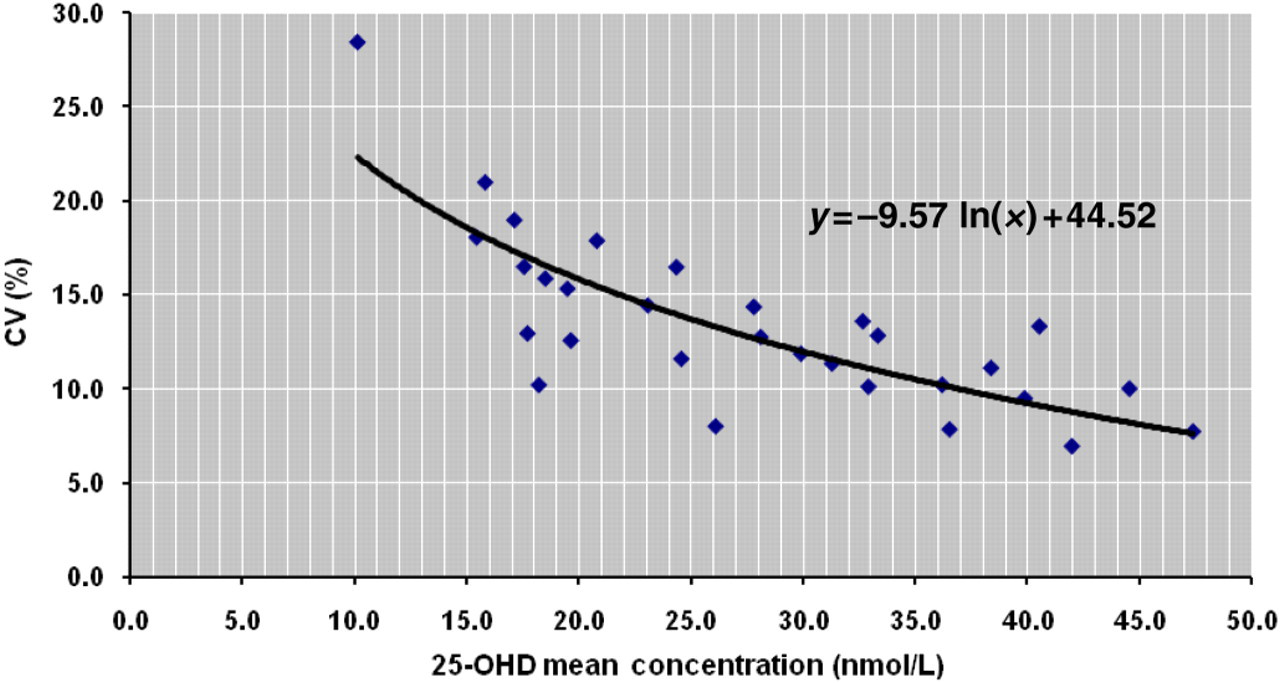
Within-laboratory precision of the IDS-iSYS, IDS-EIA and LC-MS/MS 25-OHD assays
25-OHD, 25-hydroxy vitamin D; LC-MS/MS, liquid chromatography-tandem mass spectrometry; IDS, Immunodiagnostic Systems; %CV, % coefficient of variation
The 25-OHD results for the DEQAS survey samples run on the IDS-iSYS are shown in Figure 4 plotted against the ALTM values. The Passing–Bablok equation for the relationship was IDS-iSYS = 0.93ALTM + 3.79, R
2 = 0.94. The EDTA plasma sample measured 30.6 nmol/L on the iSYS, which was 45% lower than the DEQAS ALTM of 55.3 nmol/L for this sample. This outlying sample was not included in the statistical analysis.
Inaccuracy of IDS-iSYS DEQAS concentrations plotted against ALTM concentrations with Passing–Bablok fit. ALTM, all-laboratory trimmed mean; IDS, Immunodiagnostic Systems; DEQAS, Vitamin D External Quality Assessment Scheme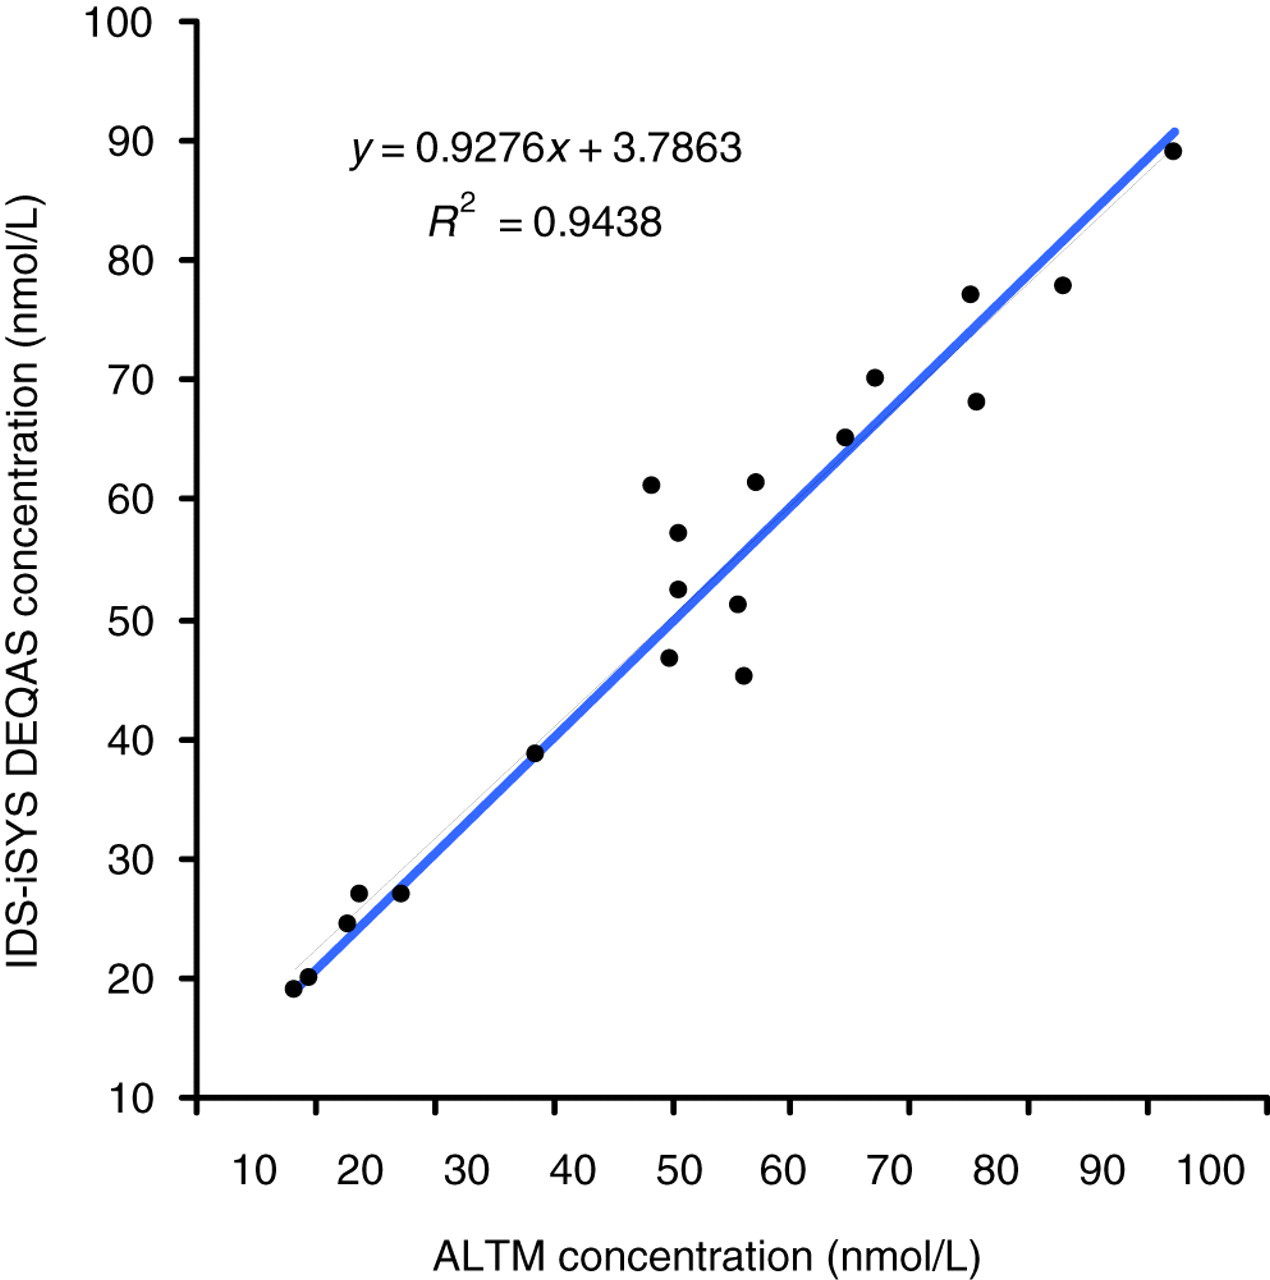
Table 2 presents the results achieved from both linearity dilution studies and recovery of obs/exp. The linearity studies were plotted observed (obs) against expected (exp) (Figures 5a and b) to give Passing–Bablok linear fit of obs1 = 0.93exp1 − 5.05, R
2 = 0.99; and obs2 = 0.97exp2 + 6.07, R
2 = 0.97. Both experiments show the assay to be linear, where the intercept of the fitted lines were not significantly different from zero (P = 0.256 and P = 0.654, respectively). Recovery ranged from 81% to 129%, with a mean recovery of 97% ± 13% SD.
Dilution linearity plots of (a) expected (exp1) plotted against observed (obs1) for sample 1 and (b) expected (exp2) plotted against observed (obs2) for sample 2 Linearity dilution studies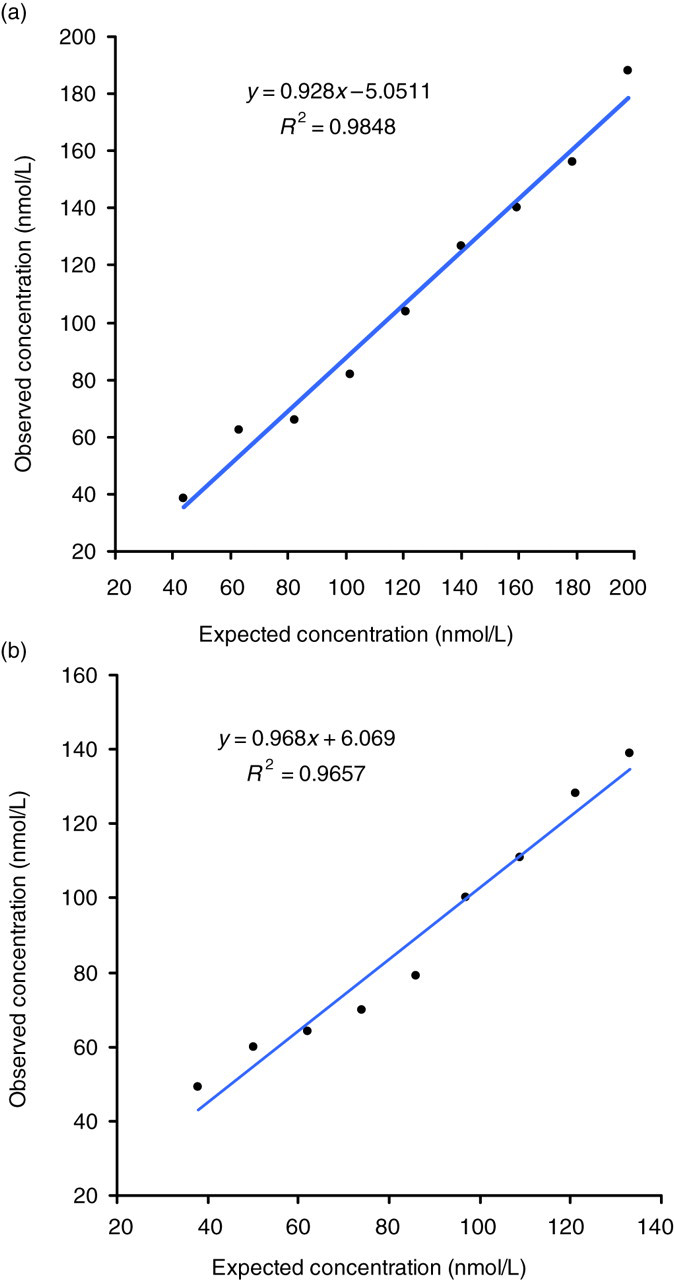
The cross-reactivity of 25-OHD2 and 25-OHD3 for the IDS-iSYS 25-OHD assay in this study demonstrated no significant difference to the calculated total 25-OHD determined from LC-MS/MS (total 25-OHD calculated by adding 25-OHD2 + 25-OHD3), resulting in good regression as shown in Figure 6 (r
2 = 0.91, 0.97 and 0.98 for the three experiments). The data in Table 3 demonstrate that the slopes of the fitted lines are not significantly different from 1 (P = 0.054, P = 0.734 and P = 0.781, respectively), which shows that there is statistical collinearity with the ideal line of identity. The % recovery for samples containing various concentrations of 25-OHD2 ranged from 90% to 130%, with a mean recovery of 107% ± 9% SD. This was comparable to the recovery achieved on samples containing 25-OHD3 only.
25-OHD2 cross-reactivity plot for sample dilutions 1, 2 and 3; calculated total 25-OHD from measured LC-MS/MS 25-OHD3 and 25-OHD2, plotted against measured IDS-iSYS total 25-OHD. 25-OHD, 25-hydroxy vitamin D; IDS, Immunodiagnostic Systems; LC-MS/MS, liquid chromatography-tandem mass spectrometry Cross-reactivity of samples containing 25-OHD2 on IDS-iSYS 25-OHD, 25-hydroxy vitamin D; LC-MS/MS, liquid chromatography-tandem mass spectrometry; IDS, immunodiagnostic systems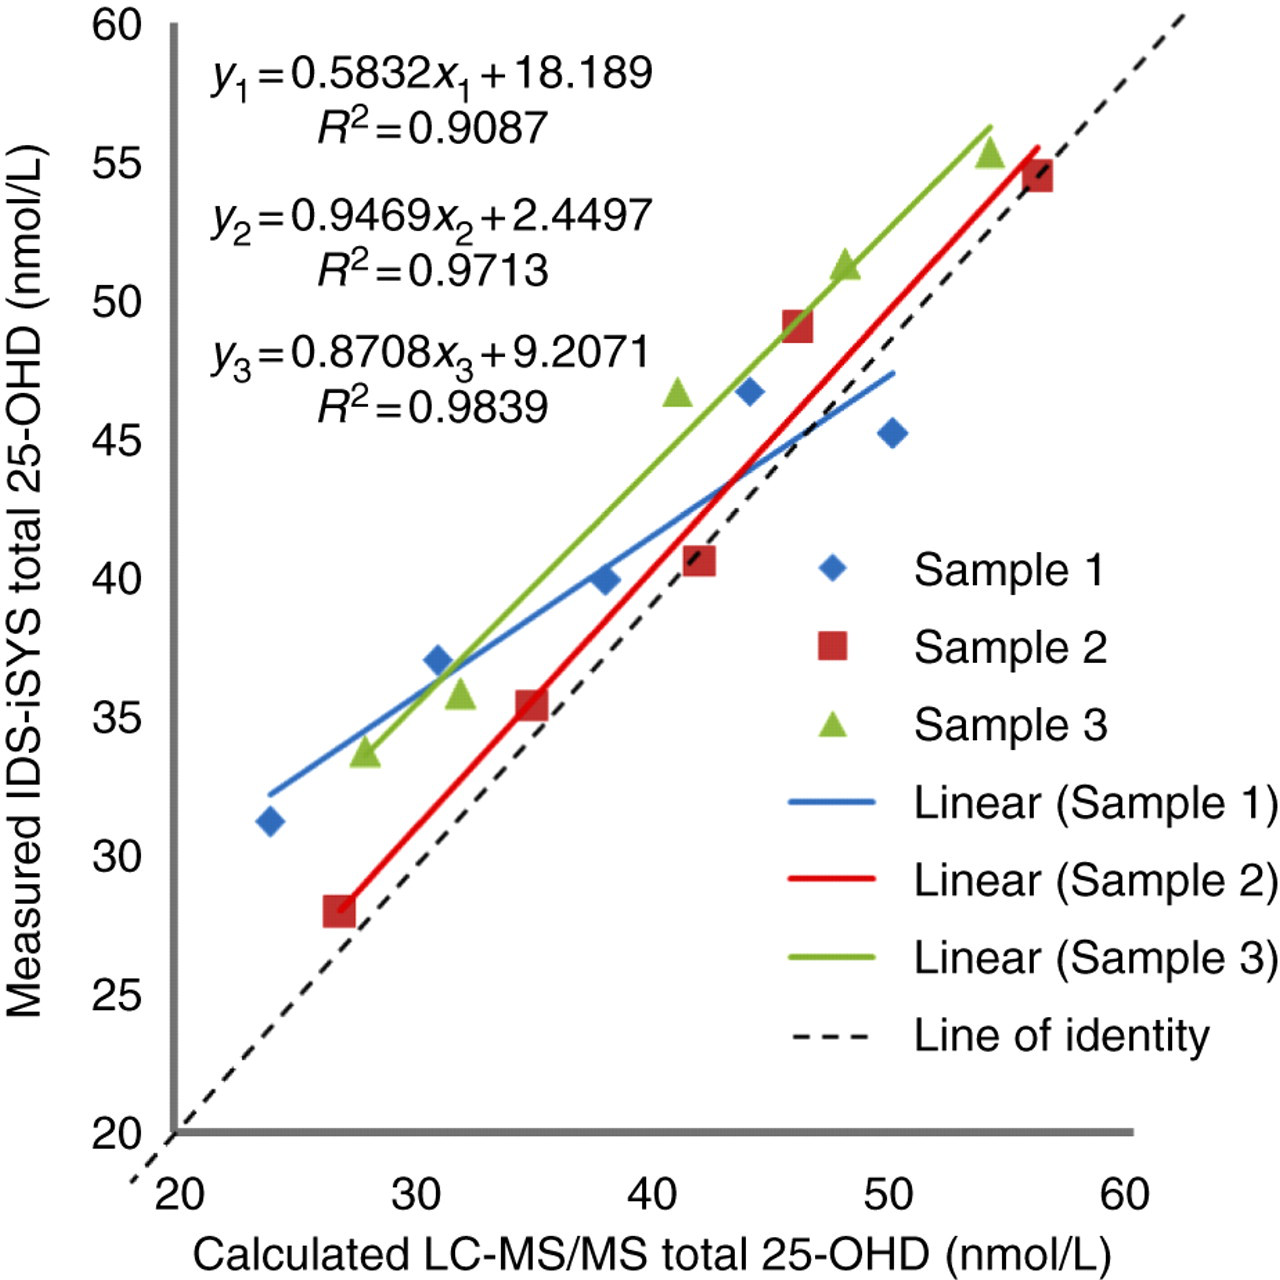
Discussion
In the dynamic environment of diagnostic chemical pathology, there is an advancing tendency towards automation of immunoassays utilizing externally manufactured reagents (now comprising 90% of the market in Australia). 9 It is a responsibility of the clinical laboratory to provide the best service to patients by scrutinising these products to ensure that they provide the performance that is claimed by the manufacturer. Using preliminary evaluation data provided by the manufacturer as a baseline, the further external evaluation that we conducted for this new assay was considered important in the assessment of the validity of the assay in our laboratory, and as an aid to other end users in future decisions on 25-OHD automation.
The correlation data of the assay achieved by this evaluation as compared with the LC-MS/MS reference method and the IDS-EIA method showed more scatter than the IDS produced correlation (r 2 = 0.87 for RIA and r 2 = 0.97 for LC-MS/MS). Despite this, the correlation data are comparable with other published evaluations performed on similar automated 25-OHD immunoassays, with a slope closer to 1 than other reports comparing to LC-MS/MS. 18 These data did not display significant systematic bias (mean bias of −4.41 nmol/L for the LC-MS/MS and +1.87 nmol/L for the IDS-EIA) as compared with that found in other comparative studies. 19
The LoD determined in this evaluation to be 9.25 nmol/L was consistent with a LoD of 9 nmol/L claimed by the manufacturer. 11 In our evaluation we used the manufacturer's stated LoB for the calculation of LoD because there was insufficient suitable blank material available.
As the LoD does not necessarily meet predefined requirements of bias and imprecision, the functional sensitivity must also be determined. The LoQ at CV≤20%, as determined in this study (13.0 nmol/L), essentially agrees with the bottom limit of the recommended measuring range (12.5 nmol/L) and confirms this lower limit to be reliable. 11
The imprecision findings in this study (5.6–13.4%) are at least as good as the figures claimed by the manufacturer (8.9–16.9%CV) at similar concentration levels. 11 The imprecision of the IDS-iSYS did, however, show greater within-laboratory variation compared with both the IDS-EIA (5.1–8.4%) and LC-MS/MS (4.6–6.6%) platforms over the same range (see Table 1). Despite this, the imprecision is comparable to the reported imprecision of other similar automated immunoassay platforms, such as the LIAISON® (DiaSorin SpA, Saluggia, Italy) and Modular (Roche Diagnostics, Mannheim, Germany). 16–18 As there were no outliers in the data-set, no results were excluded from the analysis.
The inaccuracy study conducted on the IDS-iSYS showed the assay to perform well compared with the ALTM calculated from various 25-OHD assay platforms. It has been suggested from review of the performance of available 25-OHD assays that an intercept of ±5 nmol/L from the ALTM is an acceptable bias, as the basic methodologies employed for the different assays (either immunoassay or chromatography) are quite different in their principles. 19 The finding of low recovery (−45%) compared with the ALTM for the DEQAS EDTA sample is consistent with the manufacturer's claims that EDTA anticoagulant should not be used for this assay.
From the two linearity experiments conducted in the present study, the IDS-iSYS assay was found to be linear to at least 214 nmol/L.
The present study found the recovery of 25-OHD2 to be consistent with the manufacturer's claims of 100% cross-reactivity with the plant-derived form. As the administration of oral vitamin D2 has been all but phased out in many regions, such as South Australia, this investigation is only of consequence in those regions where this supplement is still readily available.
The performance of the IDS-iSYS 25-OHD assay in this evaluation suggests this is a suitable rapid automated assay for 25-OHD analysis for use in the clinical diagnostic laboratory. This platform allows the analysis of over 600 patient samples within a normal eight-hour working day. The IDS-iSYS 25-OHD assay provides good overall performance, while providing very high throughput. This in turn has improved work flow and increased efficiency within our laboratory.
DECLARATIONS