
Abstract
Background
Previous stability studies of plasma free metanephrines do not extend beyond one month. For retrospective evaluation and documentation purposes, knowledge of stability for more prolonged storage periods is required.
Methods
A panel of seven plasma samples was aliquoted and stored at −20 and −80°C. Aliquots were thawed and assayed by high-performance liquid chromatography with electrochemical detection at regular intervals during three years. A final set was assayed after five years at −80°C. Results were evaluated by repeated-measures analysis of variance.
Results
After a stable period of over one year, an upward trend for plasma free metanephrine and a downward trend for normetanephrine was observed. For both analytes, measurement results were parallel between samples during the study. Concentrations in samples stored at −20°C did not differ from those stored at −80°C.
Conclusions
Storage at either −20 or −80°C must be considered as safe for at least one year. The residual variation with respect to time of the concentrations of metanephrines was identical in all of the samples assayed and almost did not exceed previously determined within-run variation. This suggests that between-assay variability is the cause of the overall trends and not sample deterioration. Moreover, between-assay variability manifesting itself as drift or trend remained within the range of earlier observed between-assay variation. Despite this, the assay for plasma metanephrines remains capable of detecting catecholamine overproduction in plasma samples that have been stored for prolonged periods of time.
Previously, 1 we reported on the stability of plasma free metanephrines for periods of up to 72 h at room temperature and 4°C and to one month at −20°C. It was shown that blood samples can be kept at 4°C for up to six hours before centrifuging and in plasma, free metanephrines did not fall by more than 5% within three days. At −20°C, samples remained stable for at least one month. Sets of aliquots of the same seven samples (five from healthy volunteers, two identical pooled plasma samples, to one of which glutathione had been added) were stored at −80 and −20°C for studying longer time stability. These were thawed after 4, 8, 12, 18, 24, 30 and 36 months for free metanephrine (MN) and normetanephrine (NMN) assay by high-performance liquid chromatography (HPLC) with electrochemical detection. 1 One set remained at −80°C and was assayed after 60 months.
Storage time and temperature effects were assessed by repeated-measures analysis of variance (ANOVA) (SPSS v16) with time and temperature as within-subject factors. Sample/time interaction was recorded for the two temperatures, both overall and separate. Also the ratio of levels at −20°C versus −80°C was investigated for time effect. Pearson correlation coefficients were calculated in order to detect possible trends.
The time course of mean ± SEM of MN and NMN at −80 and −20°C is shown in Figure 1.
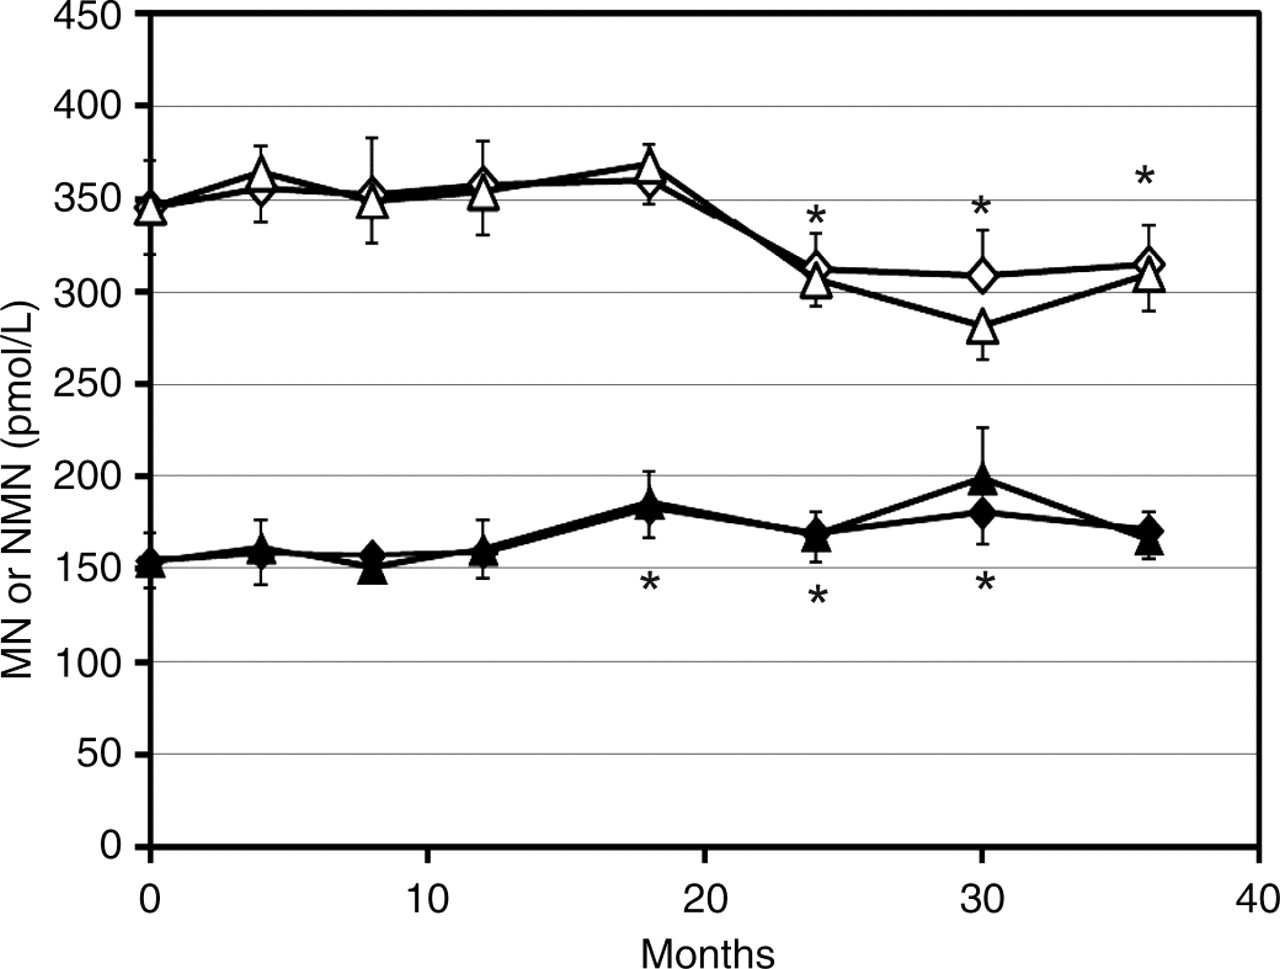
Mean ± SEM levels of plasma free metanephrine (closed symbols) and normetanephrine (open symbols) after storage at −80°C (diamonds) and −20°C (triangles) for periods up to three years. Asterisks indicate significant differences with respect to t = 0
Significant effects of storage time, but not of temperature, were detected for both MN and NMN. MN was significantly higher than at t = 0 after 18, 24 and 30 months but not after 36 months. NMN became significantly lower compared with its initial value from 24 months onward. This phenomenon was corroborated by the detection of an upward trend of 4.5%/year for MN (r 2 = 0.56) and a downward trend of −5.9%/year for NMN (r 2 = 0.71) at −80°C. These trends were closely paralleled by results at −20°C, witnessed by the fact that the ratios of measurement results obtained at the two temperatures did not change with time and averaged close to unity (1.01 and 0.99). This suggested that measurement results at the two temperatures within the same assay run could be considered as each others' duplicates and be representative of within- assay variation. Indeed, the duplicate coefficients of variation (CVs) were 8.0% and 4.6%, respectively, fairly close to the within-assay CVs reported previously. 1 Residual variation, including possible interaction between time and sample as obtained from ANOVA was 10.1% for MN and 5.2% for NMN, which is fairly close to the within-run CVs just mentioned. However, when assessed separately, residual variation of MN (not of NMN) differed for −80 and −20°C: 6.6% and 13.1%, respectively; the latter being significantly higher than the within-run CV (P < 0.001). Closer analysis revealed an exceptional residual variation for the −20°C run at 30 months. When left out, a CV of 10.5% remained, still higher (P < 0.05) than the within-run CV. Addition of the reducing agent glutathione had no detectable effect. After five years at −80°C, values had increased by 17% (MN) and 19% (NMN) as compared with the last previous measurement two years earlier.
To our knowledge, until now, no stability studies have been performed or reported concerning such a prolonged period of time. In our previous studies on stability of plasma free 1 and urinary 2 metanephrines we were able to perform all measurements on each sample after varying storage periods in a single assay run, because we thought it justified to assume that storage at −20° or −80°C for the relatively short study periods not exceeding one month would not endanger the integrity of the analytes. In contrast, long-term storage stability studies are hampered by the fact that measurements have to be performed at different points in time during the experiment, thus inevitably introducing between-assay variability into the measurements. This is crucial with regard to the interpretation of the observed trends. Characteristic for between-assay variability is its systematic nature, i.e. that it is common to all measurements of the same analyte for all samples, meaning that measurement results on different samples relative to one another are constant from assay run to assay run and subjected only to within-assay variation (not counting interaction with the measurement level). However, different analytes may display different patterns, depending on the analytical method. In the present HPLC method with coulometric detection, both analytes are quantified by means of an internal standard with a retention time different from both MN and NMN, so that between-run variations in these analytes may or may not be parallel. Other potential sources of variability or trend are freeze-drying of the samples, in spite of extensive sealing of the tubes, and obviously, deterioration of the analyte(s). Freeze- drying is expected to have the same effect on all analytes within a sample, whereas deterioration with time is likely to be sample- and temperature-dependent.
At first, it must be observed that MN apparently rises with time, which obviously is inconsistent with deterioration of the molecule. It could be a freeze-drying effect, but if this were to be true, why not for NMN, which apparently decreases? Moreover, both effects occur at −80 and −20°C to the same extent. Freeze-drying or deterioration is expected to affect the measurement results in a sample-dependent manner, statistically resulting in time–sample interaction exceeding the residual within-run variation. This apparently is the case for MN at −20°C, but not for MN at −80°C and NMN at either temperature. Therefore, imperfect long-term assay stability seems to be a more likely explanation. Indeed, the between-run coefficients of variation (11.8% and 16.2% for MN and 8.4% and 10.3% for NMN at −80 and −20°C, respectively) appearing as assay drift are relatively close to the between-run CVs reported earlier 1 (11.1% for MN and 8.0% for NMN). Moreover, the performance of the analytical method in an External Quality Assessment Scheme, that became available during the last year of this study, shows a similar time course. Over a two-year period the CVs with regard to the all labs median were 11.1% for MN and 6.6% for NMN (n = 24).
In summary, storage at either −20 or −80°C must be considered as safe for at least one year. For longer periods the stability of the assay itself may be a more important factor than sample stability. It is doubtful, however, that the observed variability will significantly impair the capability of detection of catecholamine overproduction such as in pheochromocytoma.
DECLARATIONS