
Abstract
A 52-year-old Japanese woman was referred to our hospital because of fever and coxalgia. She had a white blood cell count of 241 × 102/μL with 59.6% blasts, which had a high nuclear/cytoplasmic ratio and variably condensed nuclear chromatin. Flow cytometry and chromosomal analysis of bone marrow cells indicated positive findings of CD10, CD19, CD34, HLA-DR antigens and t(9; 22)(q34; q11.2), respectively. No rearrangements of bcr/abl in peripheral blood neutrophils were found by fluorescence in situ hybridization, suggesting that she had B-acute lymphoblastic leukaemia with Ph chromosome. Blood glucose and HbA1c (glycated haemoglobin) levels on admission were 23.4 mmol/L and 21.0%, respectively. The results of 1.5 anhydro-
Introduction
Haemoglobin (Hb) is a 64.4 kDa tetramer consisting of two pairs of globin polypeptide chains: one pair of α-like-chains and another pair of non-α chains. HbA (α2/β2) accounts for more than 90% of the total Hb in red blood cells (RBCs) of adults and children over six months of age. When Hb from normal adult RBCs is analysed by column chromatography, several minor components with lower isoelectric points than HbA can be detected. These are designated A1a1, A1a2, A1b and A1c. HbA1c accounts for approximately 4.3–5.8% of the Hb in normal adult RBCs. This minor component differs from HbA only at the N-terminal amino group of each β-chain, in which glucose is non-enzymatically attached by a ketoamine linkage.
Glucose becomes gradually and irreversibly bound to Hb during the life of a RBC, at a rate dependent on the blood glucose (BG) concentration. Also, more HbA1c molecules are formed at higher BG concentrations. RBCs are destroyed every day, while an equal number of new RBCs are formed. Thus, the average amount of glycosylated Hb changes dynamically and reflects the mean BG over the previous six to eight weeks. 1 Measurement of HbA1c levels provides a common means to assess long-term glycaemic control in individuals with diabetes mellitus (DM).
According to a National Health and Nutrition Examination survey, diagnosis of DM when the HbA1c level exceeded 5.8% had the highest sensitivity (86%) and specificity (92%) among all methods used to diagnose DM in the population from 1999 to 2004. 2 An HbA1c level over 15.2% is beyond the mean + 3 standard deviation level found in the DM patient population. 3 Furthermore, the National Academy of Clinical Biochemistry in the United Kingdom recommends repeating HbA1c analysis when extreme results (<4% or >15%) are encountered in clinical practice, because these extreme values suggest the presence of haemoglobinopathies. 4 Such cases should be examined using methods other than electrophoresis to investigate other possible causes of elevated HbA1c. The accuracy of HbA1c measurements determined by commercially available assays can be profoundly affected by genetic variants of Hb. 5,6
Last year, the Japan Diabetes Society (JDS) advised the measurement of HbA1c, as recommended by the National Glycoprotein Standardization Program (NGSP), instead of measuring the HbA1 levels, as previously recommended by the JDS. The value of HbA1c, which is equivalent to the internationally used HbA1c (%) defined by the NGSP, is expressed by adding 0.4% to the HbA1 (%) defined by the JDS. 7
Here, we report the case of a patient with acute lymphoblastic leukaemia (ALL) who had an extremely high HbA1c level (>20%) but no haemoglobinopathy. To our knowledge, this is the first report of an acute leukaemia case in which the patient expressed an extremely high level of HbA1c.
Patient and methods
A 52-year-old Japanese woman was referred to our hospital because of fever and coxalgia lasting for one month. She showed no history of body weight loss, fatigue or pollakuria. One year before visiting us, she was diagnosed as having mildly impaired glucose tolerance. There was no family history of haemoglobinopathy.
On admission, her RBC count was 396 × 104/μL, Hb 108 g/L, haematocrit 31.3%, reticulocyte count 0.83 × 10⁴/μL, mean corpuscular volume (MCV) 79 fL, mean corpuscular Hb concentration 35.1%, mean corpuscular Hb 22.8 pg, platelet count 3.2 × 10⁴/μL and white blood cell (WBC) count 241 × 102/μL. A differential count of WBC revealed that 59.6% were blasts, 0.2% promyelocytes, 0.2% myelocytes, 1.0% metamyelocytes, 3.4% stab neutrophils, 10.8% segment neutrophils, 23% lymphocytes, 0.2% eosinophils and 1.6% monocytes. The results of biochemistry examinations were as follows: alanine aminotransferase, 42 IU/L; aspartate aminotransferase, 15 IU/L; C-reactive protein (CRP), 242.6 g/L; lactate dehydrogenase, 1770 IU/L; blood urea nitrogen, 3.26 mmol/L; creatinine, 49.6 μmol/L; uric acid, 398.8 μmol/L; serum iron, 21.7 μmol/L; total iron-binding capacity, 45.7 μmol/L; and ferritin, 1555 μg/L. Although the value of CRP was high, there were no abnormal findings as determined by computed tomography of the whole body.
A bone marrow aspirate demonstrated hypercellularity and infiltration of 70% blasts with a high nuclear/cytoplasmic ratio and variably condensed nuclear chromatin. A specific staining of blasts by myeloperoxidase was negative. No sideroblasts by Prussian Blue staining were found in the bone marrow, suggesting that the patient was in an iron-deficient state but did not have sideroblastic anaemia. Flow cytometry of bone marrow blasts showed strong cell surface expression of CD10 (95.6%), CD19 (99.2%), CD34 (96.9%) and HLA-DR (97.7%). A chromosomal analysis of bone marrow cells showed t(9; 22)(q34; q11.2) (20/20 cells). No rearrangements of bcr/abl on the interphases of peripheral blood neutrophils were found by fluorescence in situ hybridization. The patient was thus diagnosed as having B-ALL with Ph chromosome. Starting three and seven days following her admission, treatment was initiated with imatinib mesylate (400 mg, per os) and hyper-CVAD (600 mg/m2 of cyclophosphamide, intravenously, on days 1–3; 2 mg/body of vincristine, intravenously, on days 4 and 11; 50 mg/m2 of doxorubicin, intravenously, on day 4; and 40 mg/body of dexamethasone, intravenously, on days 1–4 and 11–14), respectively. The patient achieved complete remission (CR) after the first course of hyper-CVAD. During her first course of chemotherapy, she received an 800 mL red blood cell transfusion. When this patient achieved CR, her RBC count was 294 × 104/μL, Hb 92 g/L, haematocrit 27.5%, MCV 93.5 fL, reticulocyte count 7.35 × 10⁴/μL and serum iron 17.4 μmol/L.
This patient never complained of thirst or body weight loss before or after admission. On admission, her BG concentrations at one hour after breakfast, before dinner and before bedtime were 23.4, 23.2 and 22.8 mmol/L, respectively. Her HbA1c level, measured by high performance liquid chromatography (HPLC; Toso, Tokyo, Japan; HLC 723G8), was 21.0% (NGSP). Because her BG and HbA1c were markedly elevated, additional tests related to DM were performed. Her 1,5-anhydro
However, her very high HbA1c level and microcytic anaemia with normal serum iron also suggested the possibility that she suffered from haemoglobinopathies in addition to DM. Her RBCs were morphologically normal, and no Heintz body staining by 0.5% Brilliant Green was found. No extra, separated peak was seen in the HPLC profile of Hb. The values of HbF and HbA2, measured by cellulose acetate electrophoresis, were within reference ranges. The result of an isopropanol test that indicates whether Hb is unstable was negative, and a glycerol lysis test, which shows prolonged lysis in the case of unstable haemoglobinopathies and thalassemia, was normal.
Sequence analyses of the α1-, α2- and β-globin genes were performed seven days after admission, following previously described methods. 8,9 Tests to detect substitutions in the nucleotide sequences of the Hb genes were carried out using genomic DNA extracted from peripheral blood. The polymerase chain reaction produced an approximately 1-kb product, which was sampled and directly sequenced. All results of sequence analyses of α1-, α2- and β-globin genes were normal.
Insulin therapy was started on the patient's first hospital day. Her average BG before meals on the second, third and fourth hospital day was 27.1, 13.5 and 17.1 mmol/L, respectively. The patient's BG before meals gradually decreased to less than 11.1 mmol/L and her HbA1c level decreased to 10% one month after admission. The HbA1c level decreased further to 7.4% in the following month (Figure 1).
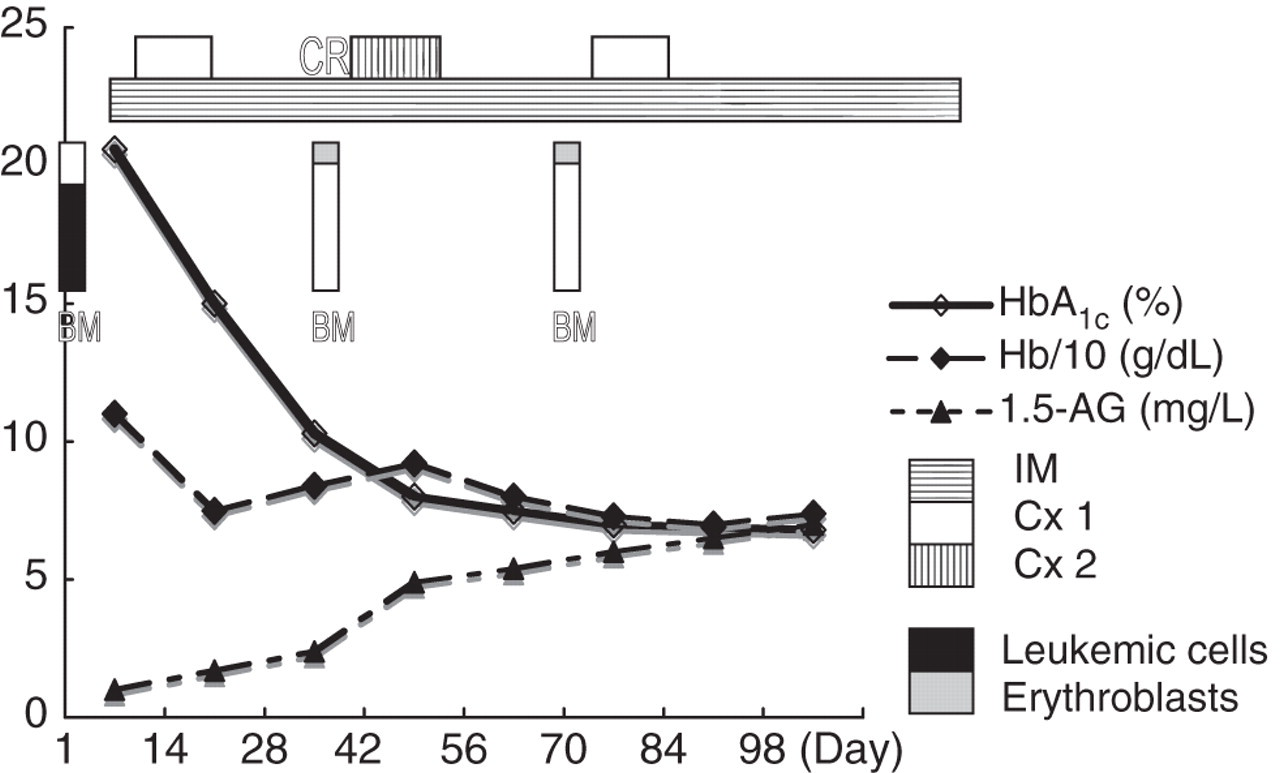
Changes of HbA1c and 1,5-AG during the clinical course. HbA1c and 1,5-AG improved after the initiation of insulin therapy and chemotherapy. The HbA1c level was extraordinarily elevated on admission. This level decreased in association with a decreased number of bone marrow blasts. At day 98, the values of HbA1c and 1,5-AG were 7.2% and 7 mg/L, respectively. The percentage of bone marrow erythroblasts was 1%, 10% and 9% on admission, at CR, and after the first consolidation therapy, respectively. CR, complete remission; BM, bone marrow; IM, imatinib mesylate; Cx 1, Hyper-CVAD; Cx 2, high-dose methotrexate and cytosine arabinoside
Discussion
We report the case of an ALL patient who presented with an extremely high level of HbA1c (21.0%) on admission. Her value of HbA1c was the highest in our hospital and was the second highest reported in the literature. 10–13 No symptoms associated with DM were observed, e.g. body weight loss, thirst or fatigue. Also, anaemic patients usually show lower HbA1c levels than the value expected from her BG concentration and clinical symptoms, reflecting a shortened erythrocyte age. 14 Besides, this HbA1c level was by far the highest, and she was the only one with an HbA1c value of above 18% among a total of 17,356 patients whose HbA1c levels were measured between January 2007 and December 2009 in our hospital, which provides a primary care unit to a tertiary emergency room for diabetes care. A variety of diabetes patients have been treated at our institute. Regarding the extremely high HbA1c value seen only in DM patients, cases with HbA1c 21.6% 12 and 19.9% 13 have been reported in the literature. However, the patient with an HbA1c value of 21.6% had severe diabetes-related symptoms such as a body weight loss of 30 kg over a short period and showed a very high BG of 43.0 mmol/L. 12 The patient with an HbA1c value of 19.9% visited the emergency department complaining of fatigue and had a BG of 20.6 mmol/L and GA of 98.5%. 13 We cite these two articles as examples of extremely high HbA1c levels associated with diabetes. However, these two patients exhibited typical diabetes-associated symptoms and higher BG and GA concentrations compared with our case. Our patient had no symptoms associated with diabetes and her BG after meals was 23.4 mmol/L. Since insulin therapy was started immediately after her admission, her BG decreased. She had no triopathy of diabetes on admission and no retinopathy, even after the induction of insulin therapy.
Several diseases in addition to DM, as well as chemicals that elevate HbA1c levels, have been reported: congenital haemoglobinopathies, 5,6 acquired haemoglobinopathies 15 and iron deficiency anaemia. 16–18 Alternatively, any condition that increases the average age of circulating erythrocytes, like splenectomy that delays RBC clearance, 19,20 and any condition that decreases erythropoiesis, like aplastic anaemia, 20,21 elevates the HbA1c level. On the other hand, it is well known that increased numbers of reticulocytes in the circulation decrease the erythrocyte mean age and decrease HbA1c levels in haemolytic anaemia patients. Although certain disease states will alter the erythrocyte lifespan, there appears to be significant interindividual variation in the mean erythrocyte age in those without known haematological disorders, potentially accounting for some of the variation in HbA1c among individuals without diabetes. 22
At first, we considered any complication of haemoglobinopathies as a possible underlying disease that could elevate this patient's HbA1c to more than 20%. More than 10 types of congenital haemoglobinopathies have been reported to elevate HbA1c levels. 5,6 Some of them are associated with HbA1c levels 10 times above normal. Mutations of the α-chain have been observed for only three haemoglobinopathies associated with elevated HbA1c levels: Hb Hanamaki, Hb Kanagawa and Hb Turiff. 5,6 On the other hand, 12 haemoglobinopathies due to β-chain mutations have been associated with high HbA1c levels; their mutation sites were frequently focused on codons 1, 2 and codons near a stop codon (mutations at codon 1: Hb Niigata, Hb South Florida, Hb Releigh and Hb Long Island/Marseilles; mutations at codon2: Hb Okayama and Hb Gratz; and mutations at codons near a stop codon: Hb Hope [codon 136], Hb Old Dominican [codon 143] and Hb Mito [codon 144]). 5,6 For our patient, the results of sequencing the α1-, α2- and β-globin chains were absolutely normal, indicating that congenital haemoglobinopathies were not responsible for her clinical complications.
Secondly, haematological findings of this patient on admission showed that she had microcytic anaemia, which usually suggests iron deficiency anaemia or anaemia of chronic disorders. A decrease of serum iron is essential for diagnosis of these two disorders. However, the value of serum iron was within normal limits for our patient and no sideroblasts were found by Prussian Blue staining of the bone marrow. These findings may suggest that she had a latent state of iron deficiency, but not iron deficiency anaemia, due to some cause such as haemorrhage in association with thrombocytopenia due to ALL. In addition, bone marrow findings of this patient showed a remarkable suppression of erythropoiesis, suggesting that utilization of serum iron was disturbed in her bone marrow. It is thought that latent iron deficiency and suppression of erythropoiesis might cause microcytic anaemia even in the presence of normal serum iron, which might partially contribute to an increase of HbA1c levels by prolonging the erythrocyte lifespan. In fact, the extremely high level of HbA1c in our patient rapidly decreased upon recovery of erythropoiesis in the bone marrow and transfusion after chemotherapy for ALL (Figure 1).
Finally, the patient's extremely high HbA1c level was mainly due to DM. The mean BG may be estimated using the formula from NGSP: estimated average glucose = 28.7 × HbA1c (NGSP)–46.7. 23 However, this formula may not be commensurate with the actual mean BG when the patient has an extremely high HbA1c, as in the present case.
To our knowledge, this is the first reported case of acute leukaemia presenting with an extremely high HbA1c level. In certain conditions, an acute leukaemic patient with diabetes may present with an extremely high HbA1c level, without any symptoms associated with hyperglycaemia.
DECLARATIONS